Hello
It's a Bitcoinguide.
If you have a "follower"
You can receive comment notifications on real-time travel routes and major sections.
If my analysis is helpful,
Please would like one booster button at the bottom.

Here is the Nasdaq 30-minute chart.
There are indicators released at 9:30 and 12:00.
First of all, Nasdaq reached a very important point on the chart
yesterday morning.
In a situation where there is no particular movement due to Trump's tariff policy,
it continues to flow downward.
As far as I remember, the US is a country with a lot of showmanship.
I've experienced it a lot while analyzing charts.
There are two indicators released today,
The Bollinger Band monthly central line touches on the chart + two indicators released,
so there is a very high possibility that Nasdaq will go up.
In the end, it's an action and a play on words to pick up and put down the ants,
and it won't be operated to the point where the US is destroyed.
Since there is a stop loss, we proceeded very aggressively.
As you can see, in the indicator announcement time zone,
the blue finger is short->long
or the red finger is long.
The rebound from the bottom is a condition for a sweep when looking at the chart upside down, so if successful, a surge can occur.
I just applied it to Bitcoin.

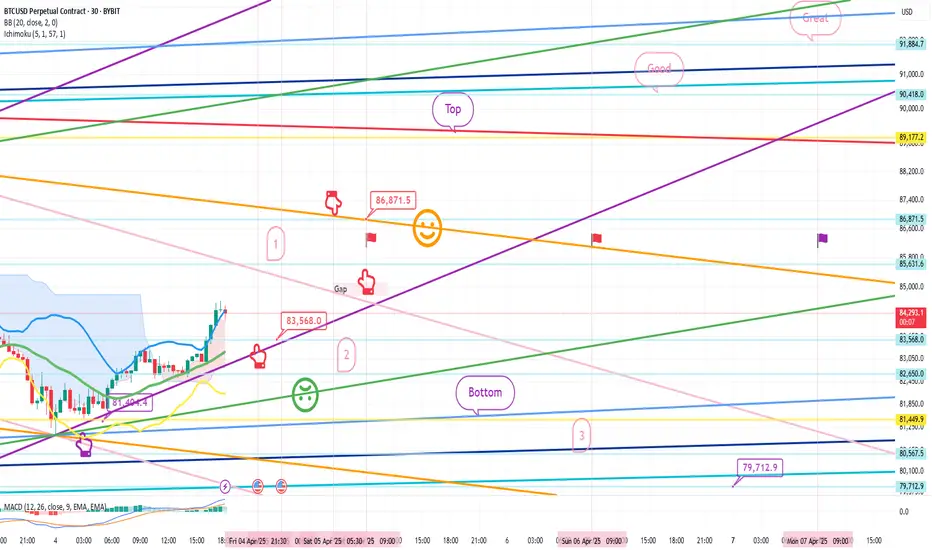
This is a 30-minute Bitcoin chart.
I marked the daily closing section for each flag,
and the purple flag on the far right is next Monday.
The purple finger on the lower left
is connected to the 81,404.4 dollar entry point yesterday, April 3.
Because it is touching the center line of the Bollinger Band 12-hour chart,
you need to hold on until 9 o'clock when additional candles are created to go up more.
*One-way long position strategy when the red finger moves
1. 83,568 dollar long position entry point / stop loss price when the green support line is broken
2. 86,871.5 dollar long position 1st target -> Top 2nd target
After that, target price in order.
If the strategy is successful, the 1st section that returns
You can use the long position re-entry section
The movement within the 1st section at the top and the 2nd section at the bottom is a sideways market.
If there is a crash in Nasdaq
It can drop below the bottom
And it can drop to 79.7K 3 times over the weekend, so please take note.
Up to this point, my analysis
Please just refer to and use it
I hope you operate safely with principle trading and stop loss prices.
You worked hard this week too.
Thank you.
It's a Bitcoinguide.
If you have a "follower"
You can receive comment notifications on real-time travel routes and major sections.
If my analysis is helpful,
Please would like one booster button at the bottom.
Here is the Nasdaq 30-minute chart.
There are indicators released at 9:30 and 12:00.
First of all, Nasdaq reached a very important point on the chart
yesterday morning.
In a situation where there is no particular movement due to Trump's tariff policy,
it continues to flow downward.
As far as I remember, the US is a country with a lot of showmanship.
I've experienced it a lot while analyzing charts.
There are two indicators released today,
The Bollinger Band monthly central line touches on the chart + two indicators released,
so there is a very high possibility that Nasdaq will go up.
In the end, it's an action and a play on words to pick up and put down the ants,
and it won't be operated to the point where the US is destroyed.
Since there is a stop loss, we proceeded very aggressively.
As you can see, in the indicator announcement time zone,
the blue finger is short->long
or the red finger is long.
The rebound from the bottom is a condition for a sweep when looking at the chart upside down, so if successful, a surge can occur.
I just applied it to Bitcoin.
This is a 30-minute Bitcoin chart.
I marked the daily closing section for each flag,
and the purple flag on the far right is next Monday.
The purple finger on the lower left
is connected to the 81,404.4 dollar entry point yesterday, April 3.
Because it is touching the center line of the Bollinger Band 12-hour chart,
you need to hold on until 9 o'clock when additional candles are created to go up more.
*One-way long position strategy when the red finger moves
1. 83,568 dollar long position entry point / stop loss price when the green support line is broken
2. 86,871.5 dollar long position 1st target -> Top 2nd target
After that, target price in order.
If the strategy is successful, the 1st section that returns
You can use the long position re-entry section
The movement within the 1st section at the top and the 2nd section at the bottom is a sideways market.
If there is a crash in Nasdaq
It can drop below the bottom
And it can drop to 79.7K 3 times over the weekend, so please take note.
Up to this point, my analysis
Please just refer to and use it
I hope you operate safely with principle trading and stop loss prices.
You worked hard this week too.
Thank you.
Trade closed manually
Hello.It's a Bitcoin Guide.
I will check the movement after writing the analysis article on April 4th.
This is the Nasdaq 30-minute chart.
This was a brief analysis.
I marked the main sections with black fingers.
In the blue finger short->long or red finger long waiting strategy,
it fell vertically without waves.
Gap2 -> It finished with a push to the 2nd section.
After additional weekly and daily candles were created today,
17346 points of the gap section were created at the top,
and it is moving sideways at the bottom.
The long position entry point last week
was this month's major support line,
but it was the point where the Bollinger Band monthly chart's center line was touched,
so it is valid until April.
It is being pushed without any support or rebound
In fact, the effect of Powell and Trump's collaboration was great.
The stock markets around the world, including Nasdaq, are plummeting
I wonder what the results will be.
This is a 30-minute Bitcoin chart.
The main sections are marked with black fingers.
The purple finger is entering a long position at $81,404.4
The red finger is a long position strategy.
The long position entry section is $83,568 -> After touching the second section
It finished without breaking the green support line.
The strategy is manual liquidation.
It continued to move sideways over the weekend
Before the weekly candle was created, it touched the support line of the Bollinger Band weekly chart at $79,712.9
marked below.
Today, at 5:30 AM when the Nasdaq weekly candle is created,
Coupling with Nasdaq, a vertical decline occurred.
With this movement, Gap7 retracement -> A decline to $74,879.9 is in progress,
and the gap section of $84,092.2 created last weekend was created.
Last week, Nasdaq reached a major support line on the chart,
and I thought he would talk positively during Powell's speech,
but neither Trump nor Powell knew that the destruction of the United States would begin.
If the issues regarding tariffs and interest rates are not resolved for the time being,
Bitcoin's downward trend seems likely to continue for at least 2-3 months,
and since all stock markets around the world, including Bitcoin, are falling,
on the other hand,
it is a relief.
Until Bitcoin rises from $3,000 to $110,000,
I hope you all endure well and manage well,
as this is a market that we have always experienced together.
I left it open to the public for the first time, but
since there is little interest in analysis these days and the participation rate is almost non-existent,
I will continue to do it privately from now on.
I will quietly disappear for now.
Thank you.
Note
HelloIt's a Bitcoin Guide.
I will check the movement after writing the analysis article on April 7th.
This is the Nasdaq 30-minute chart.
I marked the main section with a black finger.
During the brief analysis, in the red finger long position strategy,
After entering the long at 16676.8 at the bottom,
I touched the Gap -> Top section at the top.
It came out perfectly.
With yesterday's movement, the second low point of this month is in progress,
I will follow it closely.
This is the Bitcoin 30-minute chart.
I marked the main section with a black finger.
In the red finger long position strategy,
After the long position chase purchase at $76,449.8,
the first target price at the top was touched at $79,062.6.
After that, it successfully re-entered the long position at $77,631.5,
and is moving sideways upward.
Strategically, it is perfect, but since it did not reach the top section target,
I will continue the strategy actively.
Thank you.
Note
HelloIt's a Bitcoin Guide.
I will check the movement after writing the analysis article on April 8th.
This is the Nasdaq 30-minute chart.
I marked the main sections with black fingers.
In the red finger long position strategy during the brief analysis,
After the short at the top purple finger 17.8K,
It continued to fall to 16.7K near the bottom section.
In the case of yesterday, it was the center line retouch section of the Bollinger Band 4-hour chart,
and the resistance line section of the 1-hour chart is a short position,
but it was not a place where it would crash after hitting it three times.
I explained that if Nasdaq does not crash,
Bit can move normally,
but it keeps crashing.
The short-term pattern is broken.
This is a 30-minute Bitcoin chart.
I marked the main sections with black fingers.
After entering a long position at the bottom left with a purple finger at $76,499.8,
It rose to about $4,360, and then connected yesterday's strategy.
The strategy was a short->long or long wait in the first section with a blue finger.
It failed to touch the short entry point at the top at 80,530.6 points,
and the first section additional candle broke away.
It cut its loss briefly as it broke away from the green support line.
It ended at the bottom,
and is rebounding to about $3,000 from the second section at $75,027.5, which I marked today.
If you look at the point where the decline came out yesterday,
it matches Nasdaq, and the short entry point was raised a little bit in case of a strong upward trend,
but it didn't even touch the entry point by a hair. Haha
As long as there is no crash in Nasdaq,
it keeps ignoring the chart and repeating while coupling.
It is currently rebounding just before the double bottom,
and the short-term pattern is broken, so today's analysis article will be a bit difficult.
I will try hard.
Thank you.
Note
HelloIt's a Bitcoin Guide.
I will check the movement after writing the analysis article on April 9th.
This is a 30-minute chart of Nasdaq.
I marked the main sections with black fingers.
These days, I am just checking if there is a plunge in Nasdaq,
so I am proceeding briefly.
The red finger long position strategy was.
It did not touch the 16711.5 point at the bottom,
and it rebounded sharply
It broke through the Top -> Good indicated at the top,
and reached 19212.8 points,
Yesterday, there was a sharp rebound without an indicator announcement,
but today is CPI. What kind of movement will it show?
This is a 30-minute chart of Bitcoin.
I marked the main sections with black fingers.
In the analysis article on the lower left,
After touching the 75,027.5 dollar mark in the 2nd section, I connected the strategy yesterday.
The blue finger is short->long or if it goes down right away, it was a long waiting strategy in 1.
Without touching the 78,428.5 dollar mark at the top,
It rebounded strongly while touching the 76,325 dollar mark in the long switching section.
It reached the Good section indicated at the top.
It is unfortunate that the wave has decreased due to the forced coupling with Nasdaq,
But since the judgment must be accurate,
The strategy has been canceled.
Instead, those who took a long entry position in the 2nd section or the long switching section
have risen by less than 10,000 dollars.
Today is CPI.
I will prepare hard from now on and try to achieve perfection again.
Thank you.
Note
HelloIt's a Bitcoin Guide.
I will check the movement after writing the analysis article on April 10th.
This is the Nasdaq 30-minute chart.
I marked the main sections with black fingers.
In the red finger long position strategy,
the purple finger 1 at the top
failed to touch the rising wave section
and a vertical drop occurred.
18635.9 at the bottom -> 2nd long position entry section
touched the 3rd section while forcibly leaving and finished.
After the additional daily candle was created today
It first touched the lower Bollinger band and is rebounding.
Now, it plummets even if only the indicators are released.
Patriot Powell, Trump Fighting!
This is a 30-minute Bitcoin chart.
I marked the main sections with black fingers.
At the bottom left is the April 10th long position entry section
After entering the long position at 76,325 dollars with a purple finger,
It rose to 7,248.2 dollars -> I connected the strategy yesterday.
In the red finger long position strategy,
After chasing 81,571.4 dollars -> Short in the 1st section -> Until the final long switching position at 2nd.
From the wave confirmation to the CPI indicator announcement,
It was a long->short->long switching strategy.
As it was forced to couple with Nasdaq,
It was pushed from 2nd to 3rd in the last long switching section.
Unfortunately, the strategy was cut because it broke the purple support line.
It is touching the 1+4 digits of the 3rd section and
rebounding strongly.
The reason why the rebound is stronger than Nasdaq is
Nasdaq was a vertical decline without a short entry position,
but in the case of Bitcoin, it touched the 30-minute chart resistance line (section 1) and
it was an adjustment, so the rebound is also strong.
It seems important to see what kind of movement will occur before the gap reversal.
Up to this point, in each long and short position,
You must cut your losses + trade with principles,
and
You worked hard this week too, and I hope you all have a nice weekend.
Thank you.
*비트코인가이드 공식텔레그램 Telegram
t.me/BTG_Group
*빙엑스 BingX 50%DC+$5,000 (총1회수수료)
bingx.com/invite/YBM3A4
*바이비트 Bybit 20%DC+$5,020
partner.bybit.com/b/Bitcoin_Guide
*제로마켓 ZeroMarket ECN계좌 40%DC (해외선물,FX)
bit.ly/3pY0dUv
t.me/BTG_Group
*빙엑스 BingX 50%DC+$5,000 (총1회수수료)
bingx.com/invite/YBM3A4
*바이비트 Bybit 20%DC+$5,020
partner.bybit.com/b/Bitcoin_Guide
*제로마켓 ZeroMarket ECN계좌 40%DC (해외선물,FX)
bit.ly/3pY0dUv
Related publications
Disclaimer
The information and publications are not meant to be, and do not constitute, financial, investment, trading, or other types of advice or recommendations supplied or endorsed by TradingView. Read more in the Terms of Use.