__________________________________________________________________________________
Technical Overview – Summary Points
__________________________________________________________________________________
__________________________________________________________________________________
Strategic Summary
__________________________________________________________________________________
__________________________________________________________________________________
Multi-Timeframe Analysis
__________________________________________________________________________________
__________________________________________________________________________________
Macro & On-Chain Analysis (Technical x Fundamental)
__________________________________________________________________________________
__________________________________________________________________________________
Actionable Synthesis
__________________________________________________________________________________
__________________________________________________________________________________
Technical Overview – Summary Points
__________________________________________________________________________________
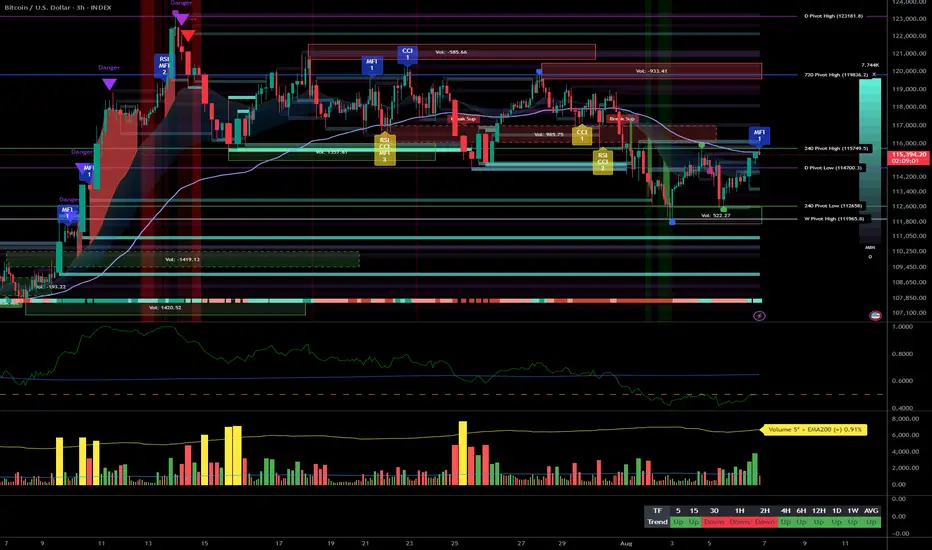
- Momentum: Structurally bullish bias on HTF (1D/12H/6H/4H) confirmed by Risk On / Risk Off Indicator showing consistent “Strong Buy” signal. Technical consolidation on LTF (2H→15min) with emerging selling pressure.
- Supports / Resistances: Major supports: 1D/weekly at 111-115k. Dense resistance between 116.9-119k. Structure remains valid if price holds >111k.
- Volume: Normal on HTF; episodes of extreme spikes on 30min-15min indicating possible liquidations/flush but no widespread capitulation.
- Multi-TF behavior: No panic in HTF; LTF selling pressure looks more like leveraged exhaustion than a lasting bearish reversal.
__________________________________________________________________________________
Strategic Summary
__________________________________________________________________________________
- Global bias: Bullish (HTF). Holding support at 111-113k is the key condition to favor accumulation.
- Opportunities: Tactical accumulation ≥111k, watch for breakout >117-119k, intraday scalps on LTF volume extremes.
- Risk zones: Breakdown <111k = risk of fast flush towards 107-110k; rejection below 116.9-119k = potential bull trap.
- Macro catalysts: Awaiting Fed decision (September), increased volatility around calendar events, global liquidity at highs, geopolitics on watch.
- Action plan: Accumulate on major supports, confirm bullish leg on break >117-119k with volume, swing stop-loss <110k.
__________________________________________________________________________________
Multi-Timeframe Analysis
__________________________________________________________________________________
- 1D: Uptrend structure active, weekly/daily support 114-115k, Risk On / Risk Off Indicator bullish. Healthy consolidation below old resistance ≥119k.
- 12H/6H/4H: Trend Up, strong range zone, sector momentum steady, no sell stress.
- 2H/1H: Intermediate consolidation/selling pressure. Downtrend confirmed on 1H/2H, but volume controlled.
- 30min/15min: Very high volumes, ISPD DIV sell signal (15min), probable distribution/exhaustion. 111-113k key support = front-line to monitor.
- Summary: Bullish structural alignment on HTF, consolidation/profit-taking on LTF but no major breakdown of key supports.
__________________________________________________________________________________
Macro & On-Chain Analysis (Technical x Fundamental)
__________________________________________________________________________________
- Macro: Expected Fed pivot (Sept), global liquidity at ATH, geopolitics remain uncertain but stable, weaker dollar.
- BTC on-chain: Accumulation in 110-115k area, ETF outflows, no STH stress, reclaim 116.9-119k resistance is crucial for bullish reversal.
- Calendar: Fed/FOMC 30/07 (pause expected), US earnings & oil data 06/08. Watch for surprise events.
- R/R: Favorable long ≥111k; break >119k = validation, short on failure at 116.9-119k if support lost, swing stop <110k.
__________________________________________________________________________________
Actionable Synthesis
__________________________________________________________________________________
- Swing bias: Favor tactical accumulation or active management as long as support ≥111k holds and Risk On / Risk Off Indicator remains “Strong Buy”. LTF = trading ground, HTF = maintain core positioning.
- Heightened vigilance at 116.9-119k: Potential trap/breakout activation zone. Watch liquidity on pullbacks and during volume “climax”.
- Stay agile, adjust stops tactically according to intraday volatility and price reaction at key support levels.
__________________________________________________________________________________
Disclaimer
The information and publications are not meant to be, and do not constitute, financial, investment, trading, or other types of advice or recommendations supplied or endorsed by TradingView. Read more in the Terms of Use.
Disclaimer
The information and publications are not meant to be, and do not constitute, financial, investment, trading, or other types of advice or recommendations supplied or endorsed by TradingView. Read more in the Terms of Use.