Current situation
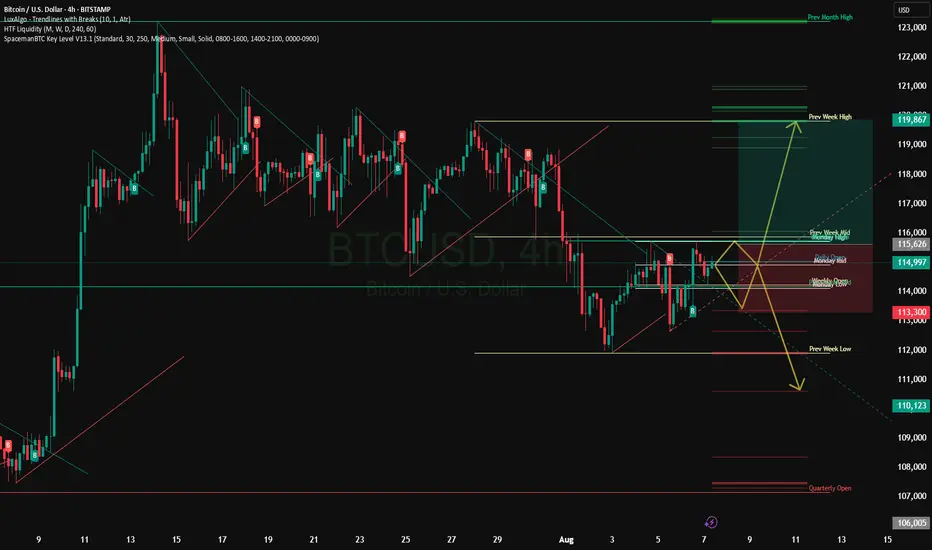
The price is trading around $114,959, having reached a daily high of ~$115,678 and a low of ~$113,851.
BTC is holding the 50-day moving average (SMA) and the downtrend is not dominant - this level is an important technical support.
A bull flag pattern has formed, which indicates a likely further upward momentum. Support is formed near $110,000, and a potential breakout target is $120,000.
Technical patterns and levels
The inverted head and shoulders pattern on the weekly chart indicates further growth. The neckline is at ~$115,000 - its breakout can open the way to targets in the range of $132K - $141K, and the theoretical measurement of the movement predicts up to $172,000, which is ~50% growth.
After an unsuccessful attempt to overcome the resistance at ~$115,600, the bearish trend remains in the short term.
However, the stability above $114,500 is supported by the growth of institutional interest and the inflow of capital into crypto products, which creates the preconditions for a possible breakout.
Main levels and signals
Support: ~$110,000 is a critical level, the violation of which will cross out the optimistic scenarios.
Resistance: ~$115,600–115,700 is the nearest barrier. A sustainable breakthrough through it with volume can open the way up.
Goals for growth: $120,000 → then $132,000–141,000 → potentially up to $172,000.
Risks: A failure below $110K can trigger a deep correction. .
Related publications
Disclaimer
The information and publications are not meant to be, and do not constitute, financial, investment, trading, or other types of advice or recommendations supplied or endorsed by TradingView. Read more in the Terms of Use.
Related publications
Disclaimer
The information and publications are not meant to be, and do not constitute, financial, investment, trading, or other types of advice or recommendations supplied or endorsed by TradingView. Read more in the Terms of Use.