Hello, traders.
If you "Follow", you can always get new information quickly.
Please click "Boost" as well.
Have a nice day today.
-------------------------------------
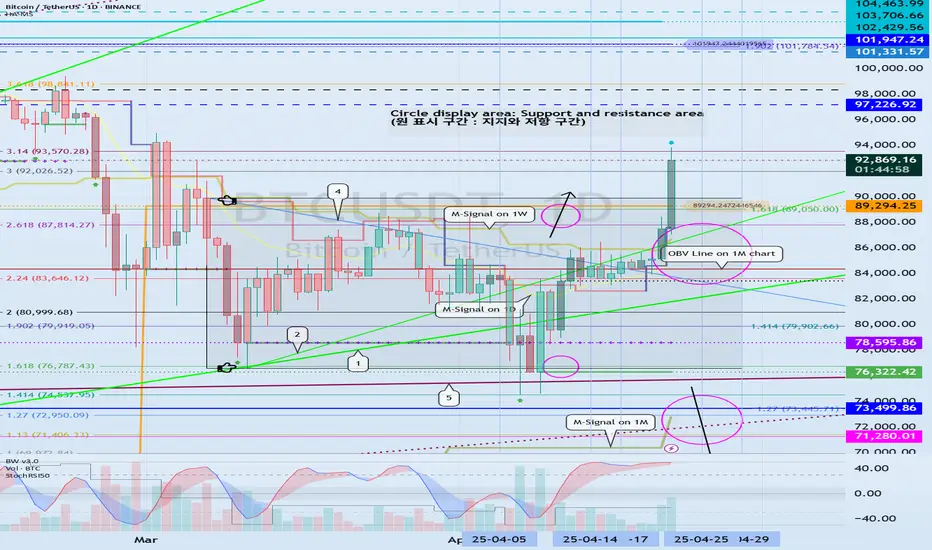
(BTCUSDT 1D chart)
I wonder if you think that BTC has turned into an uptrend as I mentioned before, as it has risen above 89294.25.
The previous idea is titled "Breakthrough trading starts with finding support and resistance points."
It is ideal to buy at the lowest price possible and sell at the highest price possible, but in order to do that, you need to constantly check the chart in real time.
Therefore, I think it is better to focus on finding the most ideal trading time.
Therefore, you should try to trade according to your own trading rules, that is, your trading strategy.
-
In that sense, my trading criteria are the HA-Low and HA-High indicators.
As you can see from the published formula, when the Heikin-Ashi chart shows an upward trend, the HA-Low indicator is created, and when it shows a downward trend, the HA-High indicator is created.
Therefore, if possible, you can think of a trading strategy to buy when it shows support near the HA-Low indicator, and sell when it shows resistance near the HA-High indicator.
If it falls below the HA-Low indicator, a stepwise downtrend may begin, and if it rises above the HA-HIgh indicator, a stepwise uptrend may begin.
Therefore, it is necessary to look at how long the HA-Low and HA-High indicators make a horizontal line.
Looking at the current chart, we can see that the HA-Low indicator was created at the 89294.25 point and the price fell, but the HA-Low indicator remained the same.
Therefore, even if it fell below the HA-Low indicator, it did not lead to a stepwise downtrend.
In order for a stepwise downtrend to lead, the HA-Low indicator must show a new shape as it falls.
-
The HA-High indicator on the 1D chart is formed at the 101947.24 point.
Therefore, the section that determines the trend again is expected to be around 101947.24.
However, since the HA-High indicator on the 1W chart is formed at the 97224.92 point, we must first check whether it can rise above this area.
-
OBV has broken through the upper line.
However, since there is a difference from the previous high, the point to watch is whether it can rise above the previous high.
Section A is the section where the lower point of the HA-High indicator box and the upper point of the HA-Low indicator box overlap.
Therefore, the key is whether it can receive support and rise in this section.
This is because it can be considered a volume profile section because it is a section where the influence of the HA-Low indicator and the HA-High indicator are simultaneously applied.
-
This volatility period is expected to be around April 25-29 (up to April 24-30).
If the StochRSI indicator falls from the overbought zone after this volatility period, then the support around 89294.25 is expected to be an important issue.
The movement of the StochRSI indicator and the price movement do not necessarily appear in the same direction.
Therefore, we recommend that you focus on finding a selling time when the StochRSI indicator is above the 50 point and on finding a buying time when it is below the 50 point.
-
The biggest disadvantage of the breakout trading mentioned earlier is that when it shows a downward trend, it is a split selling period.
In other words, when it rises from the point where the breakout trading was made and then shows a downward trend, it is the first selling period.
If you ignore this, you may suffer a loss or increase psychological anxiety, so you need to be careful.
Since the current HA-Low indicator is the standard for breakout trading, you will feel less psychological anxiety.
The reason is that the HA-Low indicator is created, which means that it has broken out of the low range.
When the price rises and breaks through the HA-High indicator, it feels different from when it breaks through the HA-Low indicator.
When the HA-High indicator breaks upward, it makes you think that it will rise more.
No matter how much you try to calm your mind and look at the chart with a third-party's eyes, it is not easy to stop thinking like that.
The HA-High indicator is created, which means that it has fallen from the high range.
Therefore, since rising above the HA-High indicator means that it has risen to the high range, it is not strange if it falls at any time.
However, as I mentioned earlier, the idea that it will rise more will be dominant, so there is a high possibility that FOMO will take effect.
In order to escape this psychological state, support and resistance points drawn on the 1M, 1W, and 1D charts are absolutely necessary.
It is necessary to make an effort to stabilize your psychological state by conducting a split transaction depending on whether there is support near the drawn support and resistance points.
-
Thank you for reading to the end.
I hope you have a successful transaction.
--------------------------------------------------
- This is an explanation of the big picture.
I used TradingView's INDEX chart to check the entire BTC section.
I rewrote it to update the previous chart while touching the Fibonacci ratio section of 1.902 (101875.70) ~ 2 (106275.10).
(Previous BTCUSD 12M chart)
Looking at the big picture, it seems to have maintained an upward trend following a pattern since 2015.
In other words, it is a pattern that maintains a 3-year upward trend and faces a 1-year downward trend.
Accordingly, the upward trend is expected to continue until 2025.
-
(Current BTCUSD 12M chart)
Based on the currently written Fibonacci ratio, it is displayed up to 3.618 (178910.15).
It is expected that it will not fall again below the Fibonacci ratio of 0.618 (44234.54).
(BTCUSDT 12M chart)
Based on the BTCUSDT chart, I think it is around 42283.58.
-
I will explain it again with the BTCUSD chart.
The Fibonacci ratio ranges marked in the green boxes, 1.902 (101875.70) ~ 2 (106275.10) and 3 (151166.97) ~ 3.14 (157451.83), are expected to be important support and resistance ranges.
In other words, it seems likely that they will act as volume profile ranges.
Therefore, in order to break through these ranges upward, I think the point to watch is whether they can receive support and rise near the Fibonacci ratios of 1.618 (89126.41) and 2.618 (134018.28).
Therefore, the maximum rising range in 2025 is expected to be the 3 (151166.97) ~ 3.14 (157451.83) range.
In order to do that, we need to see if it is supported and rises near 2.618 (134018.28).
If it falls after the bull market in 2025, we don't know how far it will fall, but based on the previous decline, we expect it to fall by about -60% to -70%.
Therefore, if it starts to fall near the Fibonacci ratio 3.14 (157451.83), it seems likely that it will fall to around Fibonacci 0.618 (44234.54).
I will explain more details when the bear market starts.
------------------------------------------------------
Trade active
#BTCUSDTSince the StochRSI indicator is in the overbought zone, there is a possibility that the rise will be limited.
After this volatility period (up to April 30), we need to see whether it will rise to around 97226.92 or fall to around 89294.25.
The important thing to look at is whether the price can be maintained above the trend line (2) or above the trend line (1).
-
As USDT and USDC show a gap uptrend, we can see that funds are flowing into the coin market.
If BTC dominance rises and USDT dominance falls, a strange market may be created where only BTC rises.
Therefore, altcoins are likely to gradually move sideways or show a downward trend, so caution is required when trading.
Note
#BTCUSDTThe StochRSI indicator currently added to the auxiliary indicators is displayed as -50 to 50 in order to be used with various indicators.
I have never seen the StochRSI EMA indicator touch the 50 point (original value 100).
Since the current value of the StochRSI EMA indicator is located at 48.39 point (original value 98.39), it can be seen that the upward movement is likely to be restricted.
Therefore, when the StochRSI indicator falls below the overbought zone, it can be said that the point of observation is where the support and resistance points will be confirmed.
The most likely point is the HA-Low indicator point on the 1D chart, around 89294.25.
I think its importance is increasing because the M-Signal indicator on the 1D chart is rising near that point.
-
However, if the StochRSI indicator is located as close to the 50 point (original value 100) as possible for a long period of time, the StochRSI indicator is likely to show a large decline when the price shows a slight decline.
Therefore, it is possible that it will rise with support near the Fibonacci ratio range 3 (92026.52) ~ 3.14 (93570.28).
At this time, what we need to check is whether the StochRSI indicator falls to or below the 0 point (original value 50).
If so, it is likely to exert strength to rise again.
As of now
1st: 97226.92
2nd: 101947.24
The 1st and 2nd areas above are likely to act as resistance, so you should consider a response plan depending on whether there is support.
-
This volatility period is expected to continue until April 30th.
Note
#BTCUSDT 1WThe key is whether it can rise above the HA-High indicator point of 97226.92 on the 1W chart and receive support.
If not,
1st: Left Fibonacci ratio 3 (92026.52) ~ 3.14 (93570.28)
2nd: Left Fibonacci ratio 2.618 (87814.27) ~ Right Fibonacci ratio 1.618 (89050.0)
You should check for support near the 1st and 2nd above.
When the StochRSI indicator
- falls from the overbought zone,
- passes the middle point,
- rises from the oversold zone,
Volatility is likely to occur in the above cases.
Therefore, it is expected that the support around the left Fibonacci ratio 3 (92026.52) ~ 3.14 (93570.28) will be the point of observation.
-
I don't think it is necessary to know, but it seems that there has been a change in the trend line.
- The trend line between lows (1-1) -> (1) has fallen
- The trend line between highs (2-1) -> (2) has risen
Therefore, it seems that the rising channel has been completed with the trend line (1) ~ (2).
Since the low point has fallen and the high point has risen, it can be seen that it is important to see whether the price can be maintained by rising above 97226.92 this time.
This is because it can create a second rising wave along the rising channel.
Note
If USDT dominance falls below 4.97 and is maintained or continues to decline, the coin market is likely to rise.
However, I think that in order for the altcoin bull market to begin, BTC dominance must fall below 55.01 and be maintained or continue to decline.
Accordingly, if USDT dominance falls and BTC dominance rises, there is a possibility that a market where only BTC rises will be formed.
In other words, altcoins are likely to gradually move sideways or show a downward trend.
Therefore, when BTC dominance does not fall but altcoins rise, it is likely to be a short-term selling period.
That is why I do not think it is a buying opportunity.
I think what we need to do is find an opportunity to buy BTC or wait for altcoins to fall.
Scalping or day trading is always possible, but you need to check the volume.
Note
#BTCUSDT 1DAs a new week begins, the HA-High indicator on the 1D chart is showing signs of being newly created.
Accordingly, if the HA-High indicator is created at the 93178.43 point, it is important to see if there is support around that point.
Since the HA-High indicator was created, it means that it has fallen from the high point, so there is a possibility that it will continue to fall further.
Therefore, it is necessary to check whether it can be supported around the Fibonacci ratio range of 3 (92026.52) ~ 3.14 (93570.28).
Other content (coins, stocks, etc.) is frequently posted on X.
X에 다른 내용(코인, 주식 등)이 자주 게시됩니다.
◆ t.me/readCryptoChannel
[HA-MS Indicator]
bit.ly/3YxHgvN
[DMI-OBV Trend]
bit.ly/4ibHtMc
X에 다른 내용(코인, 주식 등)이 자주 게시됩니다.
◆ t.me/readCryptoChannel
[HA-MS Indicator]
bit.ly/3YxHgvN
[DMI-OBV Trend]
bit.ly/4ibHtMc
Related publications
Disclaimer
The information and publications are not meant to be, and do not constitute, financial, investment, trading, or other types of advice or recommendations supplied or endorsed by TradingView. Read more in the Terms of Use.