The Relative Strength Index (RSI), Stochastic oscillator (STOCH), and Money Flow Index (MFI) are all momentum indicators used to analyze an asset's price movements. On the weekly chart, these indicators have signaled a potential reversal, suggesting that the upward momentum of the asset may be weakening.
On the 4-hour chart, multiple indicators, including the Moving Average Convergence Divergence (MACD), its histogram (HIST), RSI, and MFI have given sell signals, indicating that the asset may be overbought and due for a pullback or reversal. Additionally, the last candle has closed below the resistance 1 pivot point, which is a bearish sign.
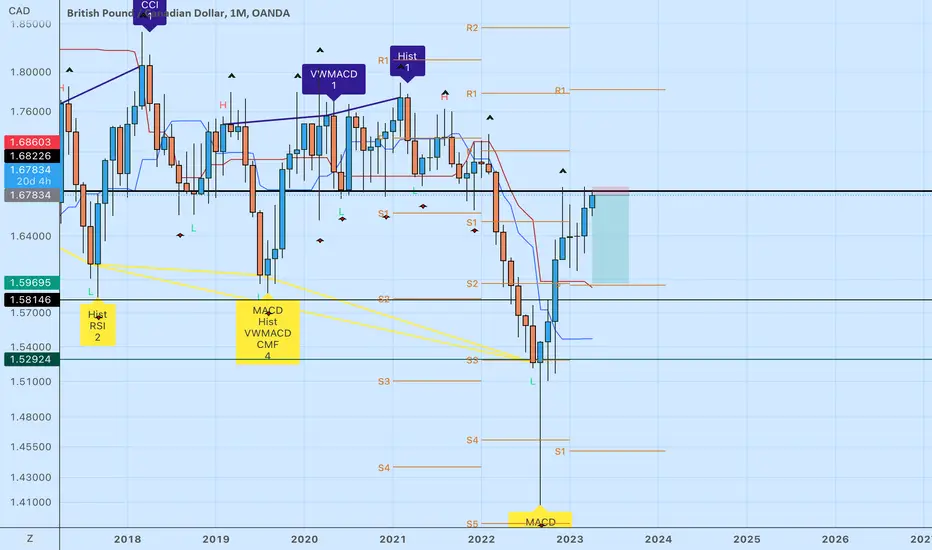
The monthly chart shows that the asset has reached a significant resistance level that was previously a support level, which could potentially limit further upward movement. It's worth noting that the long-term trend of the asset has been downward over the past few years, which adds to the bearish outlook.
Overall, this presents a low-risk, high-reward trade opportunity with a stop loss located close to the trade entry point.
On the 4-hour chart, multiple indicators, including the Moving Average Convergence Divergence (MACD), its histogram (HIST), RSI, and MFI have given sell signals, indicating that the asset may be overbought and due for a pullback or reversal. Additionally, the last candle has closed below the resistance 1 pivot point, which is a bearish sign.
The monthly chart shows that the asset has reached a significant resistance level that was previously a support level, which could potentially limit further upward movement. It's worth noting that the long-term trend of the asset has been downward over the past few years, which adds to the bearish outlook.
Overall, this presents a low-risk, high-reward trade opportunity with a stop loss located close to the trade entry point.
If you found my trades helpful, please consider sending a tip in BTC to: bc1qr35mrh82hykpy9v6znpsyuew85x84ezjyrrf6m
Disclaimer
The information and publications are not meant to be, and do not constitute, financial, investment, trading, or other types of advice or recommendations supplied or endorsed by TradingView. Read more in the Terms of Use.