As gold takes a breather just below its recent highs, it’s a good moment to zoom out and ask a few bigger questions. Is this a healthy consolidation before the next leg higher, or are we seeing early signs of buyer exhaustion? Let’s take a look at the key levels in play, what’s driving the broader move, and how the technical picture is shaping up.
Gold Shines Amid Macro Noise
Most markets this year have been on a Trumpian rollercoaster—rallying on the promise of deregulation and then stumbling as tariff threats rattle risk appetite. But gold has been a different story entirely. It’s been climbing steadily, driven by a cocktail of macro catalysts that continue to align in its favour.
Geopolitical tension is a big one. From renewed trade war threats to simmering conflict in the Middle East, the backdrop is risk-heavy—and gold thrives in that environment. Add in lingering inflation worries and speculation around central bank easing, and you’ve got the ideal conditions for gold to rally.
Crucially, gold isn’t just reacting to the headlines—it’s responding to positioning and flows. Demand from both institutional investors and central banks has remained strong. ETFs have seen persistent inflows, while major buyers continue to stockpile gold as a hedge against currency risk and market volatility. In short, the bull case for gold remains underpinned by more than just fear—it’s backed by allocation shifts and structural demand.
Trend Watch: Strength, But Signs of Stretch
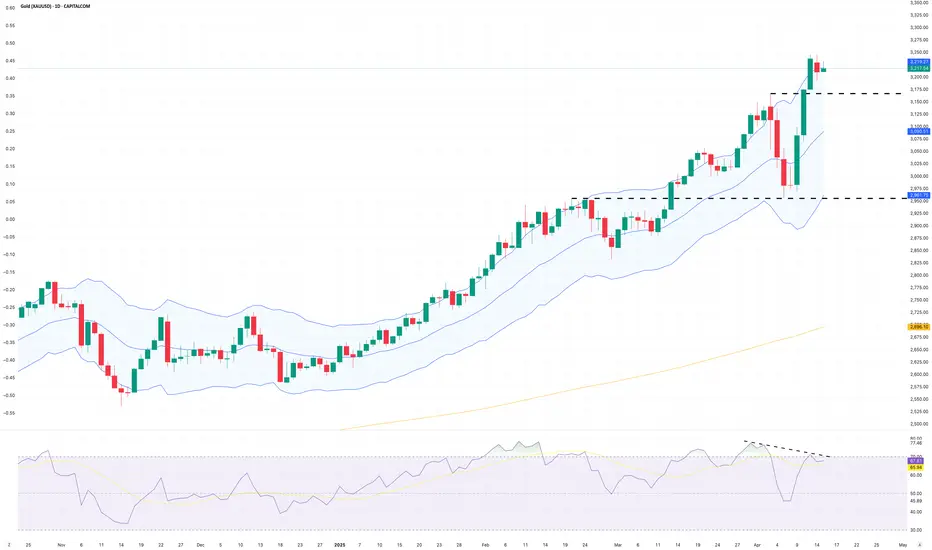
Gold’s daily candle chart shows a market trading well above its rising 200-day moving average—always a strong signal that the broader trend remains intact. This uptrend has been in place for months, and the market has done the hard yards to build a healthy base before each new leg higher.
That said, with gold pausing just beneath recent highs, it’s fair to ask whether we’re setting up for continuation—or due for a deeper pullback. There are arguments on both sides.
The case for trend continuation starts with structure. The market continues to respect former resistance levels, which are now acting as support—always a good sign of an orderly rally. The trend angle itself also looks sustainable; this hasn’t been a parabolic move, which makes it less vulnerable to a violent correction.
Perhaps most telling is the recent ‘high and tight’ consolidation. Rather than giving back gains, gold is simply moving sideways near the highs—a sign that dip buyers are stepping in quickly, and that there’s no real appetite for lower prices just yet.
On the flip side, there are a couple of caution flags worth keeping an eye on.
The first is the Keltner Channel. For context, the Keltner Channel is a volatility-based envelope that plots a band around a moving average, using the Average True Range to define the width. When price pushes into the upper band, it can signal an overextended move. While a 'slide' along the upper edge is possible in strong trends, a full-blown breakout above the channel often precedes a pullback—so it’s something to watch.
Second is RSI divergence. Gold made a new trend high last week, but the RSI didn’t follow suit—instead forming a lower high. This divergence between price and momentum can be an early sign of fatigue. It doesn’t guarantee a reversal, but it does suggest the move may need a bit of a breather.
Gold (XAU/USD) Daily Candle Chart

Past performance is not a reliable indicator of future results
Summary:
Gold’s pause near highs looks healthy for now, especially in the context of the broader trend and supportive fundamentals. But it’s worth staying alert. A push above recent highs, backed by volume and strong momentum, would reinforce the bull case. However, if RSI divergence plays out and the price breaks short-term support levels, we could see a sharper pullback first.
Disclaimer: This is for information and learning purposes only. The information provided does not constitute investment advice nor take into account the individual financial circumstances or objectives of any investor. Any information that may be provided relating to past performance is not a reliable indicator of future results or performance. Social media channels are not relevant for UK residents.
Spread bets and CFDs are complex instruments and come with a high risk of losing money rapidly due to leverage. 83% of retail investor accounts lose money when trading spread bets and CFDs with this provider. You should consider whether you understand how spread bets and CFDs work and whether you can afford to take the high risk of losing your money.
Gold Shines Amid Macro Noise
Most markets this year have been on a Trumpian rollercoaster—rallying on the promise of deregulation and then stumbling as tariff threats rattle risk appetite. But gold has been a different story entirely. It’s been climbing steadily, driven by a cocktail of macro catalysts that continue to align in its favour.
Geopolitical tension is a big one. From renewed trade war threats to simmering conflict in the Middle East, the backdrop is risk-heavy—and gold thrives in that environment. Add in lingering inflation worries and speculation around central bank easing, and you’ve got the ideal conditions for gold to rally.
Crucially, gold isn’t just reacting to the headlines—it’s responding to positioning and flows. Demand from both institutional investors and central banks has remained strong. ETFs have seen persistent inflows, while major buyers continue to stockpile gold as a hedge against currency risk and market volatility. In short, the bull case for gold remains underpinned by more than just fear—it’s backed by allocation shifts and structural demand.
Trend Watch: Strength, But Signs of Stretch
Gold’s daily candle chart shows a market trading well above its rising 200-day moving average—always a strong signal that the broader trend remains intact. This uptrend has been in place for months, and the market has done the hard yards to build a healthy base before each new leg higher.
That said, with gold pausing just beneath recent highs, it’s fair to ask whether we’re setting up for continuation—or due for a deeper pullback. There are arguments on both sides.
The case for trend continuation starts with structure. The market continues to respect former resistance levels, which are now acting as support—always a good sign of an orderly rally. The trend angle itself also looks sustainable; this hasn’t been a parabolic move, which makes it less vulnerable to a violent correction.
Perhaps most telling is the recent ‘high and tight’ consolidation. Rather than giving back gains, gold is simply moving sideways near the highs—a sign that dip buyers are stepping in quickly, and that there’s no real appetite for lower prices just yet.
On the flip side, there are a couple of caution flags worth keeping an eye on.
The first is the Keltner Channel. For context, the Keltner Channel is a volatility-based envelope that plots a band around a moving average, using the Average True Range to define the width. When price pushes into the upper band, it can signal an overextended move. While a 'slide' along the upper edge is possible in strong trends, a full-blown breakout above the channel often precedes a pullback—so it’s something to watch.
Second is RSI divergence. Gold made a new trend high last week, but the RSI didn’t follow suit—instead forming a lower high. This divergence between price and momentum can be an early sign of fatigue. It doesn’t guarantee a reversal, but it does suggest the move may need a bit of a breather.
Gold (XAU/USD) Daily Candle Chart
Past performance is not a reliable indicator of future results
Summary:
Gold’s pause near highs looks healthy for now, especially in the context of the broader trend and supportive fundamentals. But it’s worth staying alert. A push above recent highs, backed by volume and strong momentum, would reinforce the bull case. However, if RSI divergence plays out and the price breaks short-term support levels, we could see a sharper pullback first.
Disclaimer: This is for information and learning purposes only. The information provided does not constitute investment advice nor take into account the individual financial circumstances or objectives of any investor. Any information that may be provided relating to past performance is not a reliable indicator of future results or performance. Social media channels are not relevant for UK residents.
Spread bets and CFDs are complex instruments and come with a high risk of losing money rapidly due to leverage. 83% of retail investor accounts lose money when trading spread bets and CFDs with this provider. You should consider whether you understand how spread bets and CFDs work and whether you can afford to take the high risk of losing your money.
Disclaimer
The information and publications are not meant to be, and do not constitute, financial, investment, trading, or other types of advice or recommendations supplied or endorsed by TradingView. Read more in the Terms of Use.
Disclaimer
The information and publications are not meant to be, and do not constitute, financial, investment, trading, or other types of advice or recommendations supplied or endorsed by TradingView. Read more in the Terms of Use.