Open Price: 23242.3 (UTC+4)
1. Japanese Candlestick Analysis
4H/1H: Price opened at 23242.3 near resistance (23250–23300). Recent candles show bearish harami (4H) and dark cloud cover (1H), signaling rejection.
30M/15M: Gravestone doji at 23242.3 and three black crows indicate strong bearish momentum.
5M: Shooting star formation suggests exhaustion. Failure to close above 23250 confirms weakness.
Outlook: Bearish reversal likely if 23200 breaks.
2. Harmonic Patterns
4H/1H: Bearish Butterfly Pattern completing at 23242.3 (D-point).
PRZ: 23240–23250 (confluence of 127.2% XA and 161.8% BC).
Fibonacci Ratios: AB=CD symmetry (23240–23250).
30M: Bullish Crab forming at 23100, but secondary to larger bearish setup.
Outlook: High-probability short entry at 23240–23250 with target 23000.
3. Elliott Wave Theory
4H: Wave 5 of impulse cycle peaked at 23242.3.
Structure: Completed 5-wave sequence from 22800 → 23242.3.
Corrective Phase: ABC pullback targeting 23000 (Wave A) and 22850 (Wave C).
1H: Sub-wave (v) of 5 ending at 23242.3. RSI divergence confirms exhaustion.
Outlook: Bearish correction to 22850–23000 within 24 hours.
4. Wyckoff Theory
Phase: Distribution (after markup from 22800 → 23242.3).
Signs: High volume at 23242.3 (supply), upthrust above 23300 failed.
Schematic: Phase C (markdown) initiating.
1H/30M: Spring at 23200 failed to hold, indicating weak demand.
Outlook: Break below 23200 triggers markdown to 23000.
5. W.D. Gann Theory
Time Theory
24H Cycle: Key reversal windows:
UTC+4: 08:00–10:00 (resistance test), 14:00–16:00 (trend reversal).
Square of 9: 23242.3 aligns with 0° angle (resistance).
Square of 9
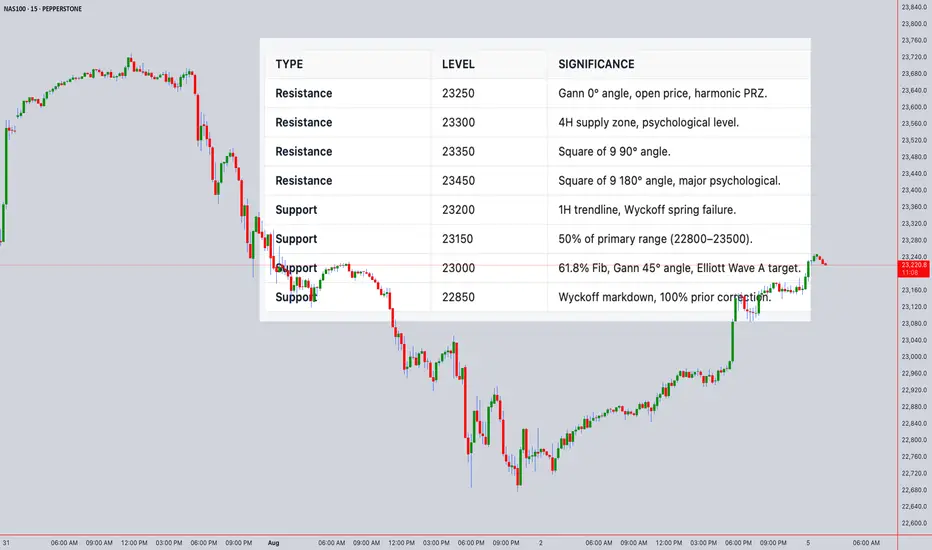
23242.3 → Resistance Angles:
0° (23250), 90° (23350), 180° (23450).
Support: 45° (23000), 315° (22850).
Price Forecast: Reversal at 23250 (0° angle).
Angle Theory
4H Chart: 1x1 Gann Angle (45°) from 22800 low at 23000. Price above angle = bullish, but overextended.
1H Chart: 2x1 Angle (63.75°) at 23242.3 acting as resistance.
Squaring of Price & Time
Price Range: 22800 → 23242.3 (442.3 points).
Time Squaring: 442.3 hours from 22800 low → 23250 resistance (442.3 points ≈ 442.3 hours).
Harmony: 23242.3 = Time Cycle Peak (24H from open).
Ranges in Harmony
Primary Range: 22800–23500 (700 points).
50% Retracement: 23150 (support).
61.8% Retracement: 23000 (critical support).
Secondary Range: 23000–23300 (300 points).
Key Levels: 23150 (50%), 23000 (61.8%).
Price & Time Forecasting
Price Targets:
Short-Term: 23000 (61.8% Fib, Gann 45° angle).
Extension: 22850 (100% of prior correction).
Time Targets:
First Reversal: 8–12 hours from open (UTC+4 12:00–16:00).
Second Reversal: 20–24 hours (UTC+4 00:00–04:00 next day).
Synthesized 24H Forecast
Bearish Scenario (High Probability)
Trigger: Break below 23200 (confirmed by 1H/30M close).
Targets:
T1: 23000 (61.8% Fib, Gann 45° angle).
T2: 22850 (Wyckoff markdown, Elliott Wave C).
Timeline:
8–12H: Drop to 23000 (UTC+4 12:00–16:00).
20–24H: Test 22850 (UTC+4 00:00–04:00 next day).
Confirmation: RSI <50 on 1H, volume spike >25% average.
Bullish Scenario (Low Probability)
Trigger: Sustained close above 23300 (Gann 0° angle).
Targets: 23350 (90° angle), 23450 (180° angle).
Timeline: 12–16 hours (if 23300 breaks).
1. Japanese Candlestick Analysis
4H/1H: Price opened at 23242.3 near resistance (23250–23300). Recent candles show bearish harami (4H) and dark cloud cover (1H), signaling rejection.
30M/15M: Gravestone doji at 23242.3 and three black crows indicate strong bearish momentum.
5M: Shooting star formation suggests exhaustion. Failure to close above 23250 confirms weakness.
Outlook: Bearish reversal likely if 23200 breaks.
2. Harmonic Patterns
4H/1H: Bearish Butterfly Pattern completing at 23242.3 (D-point).
PRZ: 23240–23250 (confluence of 127.2% XA and 161.8% BC).
Fibonacci Ratios: AB=CD symmetry (23240–23250).
30M: Bullish Crab forming at 23100, but secondary to larger bearish setup.
Outlook: High-probability short entry at 23240–23250 with target 23000.
3. Elliott Wave Theory
4H: Wave 5 of impulse cycle peaked at 23242.3.
Structure: Completed 5-wave sequence from 22800 → 23242.3.
Corrective Phase: ABC pullback targeting 23000 (Wave A) and 22850 (Wave C).
1H: Sub-wave (v) of 5 ending at 23242.3. RSI divergence confirms exhaustion.
Outlook: Bearish correction to 22850–23000 within 24 hours.
4. Wyckoff Theory
Phase: Distribution (after markup from 22800 → 23242.3).
Signs: High volume at 23242.3 (supply), upthrust above 23300 failed.
Schematic: Phase C (markdown) initiating.
1H/30M: Spring at 23200 failed to hold, indicating weak demand.
Outlook: Break below 23200 triggers markdown to 23000.
5. W.D. Gann Theory
Time Theory
24H Cycle: Key reversal windows:
UTC+4: 08:00–10:00 (resistance test), 14:00–16:00 (trend reversal).
Square of 9: 23242.3 aligns with 0° angle (resistance).
Square of 9
23242.3 → Resistance Angles:
0° (23250), 90° (23350), 180° (23450).
Support: 45° (23000), 315° (22850).
Price Forecast: Reversal at 23250 (0° angle).
Angle Theory
4H Chart: 1x1 Gann Angle (45°) from 22800 low at 23000. Price above angle = bullish, but overextended.
1H Chart: 2x1 Angle (63.75°) at 23242.3 acting as resistance.
Squaring of Price & Time
Price Range: 22800 → 23242.3 (442.3 points).
Time Squaring: 442.3 hours from 22800 low → 23250 resistance (442.3 points ≈ 442.3 hours).
Harmony: 23242.3 = Time Cycle Peak (24H from open).
Ranges in Harmony
Primary Range: 22800–23500 (700 points).
50% Retracement: 23150 (support).
61.8% Retracement: 23000 (critical support).
Secondary Range: 23000–23300 (300 points).
Key Levels: 23150 (50%), 23000 (61.8%).
Price & Time Forecasting
Price Targets:
Short-Term: 23000 (61.8% Fib, Gann 45° angle).
Extension: 22850 (100% of prior correction).
Time Targets:
First Reversal: 8–12 hours from open (UTC+4 12:00–16:00).
Second Reversal: 20–24 hours (UTC+4 00:00–04:00 next day).
Synthesized 24H Forecast
Bearish Scenario (High Probability)
Trigger: Break below 23200 (confirmed by 1H/30M close).
Targets:
T1: 23000 (61.8% Fib, Gann 45° angle).
T2: 22850 (Wyckoff markdown, Elliott Wave C).
Timeline:
8–12H: Drop to 23000 (UTC+4 12:00–16:00).
20–24H: Test 22850 (UTC+4 00:00–04:00 next day).
Confirmation: RSI <50 on 1H, volume spike >25% average.
Bullish Scenario (Low Probability)
Trigger: Sustained close above 23300 (Gann 0° angle).
Targets: 23350 (90° angle), 23450 (180° angle).
Timeline: 12–16 hours (if 23300 breaks).
Disclaimer
The information and publications are not meant to be, and do not constitute, financial, investment, trading, or other types of advice or recommendations supplied or endorsed by TradingView. Read more in the Terms of Use.
Disclaimer
The information and publications are not meant to be, and do not constitute, financial, investment, trading, or other types of advice or recommendations supplied or endorsed by TradingView. Read more in the Terms of Use.