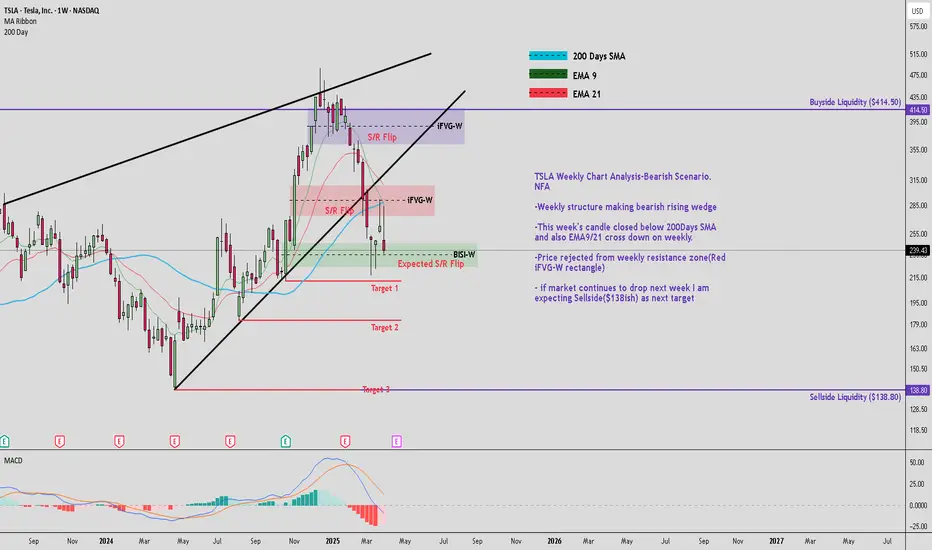
TSLA Weekly Chart Analysis-Bearish Scenario. NFA
-Weekly structure making bearish rising wedge
-This week's candle closed below 200Days SMA and also EMA9/21 cross down on weekly.
-Price rejected from weekly resistance zone(Red iFVG-W rectangle)
- if market continues to drop next week I am expecting Sellside($138ish) as next target
-Weekly structure making bearish rising wedge
-This week's candle closed below 200Days SMA and also EMA9/21 cross down on weekly.
-Price rejected from weekly resistance zone(Red iFVG-W rectangle)
- if market continues to drop next week I am expecting Sellside($138ish) as next target
Related publications
Disclaimer
The information and publications are not meant to be, and do not constitute, financial, investment, trading, or other types of advice or recommendations supplied or endorsed by TradingView. Read more in the Terms of Use.
Related publications
Disclaimer
The information and publications are not meant to be, and do not constitute, financial, investment, trading, or other types of advice or recommendations supplied or endorsed by TradingView. Read more in the Terms of Use.