Analysis Overview:
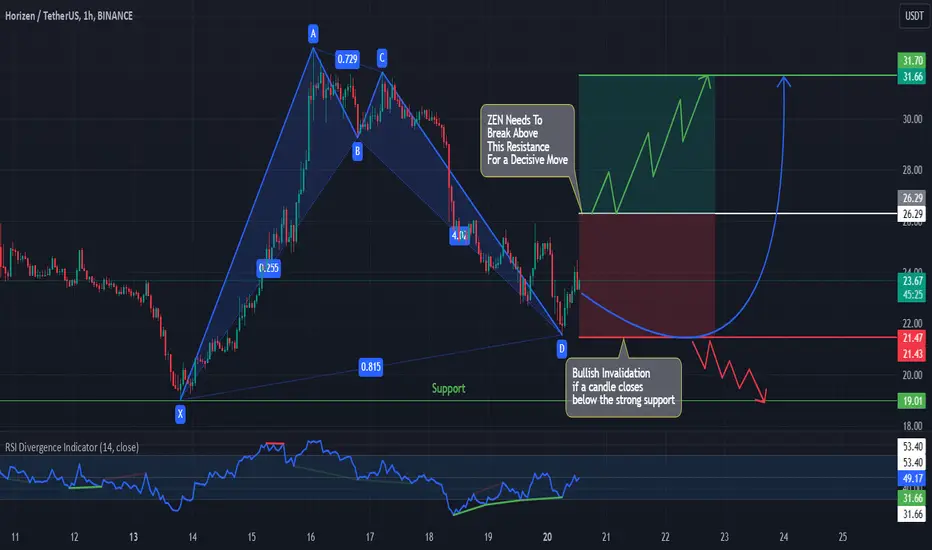
ZEN is currently in a downtrend but is forming a potential Harmonic Pattern on the 1-hour timeframe. This is accompanied by Bullish Divergence, which suggests a possible trend reversal to the upside.
For a confirmed bullish trend, we need a decisive breakout above the previous Lower Highs (LHs). Once this occurs, the price structure may shift, forming Higher Highs (HHs) and Higher Lows (HLs), reinforcing a bullish outlook.
Trading Plan:
Entry Trigger: Wait for a breakout above the previous LHs as confirmation.
Risk Management: Use a well-defined stop-loss level below the recent swing low to minimize risks.
Target: Gradually scale into the position as HHs and HLs form, aiming for key resistance levels.
Note: Always adhere to your trading plan and risk management rules. Wait for confirmation before entering a trade.
Note
Trade is Still valid, move ur buy order to 23.50 and SL to 18.85Disclaimer
The information and publications are not meant to be, and do not constitute, financial, investment, trading, or other types of advice or recommendations supplied or endorsed by TradingView. Read more in the Terms of Use.
Disclaimer
The information and publications are not meant to be, and do not constitute, financial, investment, trading, or other types of advice or recommendations supplied or endorsed by TradingView. Read more in the Terms of Use.