Peanut the Squirrel (PNUT/USDT) - Bullish Setup 1HPNUT is showing strong bullish signals on the 1H chart. Several technical factors suggest a potential upward move:
2025

iExec RLC (RLC/USDT) - Key Levels To Watch 1HRLC is showing strong bullish momentum, currently trading around $1.34, with a potential breakout on the horizon.
A breakout above resistance with strong volume could lead to an explosive move!
Keep an eye on price action and confirmation signals.

Bitcoin Dominance Likely to Drop – Key Levels to WatchBitcoin dominance is showing signs of weakness and may be heading for a drop. The dominance chart suggests a potential reversal as key resistance levels are being tested and rejected.
Should monitor price action closely. If BTC.D falls further, altcoins might experience a strong relief rally. Stay prepared!

Fetch.AI (Fetch.AI/USDT) Bullish Setup Analysis 4HFetch.AI is showing strong bullish momentum with a breakout above key resistance levels.

(BTC) bitcoinan indicator to show the price of BTC is beginning a new phase based on whatever I did with this indicator. .dev

(ETH) ethereum "buying"When the price is hidden behind the purple curtain this is a sign of a buying moment, for consistent cryptocurrency, not so accurate with minor crypto tokens. As you can see the price of ethereum is behind the curtain of the 200 day moving average. Buying?

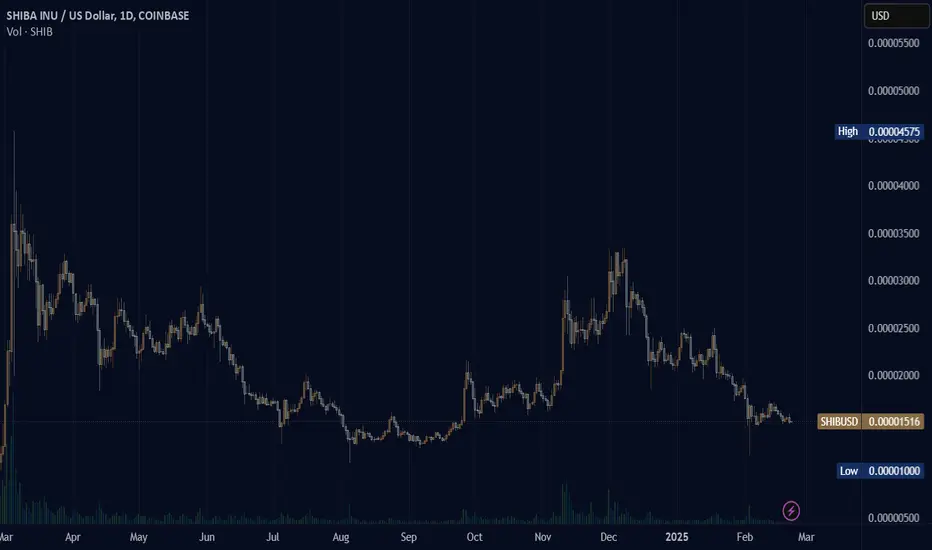
(SHIB) shiba inuThere is no cup and handle coming. The activity online by community programmer Kusama and other people seem to have led to a disgracing of the SHIB token and all that has happened is losing. Too much talk, not enough action. Silence is golden inu. There is still hope for Shiba Inu on the likes the acceptance of Shiba came far before many other meme tokens. Right now the Solana craze is being phased out in favor of Base chain memes. Base seems to be countering the popularity of Ethereum. Shiba Inu on Ethereum is not seen as trending the same way Solana memes and now Base memes are trending.
(SOL) solana "big gulp"The price of Solana is looking like it is going to go into a big gulp phase with a potential for a bottom (buying zone) and a recovery (ramp up) out of the big gulp moment.

(XLM) stellarStellar, an inactive pond with ducks wading graciously through the water while those sitting by steadily view the inactive activity of peaceful animal life living among the life of humans, no voices, only the sound of trees rustling and wind blowing through the air.

(RL) ralph lauren A chart to view Ralph Lauren through some visual of my indicators for anyone who wants to see. Make what you will from the image and make up your own mind about the fear and greed concept for Ralph Lauren right now. Will the price continue, or will the price not?
The shares represents shares bought. The green line would then mean there are few shares bought and the shares are soon to go negative against the price of the stock. The more shares bought the higher the line spikes, pertaining to the lineMath_v3 (shares) indicator.

(RL) ralph lauren Crazy high price for Ralph Lauren right now. The RL stock is doing excellently; as I just noticed today. I was unable to find any clothing that fit me or fashion styles that looked both vintage and modern at the same time during the Holidays this year; or any year. On average, inside the RL store in Lehi, UT the quality of styles is limited and the prices are typical of what one would expect from RL. I wish RL would offer more styles that they used to based on the 90s and early 2000s here in Utah. I wish the discounted styles in my size were offered or not completely gone as soon as the sale arrives during the Holidays. RL is a highly sought after brand but I've only ever owned one piece of cotton blue button up Ralph Lauren Levi's-esque shirt that ripped at the elbow due to the cotton material being so tender. I'm not rating RL as a short due to the fact that I don't own the clothing and can't afford the clothing. The MACD is really high right now.

Bitcoin Weekly Update: 2025 Boom Boom Bull-Market Confirmed!If this week closes green it will be the first green close after three weeks red. This would confirm that the small retrace that we experienced recently is over. That the early February flash-crash was a market flush. That the consolidation phase we've been talking about is reaching its end. That the 2025 bull-market is now on! (We have only 2 days left!)
Good morning my very much and highly appreciated reader, how are you feeling in this wonderful now?
The fact that the retrace is over and the consolidation phase is over means that the next move is starting. The start of the next move is no small feat, no; this is something huge, it is something big.
It is not the same to say that Bitcoin is going up; know that Bitcoin is going up and waiting for Bitcoin to go up vs seeing the actual Bitcoin going up.
It is not the same knowing vs experiencing.
When Bitcoin starts to grow we are officially in the 2025 bull-market bullish wave. When Bitcoin starts growing, the entire world will move, the entire world will shake.
As Bitcoin grows, everything will change, for the better.
New players will enter the different markets all across the world.
New personalities will come to the front. New laws, new life, new energy; freedom and prosperity, the Altcoins also will grow.
It is not a small event, we are in front of a very strong market, many millionaires will be created during this bullish phase.
Plan calm. Be smart. Do what it takes. Do your own thing.
Your results are yours. You are special and you deserve the best.
The market offers endless opportunities, it is for you to take action and prepare to accept abundance, wealth, health and growth.
The bottom is in, Bitcoin is super strong.
This is the start of the next bullish wave. This bullish wave will produce a very strong bull-run at the end.
We are likely to witness slow and steady rising prices for a while and then bullish momentum will grow. We will have months and months and months to enjoy a positive market, a growing market, and this bull-market might evolve and give us more than what was initially thought.
Whatever the market does, you will be rewarded based on your own actions. What you get will be defined by your thoughts.
Develop a positive attitude, a positive mind. Visualize yourself achieving your goals. There is no limit, you can aim as high as you want.
Namaste.

BTC (BTC/USDT) 4H Chart: Bullish Momentum BuildingThe 4-hour Bitcoin chart is showing clear signs of bullish continuation. Price action is forming a series of higher lows, supported by an increase in volume, signaling strong buying interest. The RSI is trending upward but remains below overbought levels, leaving room for further upside.
Support remains well-defined, providing a solid foundation for this setup and a favorable risk-to-reward ratio. Traders should watch for a clean retest of the breakout zone or a confirmation candle for potential entry.
Overall, market structure, volume dynamics, and momentum indicators are aligning for a possible bullish continuation on the 4-hour timeframe.

Ethereum (ETH/USD) Long Setup on 1D – Bullish Breakout Ahead Ethereum (ETH) stands at a crucial crossroads on the 1-day chart. After weeks of consolidation, the battle between bulls and bears intensifies. Yesterday’s candle closed above the critical $2,800 resistance—a level the market has respected for weeks. This isn’t just a line on a chart; it’s a signal that the tides may be turning.
Markets reward those who act with insight, not impulse. Is this the moment Ethereum reclaims its momentum?
do you trust the breakout or expect a fake-out? Let’s discuss below! 👇

PEPE (PEPE/USDT) Potential Bottom and Key Levels to Watch 4HPepe Coin (PEPE) has been showing some interesting price action recently, and many traders are keeping a close eye on its movements. At current levels, there is a possibility that the asset is approaching a potential bottom, making it an intriguing spot for both spot and leverage orders.
Looking at the charts we can see that Pepe is testing some critical support levels. If these levels hold, we could be looking at a reversal or at least a stabilization phase that offers solid entry points for traders.
Strategically placing both spot and leverage orders around these levels could lead to favorable outcomes, but as always, make sure to use proper risk management and assess market conditions closely.

Phala (PHA/USDT) Bullish Setup on the 1H Chart - Zoom outPhala (PHA) is currently showing a promising bullish setup on the 1-hour chart. The price has been moving within an ascending channel recently, with clear signs of bullish momentum. Here are the key points indicating a potential rise:
If the bullish scenario plays out, traders could set profit targets around $0.30and $0.40. To manage risk, stop-loss orders can be placed below the rising support line or the most recent low, depending on individual risk tolerance.

Dogecoin (DOGE/USDT) 4H Analysis - Potential Setup in Play DOGE is forming a bullish pennant pattern on the 4-hour chart, indicating a potential continuation of the uptrend. A breakout above the upper trendline could trigger a strong move upward.
However, there are some risk factors to consider. A bearish divergence on the RSI suggests the possibility of a short-term correction. Furthermore, the 200 EMA on the 4-hour chart is acting as dynamic support. Losing this level could shift momentum to the downside.
Currently, DOGE is trading at $0.2524, with an intraday high of $0.2679 and a low of $0.2481.

Snowflake ($SNOW) | Rerating Incoming with 2-3x PotentialOur top analyst Shay Boloor (@StockSavvyShay) is adamant that Snowflake will be rerated in 2025 with a price target of $300 (called out live on Fox Business). Their NRR is at 127%, meaning existing customers will spend 27% more YoY. For Snowflake to grow 27% within the next year, all they need to do is nothing. They can afford to sit.
Data consumption models make money out of thin air. 40% of the Fortune 2000 data is stored in Snowflake’s ecosystem ALREADY. They are trading at 25% of Palantir’s valuation and 20% of Cloudflare’s. This could be a 3-4x trade. There is still no floor on AI and its applications.
On the technical side, over $205 and we have a liquidity zone up to $300. Our entries are at $109 and $125, but this would be a secondary entry for a position trade to capitalize on one of the top names in stage two AI (software/applications).
Entry: Over $205
Targets: $230, $300, $400
NYSE:SNOW

Market3I haven’t been posting much lately simply because there’s nothing particularly interesting to say, the market has been a bit dull.
2025 should be a strong year for altcoins, as they’ve been consistently suppressed. With BTC dominance reaching 64%, which is quite significant, all attention remains on Bitcoin.
On this chart, you can see that $1.17 trillion acted as a rejection level for the crypto market (excluding BTC and ETH). Time will tell, but I anticipate a $4 trillion altcoin bull market before the end of 2025.
Remember, Fibonacci plays a crucial role in long-term market predictions.
Invest wisely and at the right time.
Happy Tr4Ding !

S&P 500 Forecast for 2025: Insights from Stock Market CyclesAMEX:SPY
CME_MINI:ES1!
SP:SPX
January Barometer: The month of January has already closed with a net gain over December. Therefore, in accordance with the January Barometer this suggests a positive year.
First Five Days Indicator: The first five trading days being positive further supports this outlook. Although they were barely positive at +0.6% it still counts.
December Low Indicator: This indicator is bearish if the December low is taken out in Q1 of the year. Unfortunately, the December low was already breached in January, which adds a note of caution. We now have two bullish indicators and one negative indicator.
Presidential Cycle: With 2025 being the first year of a presidential term, historically this has been bearish for the stock market. It brings uncertainty, which may temper expectations. This is the year where presidents typically enact changes and tough fiscal measures, although president Trump may prove to be atypical here; especially if he enacts any of his tax policies, rate cuts or large government spending programs this year. So, while this indicator is bearish, it has a caveat given how unorthodox Trump is as a president. For example, in 2016 the stock market was very volatile but still gained 10% under Trump’s first term year.
Outlook: Combining these factors, the outlook for 2025 is cautiously optimistic. While the January barometer and the first 5 days indicator point to a positive year, the breach of the December low coupled with this being the first-year of a presidential cycle suggests a volatile to bearish year. When combining all indicators we arrive at the conclusion that we are in for a volatile RANGE year. The bulls and bears will battle it out in a tug of war. While January-April tend to be seasonally bullish, May-October tend to be bearish. November and December are seasonally bullish too. So whether the year closes with a slight gain or slight loss isn’t the focus. The best approach for this year is to capitalize on the swings. Therefore, mean reversion strategies (buy low, sell high) are ideal. Momentum and breakout strategies should be avoided. Finally, avoid being caught in a drawdown in the May-October period and position yourself to capitalize on the Nov-Dec seasonally bullish period.

BTC Correction Nearing Key Support – What’s Next?Bitcoin has been in a corrective phase over the past two days, retracing from recent highs and approaching critical support levels. Let’s break down the current market structure and identify potential trade opportunities based on confluences from multiple technical indicators.
Key Support and Resistance Levels:
1. ) Golden Pocket Zone – $95,535 to $94,994
The 0.618 Fibonacci retracement is a widely recognised level where strong reactions often occur.
This level aligns with a previous consolidation zone, making it a key demand area for potential long entries.
A bounce from here could indicate that bulls are regaining strength.
2.) Deeper Support – 0.786 Fib, Monthly Order Block, and Yearly Open (~$93,576)
If the golden pocket fails, the next key area of interest is around $93,576.
Here, we see confluence with:
The 0.786 Fibonacci retracement, often the last strong retracement before a reversal.
A monthly order block, which has previously acted as a strong support area.
The yearly open, a crucial psychological and technical level that often holds significance throughout the year.
3.) Next Major Support if Yearly Open Fails – $88,000 to $86,000 (Swing Low & Weekly Support Zone)
If price drops below the yearly open with confirmation of bearish momentum, I would look for the next buying opportunity at the swing low or weekly support zone, highlighted in the yellow box around $88,000 to $86,000.
This area holds strong confluence as a higher timeframe support level, making it an attractive zone for potential accumulation.
4.) Resistance Levels – Open Price and Psychological Barrier at $100K
$97,700 – This is the weekly open resistance level. If BTC struggles to reclaim this level, it could indicate further downside.
$100K – A major psychological resistance where sellers could step in. Breaking and holding above this level would be a strong bullish signal.
Trade Setups Based on Current Structure:
1.) Long Trade Setup – Golden Pocket Zone ($95,535 - $94,994)
Entry: Between $95,535 and $94,994 (Golden Pocket Zone)
Stop Loss: Below $93,500 to protect against further downside
Take Profit 1: $97,700 (weekly open resistance)
Take Profit 2: $100K (psychological resistance)
2.) Deeper Long Setup – If 0.618 Fib Fails ($93,576 - Yearly Open Zone)
Entry: Around $93,576 (0.786 Fib + Monthly Order Block + Yearly Open)
Stop Loss: Below $92,000
Take Profit 1: $97,700
Take Profit 2: $100K
3.) Alternative Long Setup – If Yearly Open Breaks ( FWB:88K - $86K Zone)
Entry: Around $88,000 to $86,000 (Weekly Support Zone)
Stop Loss: Below $85,000
Take Profit 1: $93,500 (yearly open retest)
Take Profit 2: $100K
Final Thoughts:
Bitcoin’s current structure suggests a healthy correction within a larger uptrend. The golden pocket ($95,535 - $94,994) remains a key level for potential long entries, while a failure to hold here could see price testing the $93,576 region. However, if price drops below the yearly open and confirms bearish momentum, the next major buying opportunity lies at the Swing Low or Weekly Support Zone at $88,000 - $86,000.
New Free Indicator – Multi Timeframe 8x MA Support Resistance Zones
I’ve just released a free indicator called Multi Timeframe 8x MA Support Resistance Zones, which is now live and ready to use! This indicator provides dynamic support and resistance zones based on multiple moving averages across different timeframes, helping you identify key areas for potential trade setups with better precision.
Feel free to check it out, give it a try, and let me know your feedback! 🚀

XAUUSD Gold Short Trade For Swing TradersEvery day, the market sets new highs. According to the study, we should expect a good corrective move in the next days.
We have SL in the last two transactions. We intend to execute a swing sell trade with a risk-reward ratio of 1-10; if this fails, we will proceed with a 1-12 risk-reward ratio.
The market is at a point where a correction should occur, but the outlook for gold remains favorable.
Because the market is already at an all-time high, preparing a long trade now may be riskier, thus in order to be active in long trades this month, we must wait for at least 70-100 points of price correction.
You are all respectfully requested to use proper risk management when following these assessments and executing the suggested trades.

XAU/USD Short Trade for swing tradersThe market is reaching an all-time high every day. According to the analysis, we should see a good corrective move in the coming days.
We have SL in the past two trades. We are planning a swing sell trade with a 1-10 risk-reward ratio; if this fails, we will plan the next swing trade with a 1-12 risk-reward ratio.
The market is at levels where a corrective move should occur, but the view on gold is still bullish.
Because the market is already at an all-time high, planning a long trade, for now, can be more risky, so to be active in long trades for this month, we need to wait for at least 70-100 points of correction in price.
you are all kindly requested to follow proper risk management to follow these analyses and execute the provided trades.
