BTC/USDT 4H ChartHello everyone, let's take a look at the BTC to USDT chart on a 4-hour time frame. As you can see, the price is moving above the local uptrend line.
After unfolding the Fib Retracement saitka, you can see that the price is struggling with the resistance at the level of $45,050, while there is still strong resistance at the level of $46,766.
Looking the other way, you can see support at $42,816, and then the second support at $41,160.
The RSI shows a rebound from the upper limit, which gives a slight rebound, while the STOCH indicator still remains above the upper limit, which may result in a greater price recovery.
4hrchart

ETH/USDT 4HHello everyone, let's take a look at the ETH to USDT chart on a 4-hour time frame. As you can see, the price has moved higher from the local downtrend line.
After unfolding the trend based fib extension tool, you can see how the price is struggling with the resistance at $2,413 and may then rise to the resistance at $2,503.
Looking the other way, you can see support at $2,367, followed by a support zone from $2,306 to $2,273.
There is still some room for growth on the RSI, but the STOCH indicator shows a move above the upper limit again, which may limit the upward movement.

ATOM/USDT 4HInterval ChartHello everyone, I invite you to review the ATOM chart in the USDT pair, taking into account the four-hour interval. First, we will mark the upward trend channel with the blue lines, where we could see the price breaking down, and the decline itself was close to the height of the previously defined channel. Currently, using the yellow lines, it is worth defining a triangle from which the price starts to exit with an upward movement.
Moving forward, we can move on to marking support areas in the event that the price turns again. And here the first support is at the price of $9.11, which effectively kept the price from further declines. However, if we see a break from the current support again, it may result in a drop to around $8.18.
Looking the other way, we see that the first important resistance is at the level of $10.18, and if the price positively crosses it, it may move towards the second resistance at the level of $11.11.
Please look at the RSI indicator, as there is still room for price increases, and if we look at the STOCH indicator, it should raise caution as we are moving at the upper end of the range, which may influence the willingness to react.

BTC/USDT 4HInterval Chart ReviewHello everyone, I invite you to check the current situation on BTC in pair with USDT, taking into account the four-hour interval. First, we will use blue lines to mark a strong downward trend channel from which the price moved sideways, from which we can determine a local upward trend.
Looking at the current price consolidation, it is worth deploying the Trend Based Fib Extension tool, thanks to which we can determine the resistance to which the price is approaching at the level of $ 43,942, when it comes out on top and tests it positively, it may go towards the next strong resistance at the price $45,193. However, the price still has to face a very strong resistance zone from $46,094 to $47,220.
Looking the other way, in a similar way, you can determine support when the price changes the direction of movement. And here, first of all, it is worth defining a strong support zone from $42,501 to $41,721, and then we can see support around $40,481, which is the first support after returning to the sapping trend channel.
The RSI indicator shows that we have broken out of the downtrend line, with room for the price to go further. And when we look at the STOCH indicator, we will see that it also has room for further growth, and just like the RSI indicator, it came out on top from the sapping trend line.

BTC/USDT 4HInterval ChartHello everyone, let's take a look at the BTC to USDT chart on a four-hour time frame. As you can see, the price is climbing along the local upward trend line.
After unfolding the Fib Retracement saitka, we can see support at $41,853, and then we have a strong zone from $39,658 to $38,529.
Looking the other way, there is strong resistance at $44,985, but before that the price must break out of the resistance zone from $42,503 to $43,600.
The RSI indicator still shows room for a downward move, while the STOCH indicator is approaching the upper limit, which may also translate into a price recovery.

MKR/USDT 4HInterval Chart ReviewI invite you to review the chart of MKR in pair with USDT, on a four-hour interval. Here, using the blue lines, we will identify a strong downtrend channel where the price is approaching the upper part. Additionally, inside the channel, yellow lines will indicate an additional local downward channel, in which the price is at the upper edge, but this may limit the increase.
Now let's move on to defining the supports. And here, after unfolding the Fib Retracement grid, you can see how the price is maintained in the support zone from $1972 to $1924, then there is support at the price of $1862, but if we go lower, the next very strong support is around the price of $1684.
Looking the other way, we can similarly determine the resistance areas that the price must face. And here you can see how the zone from $2012 to $2065 stops the upward movements, then when we go above it and from the falling channel, we have resistance at the level of $2150, and then at the current peak at the price of $2287.
Looking at the RSI indicator, you can see how there is a fight to come out on top from the downtrend line. However, on the STOCH indicator, we are very close to the upper limit, which may translate into an upcoming price recovery.

BNB/USDT 4HInterval ChartI invite you to review the BNB/USDT chart, on a four-hour interval. As you can see, the price remains above the local upward trend line.
Looking at the price increase, it is worth spreading the fib retracement grid, thanks to which you can see the price fighting in a strong resistance zone from $308 to $314, and then there is resistance at $322.
Looking the other way, there is support at $303, followed by a strong support zone from $293 to $287.
The RSI shows room for a price increase, and the STOCH indicator shows another increase, which may limit the room for increases.

BTC 4H Resistance and supportWhat to expect on the BTC chart? As you can see, the price broke out of the local downtrend line.
Looking at the price rebound, it is worth spreading the trend based fib extension grid, thanks to which you can see the resistance zone from $42,819 to $43,692.
On the other hand, there is support at the level of $40,857, and then we have an important zone from $39,401 to $38,613.
The RSI indicator still shows room for a price increase, while the STOCH indicator remains above the upper limit, which may result in a price recovery.

LINK/USDT 4H ChartI invite you to review the LINK chart in pair with USDT. Let's start by identifying the downward trend channel from which the price broke out at the bottom using the blue lines. However, here the exit from the channel could have resulted in a drop close to the height of the channel itself, which indicates a potential place for further declines. Locally, we can mark a downward trend line that keeps the price in a downward movement.
After unfolding the fib retracement grid, you can see how the support at $13.91 kept the price from falling further, but if the price breaks below the current support, we still see a very strong support zone from $13.17 to $12.22.
Looking the other way, we can also determine the resistance areas. And here there is visible resistance at $14.73, and when the price breaks out, it will have to face a strong resistance zone from $15.98 to $16.63 before moving towards the new ATH.
Please look at the RSI indicator as there is still room for growth, but the indicator is starting to turn down again. However, on the STOCH indicator we are moving at the lower part of the range, but here too there is no energy for a stronger upward movement.

DOT/USDT 4HInterval ChartHello everyone, I invite you to review the chart of DOT in pair with USDT. First, we will use the yellow line to determine the downward trend line, and additionally, we can define the local downward trend channel using the blue lines.
Moving on, we can move on to marking support places using the trend based fib extension grid. And here we have a visible strong support zone with prices ranging from $6.67 to $6.15, but if we break out of this zone, we still have support at $5.48.
Looking the other way, we see resistance at $7.09, then we can mark an important support zone from $7.94 to $8.37, and then we have very strong resistance at $9.64.
It is also worth paying attention to the RSI indicator and the STOCH indicator, where we observe a rebound from the lower limit, which results in a slight price rebound with room for greater growth.

ETH/USDT 4HInterval I invite you to review the chart of ETH in pair with USDT, taking into account the four-hour interval. We will start by identifying the upward trend line from which the price broke lower and created a local downtrend channel, from which the price also broke lower.
By looking at the current price decline using the Fib Retracement tool, we will check the current supports that we should take into account. And here you can see that the price is approaching the support level of $2,319, then we have visible support at $2,209, and then it is worth marking strong support at $2,073.
At this point, it is worth turning on the EMA Cross 10 and 30 indicator, which confirms the moment of transition into a local downtrend. However, when we turn on ema cross 50 and 200, we can see that despite the current correction, we are still in a strong upward trend.
Looking the other way, we can similarly mark places where the price should encounter resistance on the way up. And here we have the first resistance at the price of $2,491, then we can see strong resistance that twice rejected the price at $2,578. And then there is a strong resistance zone from $2,640 to $2,717, which has kept the price from making more gains.
Please look at the RSI indicator, you can see here that we are approaching the lower limit, which may stop the current trend, the situation is similar with the STOCH indicator, which is based on the lower limit of the range.

LINK/USDT 4HInterval ChartI invite you to review the LINK chart on a four-hour interval. As we can see, the price has overcome the downward trend lines, but currently the blue lines mark the upward trend channel that the price has created with upward movements.
Let's start by laying out the Fib Retracement grid, which will help determine price support points, and we can see that first we have support at $14.80, and then we can see a strong support zone from $13.10 to $12.20.
Looking the other way, we can similarly determine the resistance areas that the price must face. And here you can see the price approaching a strong resistance zone from $16.48 to $17.64. If the price breaks out of this zone and tests it positively, we may see increases towards the resistance level of $31.
Please look at the RSI indicator because you can see that we are approaching the upper limit, but there is still room for further increases. However, the STOCH indicator shows an increase to the upper limit, which limits the upward movement and may result in a price recovery.

LINK/USDT 4H ChartI invite you to review the LINK chart taking into account the four-hour interval. Here we will start by defining, using the blue lines, the upward trend channel from which the price broke out at the bottom, but we can see a quick return and a fight to return to the channel. At this point, it is also worth marking the local downward trend line in yellow, which the price has broken with an upward movement.
Looking at the current situation, we will spread the Fib Retracement grid, thanks to which we can confirm the place of return to the channel, as the first significant resistance at the level of $14.28, then we have a visible second resistance at the level of $15.57, and then located at the upper border of the upward trend channel , a strong resistance zone from $16.50 to $17.67.
Please look at the EMA Cross 10 and 30 indicator as we can see the red ema cross 10 line attempting to cross the green ema cross 30, potentially indicating a return to the local uptrend. However, it is worth being careful whether this is just a false breakout and the price will start to reverse.
In such a situation, we will unfold the fib retracement sheet again to determine the supports. And here you can see support at the level of $13.79, and then it is worth marking the support zone from $12.74 to $12.19, if this zone is broken, we can see the price return to around $10.59.
Now it is worth switching to the RSI indicator, which shows an upward trend line that gives rise on the chart, with room for new movements, but after switching to the STOCh indicator, we see that a downward trend has begun, which may, however, result in a price correction.

SOL/USDT 4H Chart ReviewI invite you to review the SOL chart in the USDT pair. We will start by defining the yellow line as an upward trend line from which the price has broken out at the bottom, creating an ongoing downward trend channel in which we are approaching the upper border.
Going further, we can move on to marking support areas when we start a larger correction. And here the first support is at the price of $89.78, but further we can define a very strong support zone from $80 to $67.
Looking the other way, once again after unfolding the fib retracement saitka, we see that the price has reached the resistance level at $100.73, only when it overcomes it and exits the upper channel, will it move towards the resistance zone from $118 to $126, which is held price before moving towards $151.
Please look at the RSI indicator, which has returned to the middle of the range, making it difficult to indicate the direction, while the STOCH indicator shows a downward movement with room for the price to recover more.

MATIC/USDT 4HIntervalI invite you to review the chart of MATIC in pair with USDT. First, we will use the blue lines to mark the upward trend channel in which the price is fighting at the lower border.
Let's move on to determining the support, and for this purpose we will unfold the trend based fib extension grid, thanks to which we can see a strong support at the level of $0.76, however, if the support is broken and the price leaves the current channel lower, it may result in a price drop close to the height of the channel, which could bring the price to a very strong support zone from $0.61 to $0.53.
Looking the other way, we see that the level of $0.86 has effectively reduced the price, only when we go higher, the next resistance is at the level of $0.95, and then we have a visible strong resistance zone from $1.01 to $1.08. At this point, it is worth defining the local downtrend line, which confirms the $0.95 level, as an important resistance.
It is worth looking at the RSI indicator, which shows a movement in the lower part of the range, which gives room for possible increases, and what is more, the situation looks similar on the STOCH indicator, but it is worth remembering that we are still in a downward trend and a lot depends on the behavior of the BTC price.

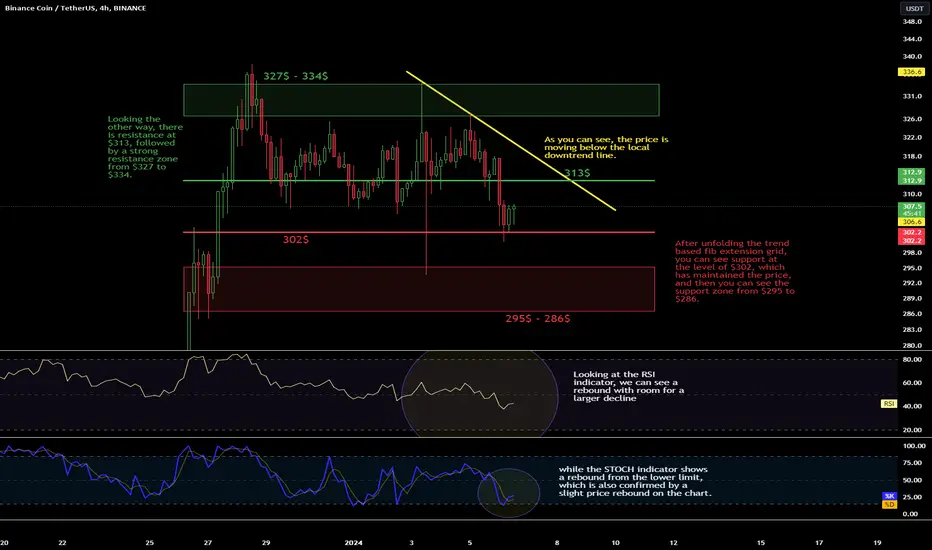
BNB/USDT 4HInterval Chart support and resistanceHello everyone, let's take a look at the BNB to USDT chart on a four-hour time frame. As you can see, the price is moving below the local downtrend line.
After unfolding the trend based fib extension grid, you can see support at the level of $302, which has maintained the price, and then you can see the support zone from $295 to $286.
Looking the other way, there is resistance at $313, followed by a strong resistance zone from $327 to $334.
Looking at the RSI indicator, we can see a rebound with room for a larger decline, while the STOCH indicator shows a rebound from the lower limit, which is also confirmed by a slight price rebound on the chart.
ETC/USDT 4H ChartI invite you to review the ETC chart on a four-hour interval. We will start by defining, using the blue lines, the upward trend channel from which we tried to exit at the bottom. Locally, a yellow downward trend line has formed.
Let's now move on to marking support areas for the price and here, after unfolding the trend based fib extension grid, we can see that the price with dynamic movements returned to the support zone from $20.56 to $19.52, while leaving the zone at the bottom may result in a strong decline even to the vicinity $16.50.
Looking the other way, we can similarly determine the resistance areas that the price must face. And here we can see the $20.76 level again as resistance, after which we can see increases towards the strong resistance zone from $23.12 to $24.38 just at the upper border of the previously mentioned channel.
Looking at the RSI indicator, we can see that we have approached the lower limit, which could have slowed down the decline, but there is still room for recovery, while the STOCH indicator shows a quick rebound from the lower limit, which gives us energy for another price drop.

ETH/USDT 4HInterval ChartHello everyone, I invite you to review the chart of ETH in pair with USDT, on a four-hour interval. First of all, we can use the blue lines to mark the upward trend channel from which we could observe a breakout at the bottom, after which the price struggles to maintain the level.
Now let's move on to marking the support places. We will use the Fib Retracement tool to mark the supports, and as you can see, the price has dynamically returned and remains in the support zone from $2,243 to $2,191, then there is support which stopped the price drop around $2,120, but if the price breaks out of it, we can see a return in around strong support at $1918.
Looking the other way, we can similarly mark places where the price should encounter resistance on the way up. And here again the resistance level is $2,302, then there is a strong resistance zone from $2,365 to $2,445, which stops the move to around $2,674.
When we turn on EMA Cross 10 and 30, we can see confirmation of a potential downward trend.
The RSI indicator shows a strong recovery, a return to the place where the price rebounded previously, but with room for the price to go lower, while the STOCH indicator also shows a strong recovery with visible room for another decline.

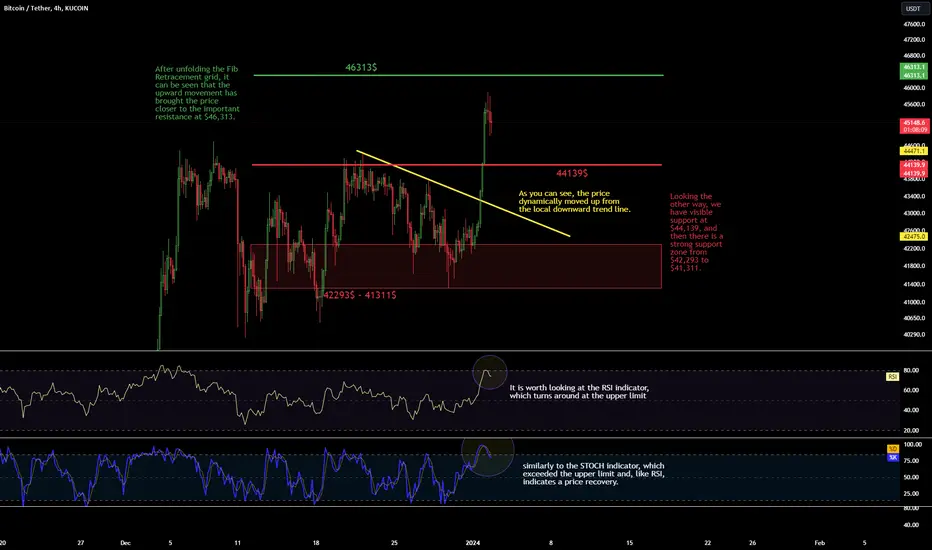
BTC/USDT 4HInterval Support and ResistanceHello everyone, let's take a look at the BTC to USDT chart on a four-hour time frame. As you can see, the price dynamically moved up from the local downward trend line.
After unfolding the Fib Retracement grid, it can be seen that the upward movement has brought the price closer to the important resistance at $46,313.
Looking the other way, we have visible support at $44,139, and then there is a strong support zone from $42,293 to $41,311.
It is worth looking at the RSI indicator, which turns around at the upper limit, similarly to the STOCH indicator, which exceeded the upper limit and, like RSI, indicates a price recovery.
MKR/USDT 4HInterval ChartI invite you to review the chart of MKR in pair with USDT, on a four-hour interval. First, we will use the yellow line to mark the upward trend lines above which the price remains.
Going further, we can move on to marking support areas when we start a larger correction. And here, after unfolding the trend based fib extension grid, the first support is at the price of $1,537, and then it is worth defining the support zone from $1,410 to $1,343.
Looking the other way, we see that the price has been rejected by the resistance at $1,680, only when we manage to break out of it can we see an attempt to grow towards the resistance zone from $1,849 to $1,936.
Please look at the CHOP index, because you can see that the current price recovery gives an increase in energy for a new move, the RSI indicator shows a rebound with room for a further decline, and the STOCH indicator behaves similarly, which also has room for the price to go a little lower.

BTC/USDT 4HInterval ChartHello everyone, I would like to present an overview of the current situation on BTC in the USDT pair, taking into account the four-hour interval. First, we will use yellow lines to mark the local triangle in which the price is approaching the exit and the direction of further movement.
Going further with the help of the trend based fib extension grid, we will check the resistance areas in the event of increases. And here again we can see resistance at the level of $43,092, while further we have a visible resistance zone from $44,646 to $45,467.
Looking the other way, we can mark support points in the same way when a correction begins. And here the support zone from $42,076 to $41,454 is visible. However, if this zone is broken and we see a bottom exit from the triangle, we may see a drop to the support level of $39,613.
Please pay attention to the RSi indicator, where we have returned to the middle of the range, while the STOCH indicator shows a dynamic movement, which may result in a slight price recovery. As you can see in the CHOP index, there is still energy to make a bigger move.

BTC/USDT 4H ChartSupports and resistances for BTC in pair to USDT on a four-hour time frame. As you can see, the price remains below the local downtrend line.
After unfolding the trend based fib extension grid, you can see support at $42,178, followed by a support zone from $41,005 to $40,410.
Looking the other way, there is resistance at $43,059, and then a resistance zone from $44,666 to $45,501.
It is worth looking at the RSI and STOCH indicators, because you can see that both have bounced off the downward trend line, which results in a new relaxation in the price.

ETH/USDT 4HInterval ChartPlease see the chart of ETH in pair with USDT and here we will return to the four-hour interval. First, we will determine the local channel of the downward trend from which the price broke out with an upward movement.
In order to determine resistances, it is worth spreading the fib retracement grid, and we will see that the price is struggling with a strong resistance zone from $2,294 to $2,343, and when it is overcome, it will move towards the next important resistance at $2,404.
In the same way, to determine the supports, we will unfold the Fib Retracement grid again, we will see support at the level of $2257, the next one is around $2203, and then it is worth defining the support zone from $2165 to $21117, right at the lower border of the previously mentioned channel.
The CHOP indicator shows that there is still energy to make a move, the RSI indicator is approaching the upper limit, which may affect the price recovery, and the STOCH indicator shows a move near the upper limit, which may also affect the price's attempt to recover.
