DOWN ON UPTREND LINE THEN PULLBACK UP - VERY SOON - AAPL - DAILYFrom the last analysis on the AAPL we can see that the market has decided to get out the range on 30MN for a very long uptrend.
The last decisions have impulsed the price of AAPL in an exponential move.
BUT, we have seen last week a push from sellers, a very strong one, probably showing a zone in which you can start thinking of taken your profits.
The former resistance center dark blue uptrend line becomes now a strong support. The is strong probability to see the market coming back to it for a pullback.
Still, the market have some room to another horizontal level, less like ly to happen now, but still possible, it is markets by a black dotted line with red dots at the end. This level has been the key point where the buyers kicked out all seller. They then disappeared, now they are back but different people, those present now are the ones getting there profits from the last exponential move.
The next month will see some nice movement on AAPL, all the red lines on the graph are probable good entries for a long direction trade, that is why this post will be market as a LONG direction probable trend overall even if we will see a little slope before the next rise.
Aaple

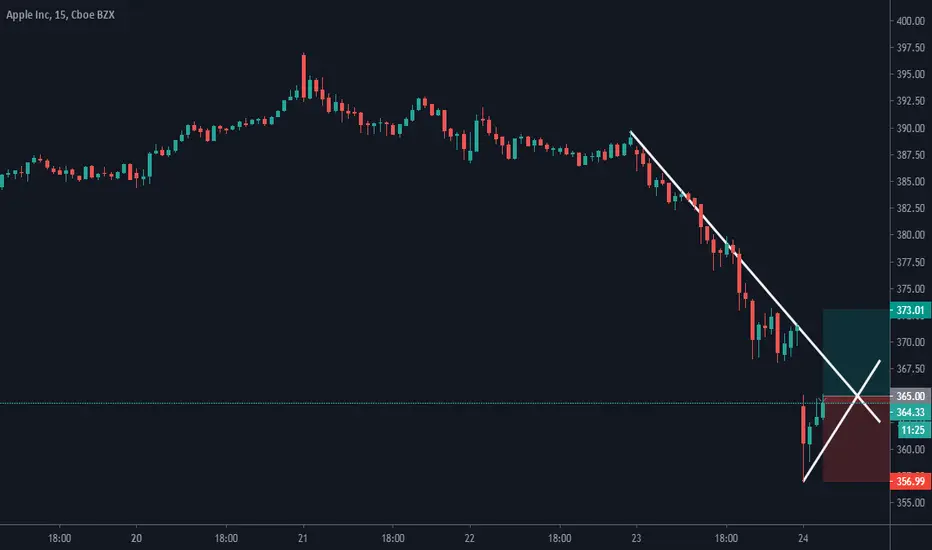
AAPL profit taking down to $465AAPL has had quite the run lately and it looks like profit taking has begun prior to the upcoming split.
This morning we had the initial move down with a 13 EMA/30 SMA hourly crossover. This is accompanied by a lowering RSI as well as high volume.
Our target is the support at the 61.8 Fib level above $465.

AAPL to $500 then back to realityNASDAQ:AAPL
AAPL has yet to smack $500, so I see it hitting $500 as a psychological PT, then falling back to it's first major support of $465. Ongoing analysis to come.


#AAPL - Wave 3 of wave 3 #appleCurrently, wave 3 of the wave 3 may be nearing the end.
Even with the last trillion USD market capitalization, the price corrected quite considerably by around 39% from USD 233.47 to USD 142, thus hitting the 38.2 retracement almost exactly.
Greetings from Hannover
Stefan Bode

Too much hype behind AAPLNASDAQ:AAPL
I just have to LOL at AAPL's price right now. With no change to P/E, there's no justifying this unreal price hike. As the chart shows, this stock has gone parabolic and will inevitably crash. My first PT is 325, but it may run up to resistance at 480-500 first. If AAPL falls below 435, consider the shorts in control.


AAPL wave (v) Updates on AAPL as tech is leading the rally, looking for a wave (iv) pullback to close out our -ve delta butterfly spread. Could this be all of wave (v)? We’re rallying in same free wave (v) moving through the 447 resistance level before a corrective pullback ensues.

AAPL APPLE Buenas noches espero qué estén bien reciban un saludo.
Les analizo apple, actualmente tuvo una rotura del canal alcista en el medio plazo, en el largo nos encontramos en maximos histórico,en el corto ahora mismo en plano.
PUNTOS DE INTERES: 1 SOPORTE 2 SOPORTE 3 SOPORTE 4 SOPORTE, FUE LA RESISTENCIA DEL MÁXIMO ANTES DE LA PANDEMIA mucho ojo a este dato. ALCISTA, RESISTENCIAS: Tiene mucho recorrido en el corto medio plazo marcada linea amarilla.
CUIDENSE UN CORDIAL SALUDO L. E. D. En España a 29/07/2020
síganme en twwitter faacebook insttagram : wallstreetstocks
Good evening I hope you are well receive a greeting.
I analyze apple, currently it had a break in the bullish channel in the medium term, in the long term we are at a historical high, in the short one right now.
POINTS OF INTEREST: 1 SUPPORT 2 SUPPORT 3 SUPPORT 4 SUPPORT, WAS THE MAXIMUM RESISTANCE BEFORE THE PANDEMIC a lot of eye on this data. ALCISTA, RESISTANCES: It has a long way to go in the short-term, marked yellow line.
TAKE CARE OF A CORDIAL GREETING L. E. D. In Spain on 07/29/2020
follow me on twitter faacebook insttagram: wallstreetstocks


#AAPL - UPDATED EMA CHART Updated chart providing a more elongated perspective on the definitive trend line.
Its more than obvious that when the price intersects the ema you have a significant
bullish upswing. The breakouts are substantial usually occurring over a 30 bar period
with the most significant movement occurring from June 29th, through July 13th.
Prior movements from the intersecting points (since March) have a included
a $27 gain from June 4th, through June 11th, and a $29 gain from June 15th,
through June 23rd.
In this chart the line only dips below the intersecting ema 4 times (since March)
and averaged less than a $3 drop over a period of 2-3 days.
The chart maybe simple, but it makes abundantly clear when to buy.


ANALYZE: AAPLafter all i notice on the chart my probability the trend go up to test the resistance line

ANALYZE: AAPLafter all i notice on the chart high probability the trend go up to test the support line


AAPL at historical equilibrium!!! (Vibrational Analysis)I see markets are like a song and they create a vibration which can be visually observed as trend curves going up and down an equilibrium. Price has a tendency to move inside the vibration which would be low energy state.
Now when the price breaks outside the vibration, which I term as a deviation, this has an important impact on the future structure of the vibration, acting like an external force.
My entire concept is pretty deep and I wouldn't be able to share my entire philosophy here. However, though this chart I have tried to give a glimpse of this methodology. Pretty well if it makes sense to you.
So currently as per my analysis, as you will see in this chart, price is at the historical equilibrium. If this equilibrium turns into a support, we would be entering a huge bull cycle with an aim of $2500 per Apple share.


