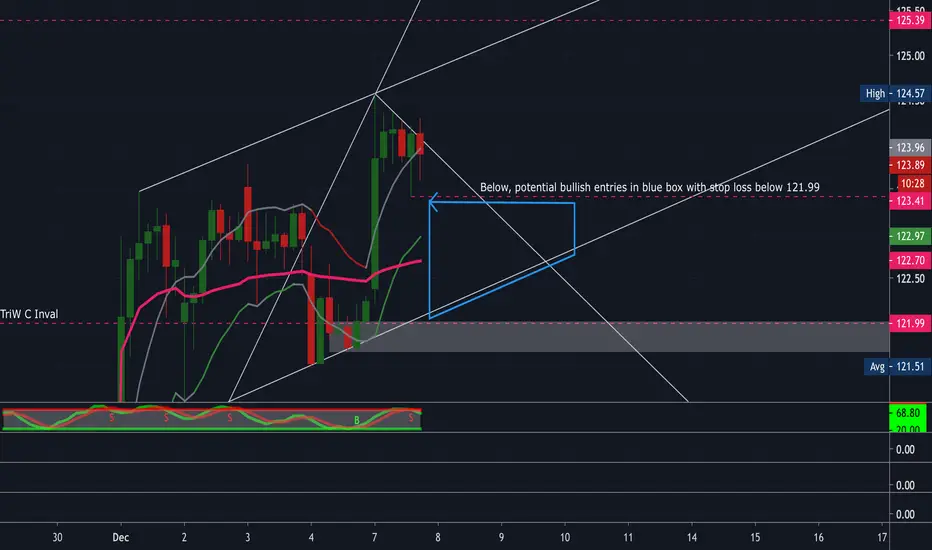
AAPL (smaller time frame)Please see AAPL chart posted before this one from few days ago*
Still holding small long position. Things I'm watching to adjust / add to my position:
1. Risky: potential small short scalp trade (I entered buy Jan 15 120 put / sold 117.50 put) for cost of $84; stop loss if break high of day of $124.57)
2. Price is consolidating just below the high of 124.57; if goes below $123.41, will watch to see if potential opportunity to add to bullish longs (and exit of small scalp trade above if able to generate a few bucks profit)
3. If below $122, will watch for support line in white to hold. My key low to invalidate adding to any more bullish longs is if price goes below $121.99.
This is just a small, maybe one or two day hold trade regarding my scalp.
Again, this is just a potential smaller time frame chart to watch. If, going off previous apple chart post, price stays above the TriW C wave of $121.99, I will lean bullish still and look to add another small bullish long if I can get in below $123.41, watching for break above $125 to maintain my longs.
Aaplshort
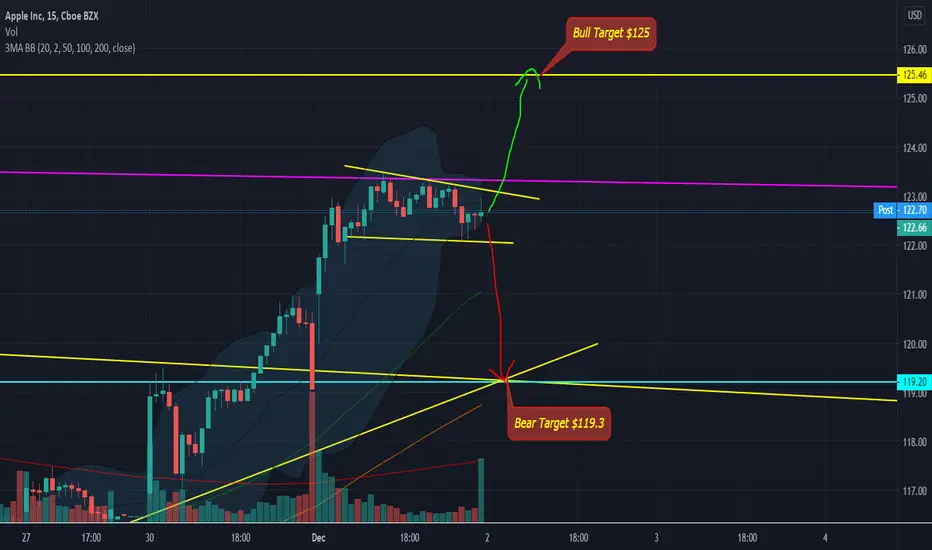
AAPL 12/7-12/18 Trade Plan-Bullish Trend on the Daily.
-Nearing the previous resistance @124.80-125.00 back from mid October
Short under AAPL breaking and holding under 120.75
PT @118.00-118.25
PT @116.75-117.00
Long over 122.15
PT @124.75-125.00
PT @126.60


AAPL 4h highly probable to be bullishAAPL in Nasdaq is going to be bullish due to bullish signs in volume - RSI - ADX - MACD and other classic indicators so we just need a confirmation from crossing the dynamic resistance from the trend

$AAPL - Bull Target $117 & Bear Target $110 - $107.5Break above blue resistance trendline then
Bull Target $117
Unable to break blue resistance trendline then
Bear Target $110 - $107.5

$AAPL - Bull Target $115.36-116.26 & Bear Target $112.8-$112Bull Target $115.36 - $116.26 (Double Bottom)
Bear Target $112.8 - $112 (Huge support)

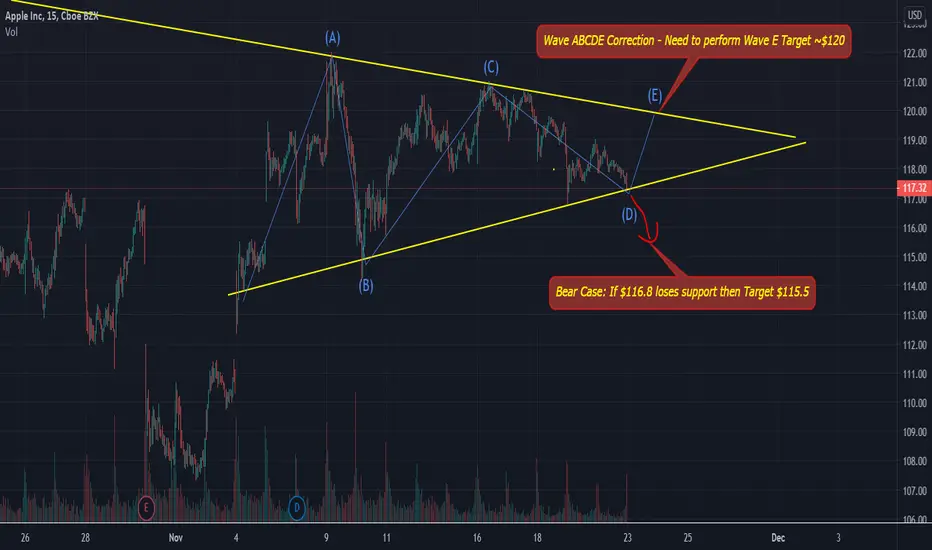
$AAPL - Bull Target ~$120 & Bear Target $115.5Wave ABCDE Correction - Need to perform Wave E Target ~$120
Bear Case: If $116.8 loses support then Target $115.5

$AAPL - Bull Target $125 & Bear Target $109 & below $100It's time to take a side.
It touched the major trendline and got rejected multiple times and failed to breakout the trendline will lead to go below $100.

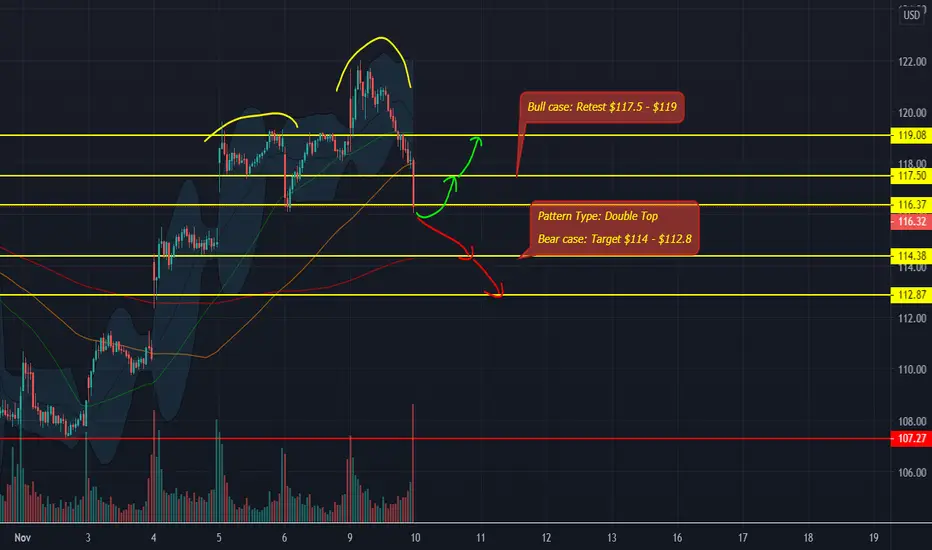
$AAPL - Bull Target $117.5 - $119 & Bear Target $114 - $112.8Bull Target Retest $117.5 - $119 & Bear Target $114 - $112.8
**UPDATE** $AAPLWe are breaking down AAPl while AAPL breaks down. It followed my prediction of a gap of and retest but was pulled under by $SPY. If we continue downtrend then I would expect to see it reach support by weeks end.

AAPL Moving towards resistanceApple is moving towards resistance where it going to meet the downwards trendline..waiting for the trendline break and price confirmation to go SHORT otherwise if it crossed resistance then it will act support to move LONG.

$AAPL - Incoming Massive Sell-off - Target $103 - $91Incoming Massive Sell-off. Below are the targets:
Target 1 - $103
Target 2 - $98.7
Target 3 - $91-$93


$AAPL - Bull Target $114.3-$116 & Bear Target $107Bull Case Target $114.3-$116
Bear Case: Bearish flag -Target $107
Suggestion: Sell before tomorrow market close
For Alerts, I charge 5-10% of your profits (I get money only if you get profits). DM me for details.

$AAPL - Bull Case $116.5 & Bear Case $113.75 or $112.2Bull Case: Double Bottom
Target $116.5
Bear Case: Bearish Flag
Target $113.7 or $112.2
For Alerts, I charge 5-10% of your profits (I get money only if you get profits in your pocket). DM me for details.
Good Luck

$AAPL - Bearish Flag Target $113.75-$112.2Bearish Flag Target $113.75-$112.2 (Possible Tmrw or End of Week)

AAPL can see new lows before the election & earnings $105 TARGETApple stock has been lagging compared to a lot of techs and it's influence on the Nasdaq market is pulling a lot of other stocks lower. We do have earnings coming up at the end of the month of October so that should be a very indicative sign of where this market wants to go.
The 100-day EMA is super attractive for institutional buying and price is not far away from it, we could see the price tag that area and then see it inch back up.
We have to wait for the election to pass to get a more decisive and concise move in either direction. There was a lot of downside volume at the beginning of the drop was strong but it's stalling out so it won't be a clear drop to $105 but slower.
Overall why we think this is moving to the downside is the most recent high at $125 was due to news that was sold off very easily. This is a much lower high than the $137 we saw post-split. This is indicative of weak buying trying to come into this market, if we see a lower low through $105, that confirms the downtrend.
The $105 level has to hold for the medium term longs to push through $125 and eventually into $135.
This trade idea is for educational purposes only, not to be used as investment or trading advice.

$AAPL - $119.3 or $112.75Bull Case: Retest $119.3
Bear Case: Break below $115.8
Target $112.75
I hold puts for this week.
Good Luck.


APPLE INC. SHORT📉 NASDAQ:AAPL SHORT H4
🛒SELL BELOW = 112.05
🎯Target1 = 108.5
🎯Target2 = 106.3
🎯Target3 = 102.7
🛑Stop loss or cancel trade = 117.8
🙈Recommended risk = (1%-2%)
