AAVE/USDT — Critical Demand Zone 135–120: Reversal Signal?AAVE/USDT (3D) is developing a highly interesting structure after delivering a strong rebound from the major demand zone at 135–120, an area that has historically served as a large accumulation region for institutional players since 2023.
The long downward wick — clearly a liquidity sweep — shows how the market wiped out stop-losses beneath the zone before snapping back upward. This kind of wick is rarely random; it often signals smart money accumulation exactly where retail traders panic.
Still, despite the sharp recovery toward 180–190, the broader market structure remains in a pattern of Lower Highs, which means the medium-term trend is still technically bearish. AAVE is now positioned at a major inflection point: Is this the beginning of a structural reversal, or only a temporary bounce before another leg down?
---
🔵 Bullish Scenario — Reversal Begins Above 205
The bullish case gains real validity only if price can break and close above the 195–205 resistance cluster on the 3D timeframe.
A decisive breakout here would mark the first Higher High in months and potentially flip the trend.
If the breakout holds, upside targets include:
Target 1: 265–305 (major supply zone)
Target 2: 380–400 (macro swing high)
Target 3: 440+ if DeFi momentum expands
Key bullish confirmations:
Increasing buy volume during the breakout
Strong 3D candle close above 205
A clean retest of 195–205 turning into support
If these align, a full trend reversal becomes increasingly probable.
---
🔴 Bearish Scenario — Breakdown Below 120
The bearish case becomes dominant if price fails to defend the 135–120 demand block and instead closes firmly below 120 on the 3D timeframe.
If that happens, the mid-term downtrend likely resumes with the following targets:
Target 1: 99–84
Target 2: 70 (previous liquidity sweep low)
Target 3: 62 if capitulation expands
This scenario would suggest that the prior liquidity sweep was not a reversal signal but rather preparation for a deeper markdown phase.
---
📌 Key Patterns & Structural Notes
Liquidity Sweep: The long wick beneath the demand zone signals wiped-out liquidity and possible institutional absorption.
135–120 Demand Block: A crucial accumulation area that currently serves as the final defense for buyers.
Lower High Structure: Trend remains bearish until 205+ is reclaimed.
Range Market: Price is currently oscillating within a broader 120–225 range; a breakout of either side will determine the next macro move.
---
🎯 Final Summary
AAVE is now at one of its most important decision zones of the past year.
Break above 205 → bullish trend shift
Break below 120 → bearish continuation and deeper lows
Until one of these triggers is activated, AAVE remains in accumulation/consolidation mode, preparing for its next major directional move. Swing traders typically wait for one of these confirmations before entering large positions.
---
#AAVE #AAVEUSDT #CryptoAnalysis #PriceAction #TechnicalAnalysis #SupplyDemand #LiquiditySweep #DeFi #Altcoins #CryptoMarket
Aaveusdt

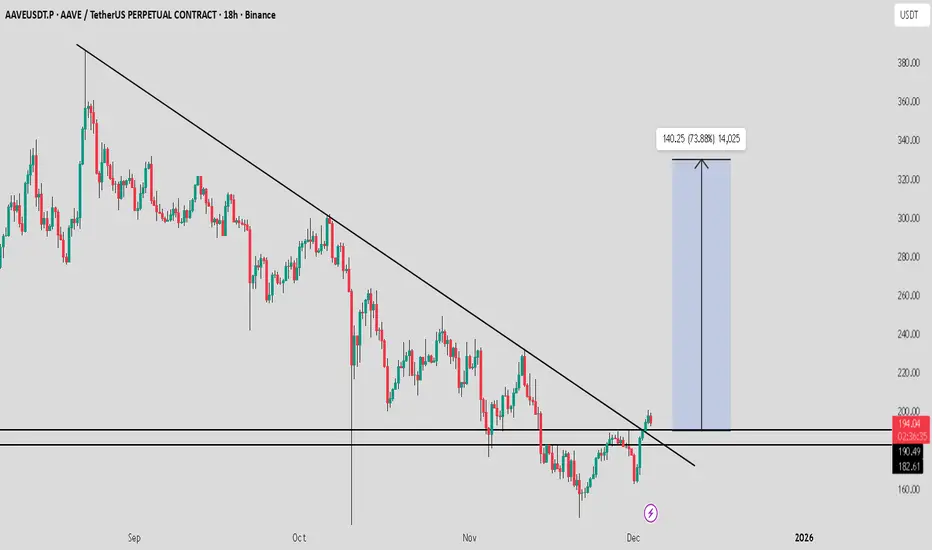
AAVE Holding Strong — Watching for Breakout Reaction Toward $250AAVE / USDT is holding strong above the marked horizontal levels. If price reacts with clear strength from this zone, it could offer a solid opportunity for a move towards $250–$320. Wait for clean confirmation before entering and manage risk wisely.
AAVE Update🚨📊 AAVE Update
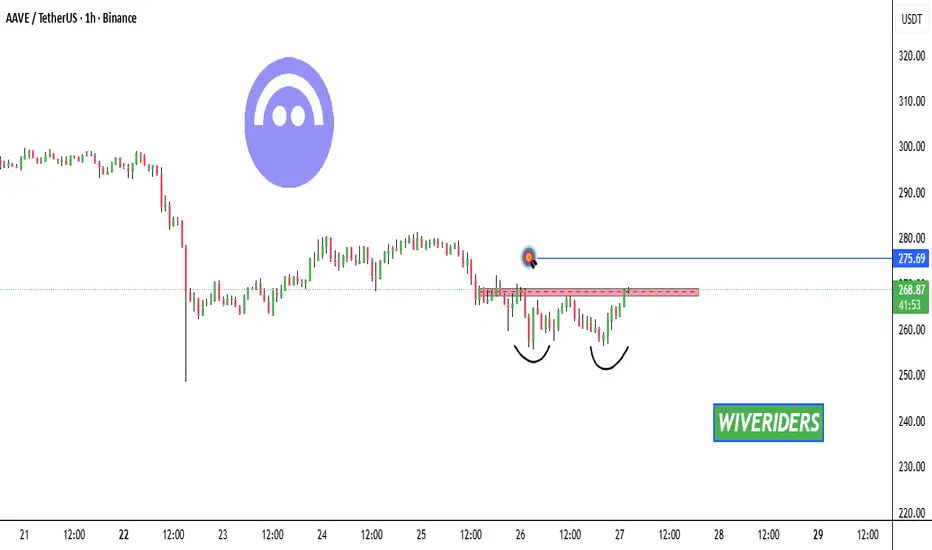
AAVE has formed a double bottom pattern,
which is normally a strong bullish reversal signal —
but we still have a red resistance zone 🔴
sitting right above the price.
This red zone is acting as a strong ceiling,
and price must break above it
for the double bottom to fully confirm and momentum to continue higher.
Until that breakout happens,
upside stays limited and sellers remain active at this zone.

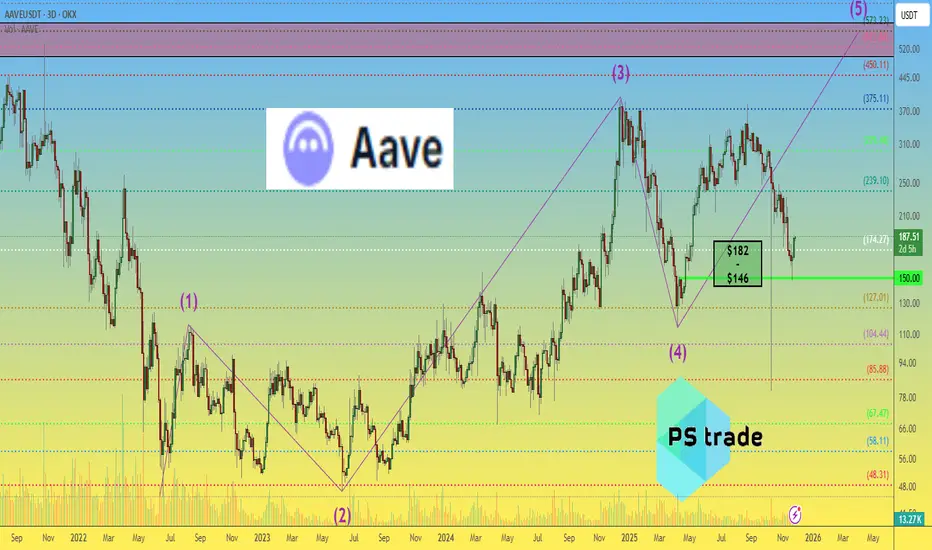
AAVE price analysisAfter nearly 5–6 months of waiting, CRYPTOCAP:AAVE has reached the $146 target, followed by a constructive rebound. The brief volatility spike on October 10–11 doesn’t change the broader structure.
From a fundamental perspective, CRYPTOCAP:AAVE remains one of the more robust DeFi assets. Price stability is notable considering the complete absence of ETF-related hype — which means any future catalyst could amplify the move.
If market conditions improve, OKX:AAVEUSDT has a reasonable probability of retesting the $500–600 ATH zone.
What’s your view: is CRYPTOCAP:AAVE preparing for a mid-term trend expansion or is the asset likely to stay in accumulation?
______________
◆ Follow us ❤️ for daily crypto insights & updates!
🚀 Don’t miss out on important market moves
🧠 DYOR | This is not financial advice, just thinking out loud
#AAVE Bears Ready For Further Downside | Must Watch For Bears Yello Paradisers! Are you watching what’s unfolding on #AAVEUSDT right now? Because if you’re not, this could catch you completely off guard. There’s a potential bearish breakdown brewing that could send #AAVE into much deeper territory. Let’s dive in before it's too late:
💎#AAVE has been trading inside a symmetrical triangle, caught between a descending resistance and ascending support. Each test of the upper boundary has been weaker, showing fading bullish momentum. Now, we’re pressing against the lower support line with sellers gaining control.
💎The current price is $222, and we’re right on the edge. A confirmed breakdown below the ascending support will flip the entire structure bearish. The 50 EMA is now acting as resistance, reinforcing this downward pressure and aligning with the broader setup.
💎If this bearish scenario confirms, the next downside target becomes the Support Zone around $195–180, but the real liquidity lies deeper. A sharp move could easily send #AAVEUSD into the Strong Demand Zone between $133–123, where we expect stronger buyers to finally show up.
💎However, this setup is invalidated if #AAVE breaks back above the Resistance Zone at $263. That would signal strength and likely trigger a fast bullish reversal targeting higher levels above $280.
Trade smart, Paradisers. This setup will reward only the disciplined.
MyCryptoParadise
iFeel the success🌴

AAVE/USDT – New Volume Box Activation🔹 AAVE/USDT – New Volume Box Activation
AAVE is forming a new volume box structure between $203 – $385, showing renewed momentum after the last low recovery. Price is currently stabilizing around the lower range with growing volume, suggesting early accumulation activity.
As long as AAVE holds above the $200 support zone, we follow for a possible continuation inside this box. The first target for structure development sits around $322, followed by $385 as the main breakout resistance level.
The setup remains active as long as the current momentum and volume stay consistent — confirmation on lower time frames will define the strength of the next move.

TradeCityPro | AAVE: Trendline Squeeze, Breakout Loading👋 Welcome to TradeCity Pro!
In this analysis, I want to review the AAVE coin for you—one of the lending projects in the Ethereum ecosystem, currently ranked 32 on CoinMarketCap with a market cap of $3.36 billion.
⏳ 4H Timeframe
On the 4-hour timeframe, this coin started a downtrend after being rejected from the 301.39 zone and, together with a descending trendline, has been moving downward.
✔️ Price has now reached it again, faked it once, and is still ranging around this trendline.
✨ If the trendline is broken and price holds above its trigger, it can begin an upward move.
⚡️ The trigger we have to confirm the start of this move is the 234.24 zone. With the break of this trigger, we can also use it to open a long position.
📊 The next resistance levels this coin has are 261.25 and 302.18, each of which can be used as the next trigger for a long position.
💥 For a short position, the main floor that has formed is 202.86. A break of this level will be a very good trigger for a short position.
📝 Final Thoughts
Stay calm, trade wisely, and let's capture the market's best opportunities!
This analysis reflects our opinions and is not financial advice.
Share your thoughts in the comments, and don’t forget to share this analysis with your friends! ❤️

AAVE/USDT;BUY LIMITHello friends
Given the price reaching the specified support and the strong support of the price by buyers in the specified range and the failure of the specified resistance, we can buy in steps with risk and capital management and move to the specified targets.
*Trade safely with us*

AAVE Update📊 CRYPTOCAP:AAVE Update
CRYPTOCAP:AAVE has successfully broken out of the red resistance zone 🔥
✅ First target reached — and now second target green line level also 🚀

AAVE Near Crucial Support, Setting Stage for 14% Bounce to 326$Hello✌️
Let’s analyze Aave’s price action both technically and fundamentally 📈.
🔍Fundamental analysis:
Aave’s next big update (V4) will make its markets more connected and efficient. If it succeeds like the last upgrade, AAVE’s value could move toward $326 again. 💧
📊Technical analysis:
BINANCE:AAVEUSDT is approaching a key monthly support area. If this zone holds, price could see a potential 14% rebound toward the 326 level, with confirmation coming from sustained buying momentum around support. 📊💎
📈Using My Analysis to Open Your Position:
You can use my fundamental and technical insights along with the chart. The red and green arrows on the left help you set entry, take-profit, and stop-loss levels, serving as clear signals for your trades.⚡️ Also, please review the TradingView disclaimer carefully.🛡
✨We put love into every post!
Your support inspires us 💛 Drop a comment we’d love to hear from you! Thanks, Mad Whale

AAVEUSDTBINANCE:AAVEUSDT is short term uptrend but in long tern have Triangle pattern for jump or dump. The price 297.40$ is key level for bullish trend so wait for break this level for buy.
🟢Resistance: 297 - 323 - 351 - 376
🔴Support: 270 - 252
⚠️Please control risk management.

AAVE is forming a bullish Double Bottom pattern📊 CRYPTOCAP:AAVE Market Update
CRYPTOCAP:AAVE is forming a bullish Double Bottom pattern ✅
It’s now testing the red resistance zone 🔴 — if it breaks out with confirmation, the first target will be the blue line level 🎯
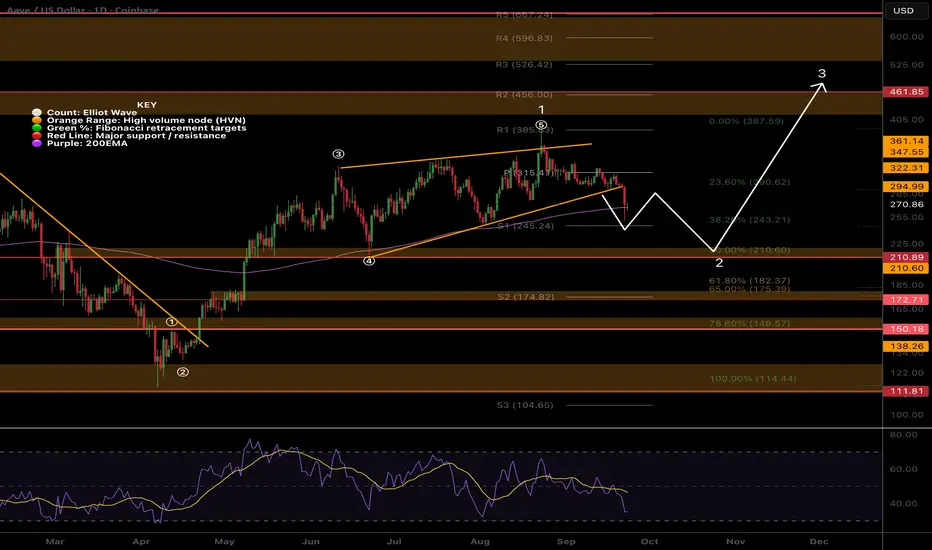
AAVE Breakdown from wave 5 wedge. Whats next?Local Analysis / Targets / Elliot Wave
CRYPTOCAP:AAVE broke down out of the wave (5) of 1 wedge per my previous analysis reaching the paths first target to find support the daily 200EMA and S1 pivot point. If price continues lower I expect it to bounce first before delivering a final thrust down in wave C of 2.
The major support High Volume Node, $210, is the target at the 0.5 Fibonacci retracement. Further breakdown brings up the golden pocket and S2 pivot, $175, and the alt-coin ‘golden pocket’ sits at $149 the 0.786 Fibonacci retracement. This is the most common area for alt-coin pull backs to terminate and a characteristic area for low volume, highly volatile assets in general due to the psychology as I discuss on my Fibonacci tutorial on YouTube.
RSI is making its way down into oversold but has plenty of room to fall with no bullish divergence yet.
Standard Deviation Band Analysis
Standard deviation bands are non-normally distributed unlike the renko chart shared in yesterdays report when time is removed. Price continues to spend way to much time at extremes with fast movement through the fait value zone. Bands are shifting significantly positive as time goes on due to price spending so much time in th eupper boundaries. This is a good sign of strength, dips remain shallow showing strong demand.
Price is testing the SD+2 threshold as support now and losing this would bring up the next target of the fair value regression line at $150 which adds confluence to the alt-coin ‘golden pocket’ targets in the technical analysis.
Safe trading
AAVE is forming a potential double bottom pattern📊 CRYPTOCAP:AAVE Market Update
CRYPTOCAP:AAVE is forming a potential double bottom pattern 🔄. If it breaks out of the red resistance zone 🔴, the first target will be the 🔵 blue line level 🎯.
AAVEUSDT – Quick Dip Play?Hi everyone! Today I’m eyeing a possible slight move down on AAVEUSDT. Plan is simple: tight stop-loss, risking just 0.5% of the account — no greed here.
On the 4H timeframe, EMAs are tightening, which often leads to a strong move in either direction. Fundamentally, the bias still leans bullish after yesterday’s news, but we might get a small dip first before any pump.
Risk is balanced — more of a 50/50 setup — so discipline is key. Let’s see how it plays out. Good luck! 🍀

AAVE has formed a bullish double bottom📊 CRYPTOCAP:AAVE Market Update
CRYPTOCAP:AAVE has formed a bullish double bottom 📈
👉 If it breaks out the red resistance zone 🔴, the first target will be the green line level 🎯

AAVE/USD - Bearish OutlookBINANCE:AAVEUSDT AAVE/USD - Looking for strong bearish around Trendline and Resistance Zone.
Fundamental Update :
Decentralized liquidity protocol Aave announced it had surpassed $60 billion in net deposits, scammers launched a phishing campaign targeting its users through Google Ads, according to security researchers.
Support by Likes and Comments.
Thank you.

AAVE has formed a bearish Head & Shoulders pattern 📊 CRYPTOCAP:AAVE Market Update
CRYPTOCAP:AAVE has formed a bearish Head & Shoulders pattern 🦅
👉 Price already broke down the black neckline ⚠️
👉 Until $310 is broken to the upside, AAVE is not bullish yet.
⚡ Stay cautious — manage risk before entering.

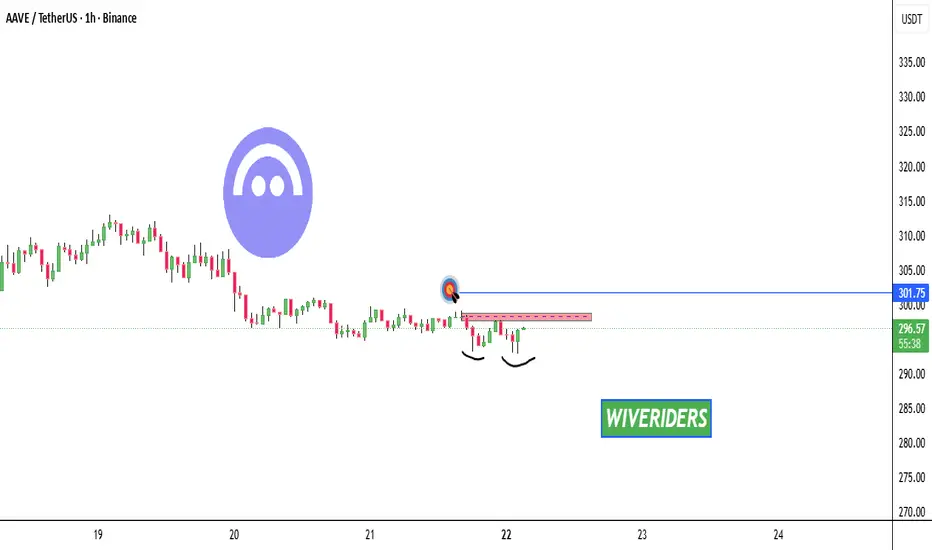
AAVEUSDT TRADE IDEA.AAVEUSDT (15m) Chart Analysis
Market Context
Price has recently reacted from the 310$ resistance area and is now pulling back.
A Break of Structure (BOS) has been marked earlier, showing bullish intent, but price is now retracing.
Key Zones
POI (Point of Interest): Between 300 – 302$
This zone is aligned with an Order Block (OB) and a Fair Value Gap (FVG).
Strong confluence for a possible bullish reaction.
Support: 298$ zone (last demand level).
Resistance: 310$ (previous high).
Possible Scenarios
✅ If price taps into the OB + FVG zone (300 – 302$) and shows bullish confirmation, a bounce towards 310 – 312$ can be expected.
⚠️ If price breaks below 298$, bearish pressure may increase, invalidating the setup.
📌 Summary for Free Channel:
AAVE is currently in a retracement phase. The 300 – 302$ zone is the critical demand area (OB + FVG + POI). If bullish confirmation comes here, we may see another push to 310$+.

AAVE 4H Analysis | Key Triggers Ahead💀 Hey , how's it going ? Come over here — Satoshi got something for you !
⏰ We’re analyzing AAVE on the 4-Hour timeframe timeframe .
👀 On the 4-hour timeframe of AAVE, we can see that after breaking the trendline, its volume increased and it moved toward the $361 resistance, then entered a corrective trend. Currently, this coin is ranging inside a triangle consolidation, and the volume has dropped significantly.
⚙️ The RSI fluctuation of this coin is still below the 50 zone, and two key levels have been considered for its movement: 55.15 and 37.89. If the RSI passes beyond these levels, this coin can experience another movement leg.
🕯 The size and volume of the candles have decreased, with the red candles being bigger and more numerous than the green ones. This could be a sign of the end of selling pressure or the beginning of a new wave of selling pressure. The coin is in a very important area, and with today’s news it may move upward and end this corrective trend.
💰 On the 4-hour timeframe of the trading pair AAVEBTC, after a strong rally against Bitcoin, this coin is now in a triangle consolidation and the volume has dropped. A significant amount of this coin has been sold and converted to Bitcoin (buyer makers of Bitcoin). A ceiling and floor have also been formed as our alarm zones, where price action in these areas can help us make the best decision for this trading pair.
🔔 The alarm zone for this coin is considered at $323 for a long trade and $301 for a short trade. Today, this coin recorded a historic milestone in DeFi, and with the breakout and confirmation of the marked trendline and the activation of triggers, it can experience good growth. 🚀
❤️ Disclaimer : This analysis is purely based on my personal opinion and I only trade if the stated triggers are activated .

Is AAVE About to Explode Above or Collapse? Key Levels to WatchYello Paradisers! Is #AAVE quietly prepping for a major breakout… or is this just another setup to wipe out the impatient bulls before the real move begins?
💎#AAVEUSDT is moving in a textbook ascending channel, respecting both trendline resistance and support beautifully. The structure is clean, but deceptive. While many may assume this is an easy path higher, seasoned traders know better — especially with what’s happening near the critical resistance zone.
💎The red resistance zone ($270–$280) that was previously a major support during the last cycle is now acting as heavy resistance again. #AAVEUSD is currently battling this zone after several failed attempts to break through. But the structure still leans bullish as long as we stay within the ascending channel.
💎Both the 50 & 200 EMA are now acting as dynamic support. This is key — if the price remains above these EMAs and the lower channel boundary, momentum favors the bulls. A decisive breakout above $280 could trigger a parabolic rally toward the $375–$410 range, a level where serious resistance and profit-taking are expected.
💎However… if bulls get lazy and we see a strong breakdown below the ascending channel, especially below $237, the setup gets shaky fast. A complete invalidation of the bullish case occurs if AAVE loses $209 — from there, expect a breakdown structure to unfold with a likely test of much lower levels and a possible retest of the $150 zone.
Trade smart, Paradisers. This setup will reward only the disciplined.
MyCryptoParadise
iFeel the success🌴

AAVE Ending Diagonal?We have some more clarity with the local AAVE pattern and it does appear to be an Elliot wave ending diagonal. After a strong wave 3 ending diagonals form as a terminal pattern with a thrust above the trend line threshold and drop back down to complete a higher degree motif wave 1.
The following retracement has a high probability of terminating at the wave 4 bottom which in this case is at the High Volume Node support and 0.5 Fibonacci retracement at $210.
RSI has printed a series of bearish divergence from overbought but this took a long time to play out!
Analysis is invalidated if price breaks above $400.
Safe trading

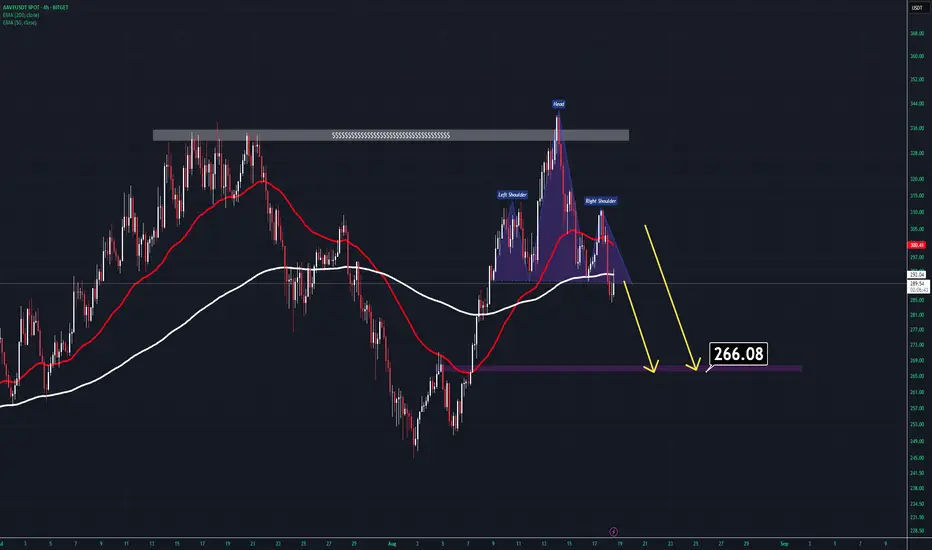
AAVE ANALYSIS (4H)After grabbing the upper liquidity pool, AAVE has shifted into a bearish structure.
Currently, the price is trading below both the 50 EMA and the 200 EMA.
Additionally, we can clearly identify a textbook Head & Shoulders pattern on the chart.
With these confirmations, AAVE remains bearish, and the downside target should be around $270 – $266.
Thanks for reading.