Massive Structure on ADBEToday we will take a look at the current situation on ADBE.
Key concepts:
a) Flag Pattern: This type of formation is considered a continuation pattern, meaning that after the breakout, we tend to observe a movement in the same direction as the previous impulse
b)Ascending Structure: using two trendlines, we can understand the upper and lower bands of any trend; when we have a breakout on any of the directions, we can use that to forecast possible movements on the breakout direction
c)Fibo Extensions: We use them to forecast possible targets on a new impulse
Final Conclusion: We have an activation level on the green line and an invalidation level on the red line; the final target is the 2nd fibo extension, and we will use the first one as a risk-free level.
Thanks for reading!
ADBE

ADBE: Another System-Based ShortI've developed a bearish algorithm/screener that screens for stocks with identified selling pressure / trend followed by a dead cat bounce that is likely to fail - which we will attempt to short. I'm trying to combine trend following and VFI trading principles for the coming bear market.
Components:
1. 200 EMA: below current market price (this is so we don't get stuck in short squeezes and such)
2. 50 day moving average above current market price (we want past clearly identified weakness over a sufficiently long period)
3. 10 day moving average below current price (we want a stock that has attempted to rally from the lows)
4. CMF<-0.1 (we want to screen out bottoming patterns such as Inverse Head and Shoulders whenever we can)
5. Moving Averages Ratings: Buy, Neutral, Sell - we don't anything with strong MA momentum indicators, and we don't want to be short squeezed.
6. Market Cap, Price, volume requirements

ADBE (NASDAQ) - Continue BullishGreetings
Humbled, we would like to thanks for your support who has already liked, commented and followed us. Your support, strengthens us, to help in analyzing the market. If you have any questions, feel free to send us message (inbox).
Pra Trading :
- Please care for Money Management
- Have a good psychology
- Do not be hurry to open position and do not do nothing if u see opportunity
- Evaluate and upgrade your trading plan
Execution Strategy :
- Know what you want to buy, see the Fundamental
- Decide that you are on investing or speculating
- Consider what your strategy based on Investing/Speculating
- Make Road Map Of Your Trading Plan
- Decide
a. Entry strategy
b. Cut loss
c. Target of Profit
Post Trading :
a. Do not be sad if you loss or do not be very happy if you win
b. Just become a normal without emotion, Do not put emotion into your trading
c. Evaluate your trading
d. Keep on Learning
e. Be Humble
Idea :
ADBE (NASDAQ) - Continue Bullish

ADBE Further Downside?Looking at a triple top for ADBE in day view, followed by a breakdown below both the 20 and 200 day MA. Looks to have found support at 420, but hit the top of the downward trend line and is sitting at a previously established support level around 445. If ADBE fails to break up and follows the downward trend line, it will be forced to retest 420. If it fails and breaks down, the next support is at 385 and is weak, with the next strong support being around 320 from all the way back in April '20. If 420 fails, there is a probable 5% downside and possible 13%, if not more.
The RSI is showing weakness, while the Stoch, MACD, and Madrid sentiment are all beginning to do the same. I will be watching for a potential short opportunity in the next few days.
Many other charts, including TSLA, AMZN, NFLX, PYPL, NVDA, AAPL, PDD, ASML, are all showing similar weakness (the largest caps on the IXIC), while INTC is failing to break up through its most recent resistance. CMCSA, another large cap IXIC, appears to be strong but showing overbought on the RSI and Stoch.
Buckle up, it could be a rough week.


Long ADBE trigger & PTsADBE had a bit of a selloff on Friday. Here are the levels I'm watching for ADBE for next week.
#RedDevilTrades

$ADBE basing for another move higherAfter basing for the past 6 months, it looks ready to go north yet again.

ADBE reached our targetFinally, $ADBE reached our target, I am expecting the market to be volatile in the coming days so this one can cool off, however, the long term view on $ADBE remains bullish

ADBE entry LEVELS LONGADBE is waiting for the next movement. Let's see if we hold UPTREND. You can BUY with a breakthrough, but it is pretty risky. Better to wait and start BUYing around $452. If we go lower next SUPPORT is $438.
LEVELS LONG:
$452
$438
$425 - STRONG BUY
$417 - STRONG BUY

ADBE Preparing to Breakout off RetracementNASDAQ:ADBE FWB:ADB NASDAQ:ADBE
ADBE is completing the retracement wave - symetri triangle.
Long upon breakout for next impulsive wave.

$ADBE short term target 490ishRegardless $ADBE can break the consolidating pattern soon or not the short term momentum is up and 490 should be reached in the coming days. $ADBE is a long-term bullish scenario.

ADBE - Follow up - Getting ready to rallyOn my previous post a few days ago, I highlighted this orange zone from which a bounce is highly likely if the primary count is correct.
Today we are seeing it go up with other mega caps.
Right now it look like it's making a 5 wave advance which would be a great bullish sign but we only have 3 waves up for now.
I already have a position here but I will look to add to it if we get 5 waves up followed by a correction lower which needs to remain above 453.2 !

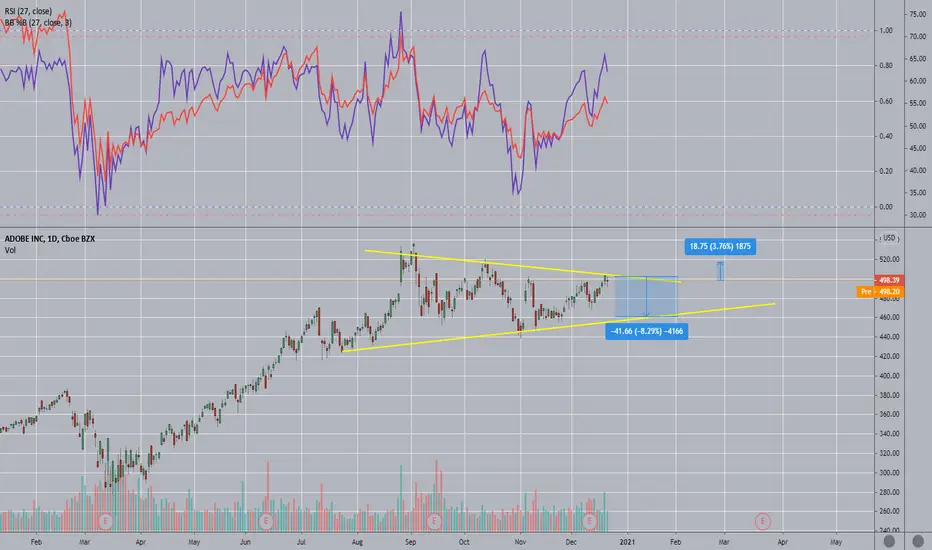
Adobe shares nearing good buying levelsShares of Adobe (NYSE:ADBE) have pulled back nicely to the support level of a descending triangle. The share is also now within 3% of its 200MA. I will be keeping a close eye on the share in the coming days for a long term buying opportunity. This is a strong technology company with good prospects and prices are now at August 2020 levels.
Im looking at a price target of around $530 (17%) and a stop at the $425 level, given a conservative risk reward ratio of 2.2. Other supporting indicators are the MACD and RSI which both support the position that the stock is reaching oversold territory.

ADBE short with LONG entry levelsADBE just broke the support around $463, and we are heading to another support around $438. This could be a good entry-level for long positions. The area from $417 to $438 is a big support zone.
ADOBE INC is a strong company with a strong base of customers. The perfect subscription model with a monthly fee and irreplaceable software that is used worldwide guarantees stable profits.
Entry levels LONG positions:
$438
$423
$417 - STRONG BUY

ADBE BUY OR LONG , TARGET $540+ADBE confirmed a pattern "Wedge Falling" , i opened Long (Buy) here :
ADBE buy : $488
ADBE target : $540+
Stop loss : $460 or 6% .
Wish you a good deal!

ADBE - 2 way this could play outWe have 2 possiblities here.
Either we are in a complex WXY correction which would then take price towards 415 i n a corrective fashion similar to the dotted line drawing.
or
we are finishing a Flat corrective wave 2 pattern in which case price should remain above the invalidation level at 439 .
The usual termination point for wave (C) of a Flat pattern is the 100% and 127.2% projection of wave (A) from (B) but the 127.2% level would be below the invalidation level, therefore we can discard it for this setup.
100% level comes at 451, which is also the 78.6% retracement level of wave 1, known also as the last line of defense for bulls.
So, price needs to ideally remain above that level if we are to see higher prices.
Note also that any move above 505 even before touching the 451 level should be considered as a big bullish indication!

Bullish Flag $ADBEAlmost the same analysis as $SOLO but different sector and industry.
Bullish flag on ADBE. Already had the volume spike on daily and also had the WMA crossover on hourly. Short put verticals at strikes 470/460 for 01/08 expiry

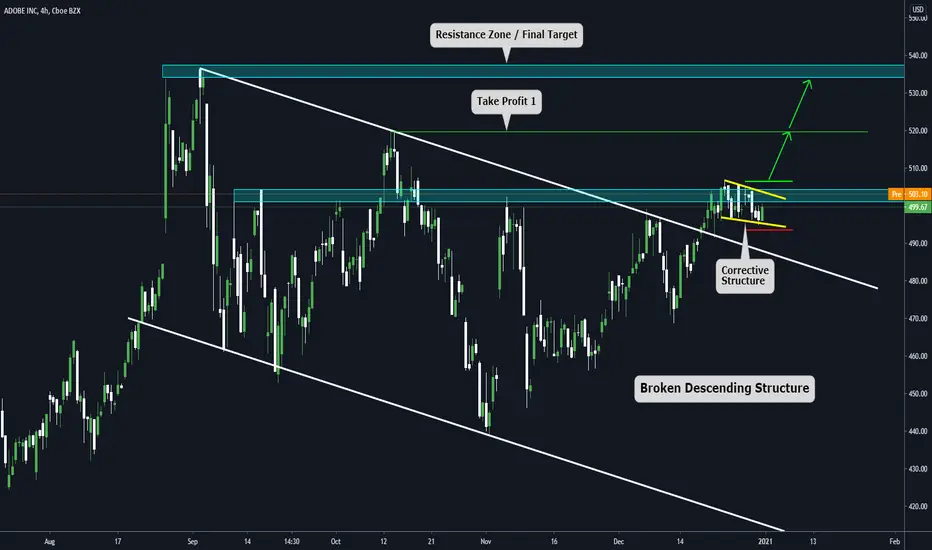
Short term opportunity on ADBE Today, we will show a bullish setup we have seen on ADBE.
a) The price has broken a major Descending structure
b) Now it's above a resistance zone
c) We can see a corrective structure on the mentioned resistance zone
d) If we have a breakout on the Green line, we will consider the analysis active / The same scenario for the red line (Invalidation of the analysis)
e) The TP1 area can be used to close the setup or move the stop loss to break-even (that is what we will do)
f) We are aiming for a final target at 533.10
g) This setup can provide a Risk Reward Ratio above 2
h) We expect a resolution between 10 to 20 days

$adbe short short opportunityshort here or at 499.11 take profit at 463.7 and stop loss 515.77; 8% profit 3.5% risk

ADBE eyes on 500THis is a great growth name in the tech industry. certainly, one to keep an eye on once we get closer to 500 and some more consolidation.

Holding into earnings Even though we were burned on Salesforce we will roll the dice again with holding our ADBE position
