Alice

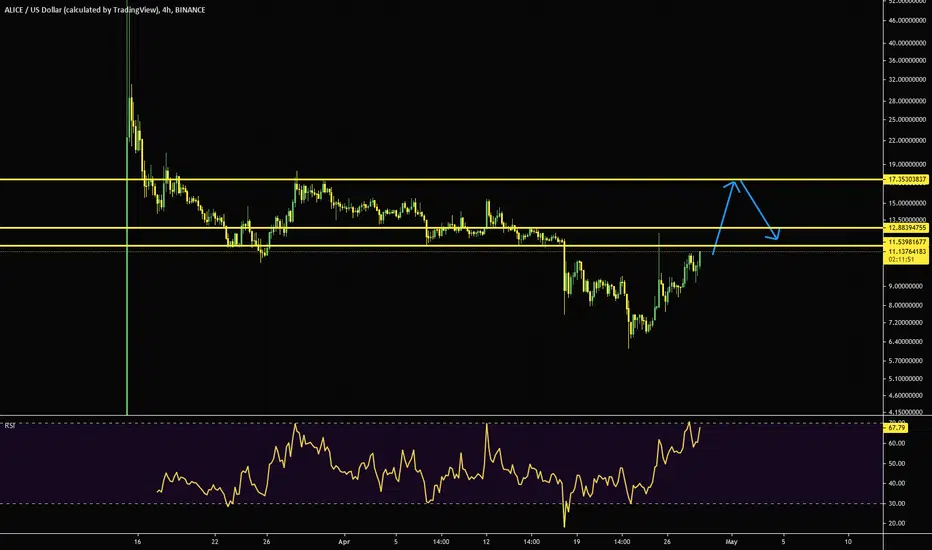
ALICEUSDT Bullish Projection Still valid After BreakoutHaving confirmed the breakout from the previous bearish trend and the market currently on a reasonably dependable support zone, ALICE is still expected to continue going long even after the initial spike observed yesterday. See the chart for projected direction of the market.

ALICEUSDT Trend BreakoutAlice gaining traction and more popularity as a result of the spike seen earlier today. Unfortunately, we didn't spot this breakout on time. However, I expect to see the rally to continue in the next few hours or days. Good luck!

$ALICE/USDT 90m (Binance Futures) Falling wedge breakoutMyNeighborAlice seems to be ready for another big move up after that bullish breakout!
Current Price= 12.365
Buy Entry = 12.272 - 11.970
Take Profit= 13.296 | 14.437 | 16.604
Stop Loss= 11.336
Risk/Reward= 1:1.5 | 1:2.95 | 1:5.71
Expected Profit= +29.07% | +57.33% | +110.97%
Possible Loss= -19.44%
Fib. Retracement= 0.5 | 0.786 | 1.272
Margin Leverage= 3x
Estimated Gain-time= 10 days


ALICE is a good NFT play to go back above $14+Bithumb has finished its listing pump and dump. Now it is time for the Koreans to buy it all back up. Kimchi premiums please.
ALICEUSDT BULLISH SETUP CONFIRMED If there is any coin I will want to buy today, it will be ALICE. After a breakout from the long term downtrend was confirmed earlier, the market has retraced to the next support zone. So I expect the bulls to take the ride any moment from now. Good luck!

ALICEUSDT 4H long setup; Retest of broken desc parallel channelTA explained
ALICE broke out of the descending parallel channel. Currently in a pullback. A retest of the W-neckline can be expected and the entry zone is positioned between the 0.5 and 0.786 fib levels of the latest impulsive move.
Trade setup
Best entries: 12.910 - 13.758
TP1: 15.181
TP2: 17.477
TP3: 20.645
SL: 12.023
RR: 5.61
Max leverage: 2x
—————
Do Your Own Research (of course)
Trade at own risk (of course)
Only trade what you can afford to lose (of course)

ALICEUSDT [H4] Wait untill breakout 🚀🚀ALICEUSDT Wait untill breakout 🚀🚀
Now ALICE is Wedge Pattern and wait untill breakout that is best entry Buy
Follow Focast Every Week On My Youtube Channel
Goodluck
Ton Trader
🙏🙏🙏🙏🙏🙏


Bullish Reversal (Head & Shoulders) For CHRUSD (Chromia)A Head & Shoulders is starting to play out on 4H TF on CHRUSD. The H&S pattern is yet to be validated when price closes above the neckline.
Head& Shoulders are one of the most profitable patterns in markets!
Chromia has a relatively small market cap of $170 million at the time of writing.
Technical insight:
On the Daily TF you can see the big move was accompanied with big volume .
CHR is getting attention of bulls, however price is currently testing somewhat resistance.
Resistance looks weak comparing it with the pump:
Good pump with good volume. Looking at the overall volume in this market, the majority is buying despite the recent big drop.
Small Fundamental insight:
Chromia is a blockchain for building dApps & to create NFTs.
Blockchains with support for NFT development have been exploding recent weeks, now they're consolidating, which is a good sign.
Maybe you know the token ALICE ?
The token got listed on Binance and skyrocketed 25.000% (!) on its listing which created alot of attention around this token.
The reason I mention ALICE is that it is built using the Chromia platform.
It is a multiplayer blockchain builder game, where anyone can buy and own virtual islands and collect exciting items in the form of NFTs.
ALICE has a market cap of $270 million at the time of writing and I see Chromia growing towards that direction, which would be an increase of around 58%.
Feel free to add any suggestions/feedback!


🔥 ALICE Triangle Break OutAfter a tumultuous first week after listing, where ALICE saw huge volatility, it appears that ALICE is slowly recovering and making its way up.
on the chart I've found a clear triangle which the price has been following. Since this morning, ALICE appears to have broken out from this triangle, potentially starting a new bullish period.
Since the volatility for this coin has been huge in the recent past, I'm expecting a lot of strong gains for this asset, assuming the new bull-run will start. We might target $30 or so.
Happy trading!


alice/usdt bulishin my idea
1 trad line broken
2 if pullback is down and macd upper than 0
3 ema 10 broken the ema 20
the alice can go to tp1

ALICEBUSD (ALICE) - BULLISH SETUP ANALYSIS 🔎
- ALICEBUSD brokeout above the double bottom (DB) neckline resistance (NR).
- The market hit a swing high and retraced.
- Price is retesting the neckline resistance (NR) and key fibonacci retracement zone (0.5 - 0.618 - 0.786).
- There is a relatively high concentration of buyers at the retest zone (High buying pressure).
- The retracement is resisted by the descending trendline resistance (DTR).
- A breakout above the descending trendline resistance (DTR) could be a bullish signal.
BUY ENTRY ⬆️
- Breakout above the descending trendline resistance (DTR).
TARGETS 🎯
- Horizontal resistance level (R1).
- Horizontal resistance level (R2).
- Horizontal resistance level (R3).
- Fibonacci extension levels.
SETUP INVALIDATION ❌
- Breakdown below the 0.786 fibonacci retracement level.


ALICEBUSD (ALICE) - POTENTIAL BUY ENTRY ANALYSIS 🔎
- ALICEBUSD brokeout above the double bottom (DB) neckline resistance (NR).
- The market hit a swing high and retraced.
- Price is retesting the neckline resistance (NR) and key fibonacci retracement zone (0.5 - 0.618 - 0.786).
- There is a relatively high concentration of buyers at the retest zone (High buying pressure).
- The retracement is resisted by the descending trendline resistance (DTR).
- A breakout above the descending trendline resistance (DTR) could be a bullish signal.
BUY ENTRY ⬆️
- Breakout above the descending trendline resistance (DTR) and the horizontal resistance level (R1).
TARGETS 🎯
- Horizontal resistance level (R2).
- Horizontal resistance level (R3).
- Fibonacci extension levels.
SETUP INVALIDATION ❌
- Breakdown below the 0.786 fibonacci retracement level.
