Gold is finishing at a high level to resist the fall! The bullis
📌 Driving events
U.S. President Trump said on Monday that he was exploring the possibility of temporarily exempting tariffs on imported cars and parts to give auto companies more time to establish production bases in the United States.
New York Fed: The unemployment rate is expected to rise to the highest level since April 2020 in March. In March, households were more pessimistic about employment and future income. The expected inflation rate for the next five years is 2.9%, down from 3% in February.
Geopolitical situation:
It was learned on the 14th local time that Israeli officials said that Israel and the Palestinian Islamic Resistance Movement (Hamas) still have great differences on the ceasefire in Gaza. The official said that compared with the previous negotiating position, Hamas seems willing to release more Israeli detainees, but if Hamas insists on requiring all parties to guarantee that Israel must stop waging war in the Gaza Strip after the ceasefire, it will still be difficult to promote an agreement. The official expects Hamas to respond to the new ceasefire proposal in the next few days.
📊Comment Analysis
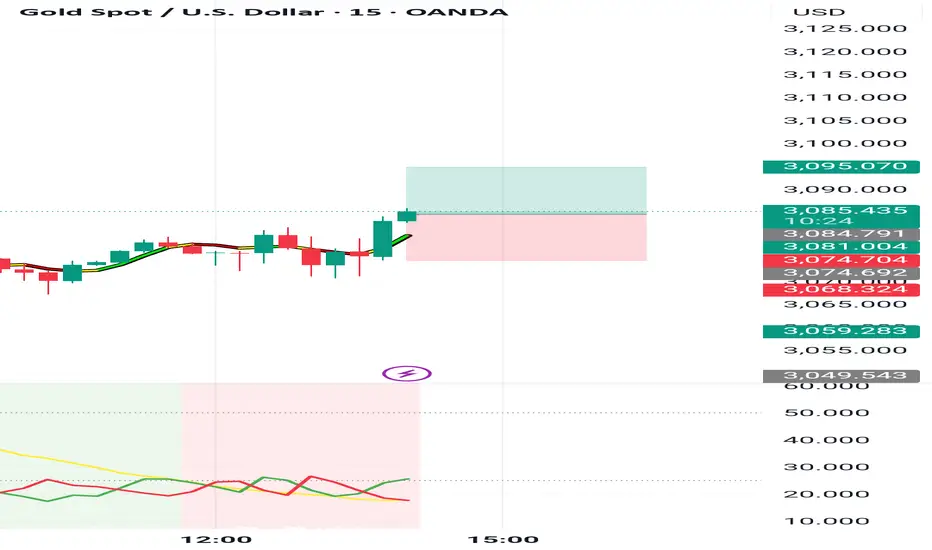
The hourly level shows that the short-term gold price has fallen from a high level and gradually fell into a narrow range above the hourly 60-day moving average support level. The current hourly level indicators are narrowing, maintaining a short-term shock guide reference. The 5-day moving average and the 10-day moving average at the four-hour level are arranged in a downward cross, maintaining the four-hour level peak signal. The short-term decline gradually brings about the four-hour RSI mean reversion, forming a four-hour level adjustment trend. The gold price has risen and fallen to maintain a shock downward trend, which has not changed the medium- and long-term upward trend. Be cautious to maintain a bullish shock trading strategy during the day.
💰Strategy package
Long order:
Aggressive participation at 3185-3195, profit target above 3210
Steady participation at 3175-3185, profit target above 3195
Short order:
Aggressive participation at 3250, profit target below 3230
⭐️Note: Labaron hopes that traders can properly manage their capital
- Choose the number of lots that matches your capital
- Profit equals 4-7% of the capital account
- Stop loss equals 1-3% of the capital account
Analyse

Bitcoin BTCUSDT – 4H Technical Analysis
Bitcoin is currently approaching a key downtrend resistance line that has been respected several times since early February. The price action suggests a potential rejection from this level, which could lead to a move toward the lower boundary of the broader descending channel.
🔹 Bearish Scenario: If the resistance holds, we may see a continuation of the downtrend with possible targets near the $71K– FWB:73K region.
🔹 Bullish Invalidator: A confirmed breakout above the trendline would invalidate the bearish setup and could signal a shift in market structure.
⚠️ Watch price action closely around this level for potential rejection or breakout confirmation.

XAUUSD Weekly Forecast: Probable Price Range and Trade PlanAs of April 12, 2025, gold (XAU/USD) has experienced significant volatility, reaching record highs amid global economic uncertainties. Here's an analysis based on the latest data:
📅 Economic Calendar Highlights (April 2025)
Key upcoming events that could influence gold prices include:
April 15: U.S. Consumer Price Index (CPI) release
April 17: U.S. Initial Jobless Claims
April 18: University of Michigan Consumer Sentiment Index
📈 XAU/USD Technical Overview
Trend & Momentum: Current Price: Approximately $3,236.21 per ounce.
Trend: Strong uptrend, with prices surging past the critical $3,200 mark.
RSI (14): 64.826 – approaching overbought territory, suggesting strong buying pressure.
MACD (12,26): Positive value of 21.21 – indicating bullish momentum.
ADX (14): 33.482 – confirming a strong trend.
Moving Averages: All major moving averages (MA5 to MA200) are signaling a 'Buy,' reinforcing the bullish outlook.
Support & Resistance Levels:
Immediate Resistance: $3,245.69 – recent intraday high.
Next Resistance Target: $3,300 – as projected by analysts amid ongoing market dynamics.
Immediate Support: $3,174.14 – recent intraday low.
Key Support Levels: $3,048 and $2,953 – potential pullback zones if a correction occurs.
Candlestick Patterns:
A “shooting star” pattern has emerged, which may signal a short-term reversal or consolidation phase.
Price Projection for April 14–18, 2025
Considering the current technical indicators and market conditions:
Projected Minimum Price: $3,180 – accounting for potential short-term corrections.
Projected Maximum Price: $3,280 – if bullish momentum continues without significant resistance.

XAU/USD(20250411) Today's AnalysisMarket news:
The annual rate of the US CPI in March was 2.4%, a six-month low, lower than the market expectation of 2.6%. The market almost fully priced in the Fed's interest rate cut in June. Trump said inflation has fallen.
Technical analysis:
Today's buying and selling boundaries:
3141.00
Support and resistance levels:
3244
3206
3180
3101
3075
3037
Trading strategy:
If the price breaks through 3180, consider buying, the first target price is 3206
If the price breaks through 3141, consider selling, the first target price is 3101

Risk aversion continues to escalate, go long after gold retreats
Gold has two effective support positions. The first one is near 3048, and gold rises rapidly after hitting the bottom of 3048. The second one is near 3070. If gold does not break through 3070, it will continue its strong bull market. If gold falls back near 3048, then gold may start to maintain a large range of shocks.
Trading idea: Go long near gold 3070, stop loss 3060, target 3100

After a brief rebound, gold continues to be short-sellingThe gold 1-hour moving average is still in a downward dead cross short arrangement, and the gold short strength is still there. The gold moving average resistance has now moved down to around 3002. After gold fell below 3000, gold accelerated its decline again, indicating that gold is still at an important level around 3000. The volatility of gold has only increased recently, so don't think that the market has reversed because it seems to have rebounded a lot. The recent fluctuations of tens of dollars in the gold market are normal.
Trading ideas: short gold around 3000, stop loss 3010, target 2970

Gold is still weak, rebound can still be shortedThe 1-hour moving average of gold still continues to cross downwards, and the strength of gold shorts has not weakened; gold rebounds are still mainly short selling. Although gold rose after covering the gap for one hour, the upper shadow line soon fell. Gold is still weak overall, and gold is under pressure near 3050 in the short term.
Trading idea: short gold near 3042, stop loss 3052, target 3022
The above is purely a sharing of personal opinions and does not constitute trading advice. Investments are risky and you are responsible for your profits and losses.

Gold continues to fall, what will happen next week?After the gold price fluctuated sharply at the high level in the past two days, gold finally broke down on Friday. In fact, the market was too active in the past two days, and the overall volatility was very large. In fact, it was still a little difficult to trade. Although the overall outlook is bearish, the rebound amplitude is actually not small each time. Now sometimes it rebounds more than 20 US dollars in a few minutes, so it may continue to fall after a loss. Now that the gold daily high is covered by dark clouds, how should we trade next week?
The gold 1-hour moving average has formed a death cross downward, so the gold shorts still have power, and the short-term gold can only rebound. After the rebound, the shorts will continue, and then the gold will enter a shock. After the high-level plunge of gold, the shorts will be more dominant in the short term. Unless there is a big positive news, it is difficult for gold to rise directly. The resistance for gold's rebound is 3076. If it is under pressure, then gold's rebound will mainly continue to be short on highs.

Today, the short gold position has made a profit of 15 pointsGold's 1-hour moving average continues to show signs of turning downward. If gold once forms a dead cross downward in 1 hour, then gold shorts will have an advantage. The 1-hour downward trend line of gold also suppresses gold's rebound. Gold can still continue to short on the rebound. The gold trend suppression is now down to around 3108

How will gold perform after the super rollercoaster market?Gold's 1-hour moving average still shows signs of turning downwards. Although gold bulls have made a strong counterattack, it is also because of the risk-aversion news that stimulated a retaliatory rebound. However, gold continued to fall after rising, and gold began to return to volatility. In the short term, gold is supported near 3100. If gold falls below the support near 3100 again, then gold shorts will still have an advantage in this war. Overall, the impact of today’s non-agricultural data is expected to be dim. What is more important is the stimulation of the news. However, it may be noted that if gold holds the 3100 mark for a long time, then gold is expected to fluctuate upward above 3100.
Trading idea: short gold near 3115, stop loss 3125, target 3100
The above is purely a sharing of personal views and does not constitute trading advice. Investments are risky and you are responsible for your profits and losses.

Gold is under dark clouds, waiting for opportunitiesThe 1-hour moving average of gold has begun to turn downward, and gold bulls have suffered heavy losses. After gold rebounds and repairs, we can only continue to short. The support below the range of gold 1 hour ago was 3110, and now it has fallen below. Then gold 3110 has formed an effective suppression in the short term.
Trading idea: short gold near 3110, sl: 3120, tp: 3090
The above is purely a sharing of personal views and does not constitute trading advice. Investments are risky and you are responsible for your profits and losses.

What reason do we have to go short?Gold hit a high and then fell back to meet the support of the moving average. Can you make money by going long on gold above 3130? In a bullish trend, just do what bulls should do and don’t worry too much about gold peaking. The market will give a signal when gold peaks. At present, we continue to do more in the trend.

You can't make money from such a simple market?After gold stepped back, it hit a new high again. Gold bulls continued to be strong. Gold broke through 3127 again, so the bulls are even better.
The gold 1-hour moving average continues to cross upwards and diverges. The support of the gold 1-hour moving average has moved up to 3096, but gold is now far away from the moving average, so wait patiently for adjustments and then step back to continue to buy. The gold 1-hour lowest yesterday fell to around 3100 and then stabilized again, so today gold will continue to buy on dips above 3100.
Trading ideas for reference:
Go long near gold 3110, sl: 3100, tp: 3130

Gold is crazy. When will it peak?Gold has experienced a wave of rapid declines and market washouts. It successfully made many people get off the market with one move, and then it continued to rise all the way. It is really strong.
At present, it seems that gold is getting closer and closer to the top, but you can still take advantage of the pullback to make long orders, but you must not stay in the long term.
At present, gold is getting closer and closer to the top, but you can still take advantage of the correction to go long, but don't be a long-term investor. Gold can take advantage of the trend to take long positions above 3100

Last Friday, 3085 was shorted to make a profit, next week?Gold fell back on Friday after rising higher, and gold encountered resistance at 3085. However, gold is still just adjusting for the time being. Gold rebounded after the adjustment, and gold bulls are still relatively strong. You can continue to buy gold after it falls next week. After all, gold bulls are strong now, but don't chase it at high levels, and wait for it to fall before buying more.
The 1-hour chart of gold still shows a golden cross with upward bullish divergence. After the adjustment, the gold bulls did not weaken, but continued to be strong. Therefore, the decline of gold is just an adjustment. Gold can continue to go long after the adjustment next week. Gold rose again after bottoming near 3067 on Friday. The gold moving average support has now moved up to a line near 3072. Therefore, gold is still a support area in this range. Then if gold falls back to support near 3070 next week, it will still be long on dips.

A real correction for gold could be comingGold 30-minute chart is beginning to have the possibility of a double top, so don't chase long for now. If you want to go long, wait patiently for a pullback, otherwise the high adjustment may also be large. Gold can be shorted on rallies. If gold falls below 3060, then the real adjustment of gold may come.
The market is changing rapidly. Since the strength of gold has been insufficient after breaking through new highs, don't chase too much.


Xauusd resistance level Xauusd resistance level and also available candle confirmation market will fall 🍁 on the base of resistance and also building a double top pattern


EUR/USD Chart Analysis - Bearish Breakdown Towards Target📉 Pattern & Market Structure:
The chart shows an ascending channel that was previously supporting price action. However, the price has broken below the lower trendline, confirming a bearish breakdown.
The recent price action suggests a shift from bullish momentum to bearish sentiment.
📉 Price Action & Target:
A breakdown from the channel suggests further downside movement.
The price is currently around 1.07556, with a potential target of 1.05089 based on the measured move from the broken channel.
This target aligns with a key support level.
📌 Trading Plan:
Bears may look for sell opportunities below 1.07602.
Confirmation of further downside can be seen if the price stays below previous support-turned-resistance levels.
Bulls might wait for a potential reversal near the target zone.
⚠️ Risk Management:
Watch for pullbacks or retests of the broken support before entering a short position.
A break back above 1.08765 could invalidate the bearish setup.

