#APT/USDT Buyers Need To Establish Support Zone#APT
The price is moving within an ascending channel on the 1-hour frame, adhering well to it, and is on its way to break strongly upwards and retest it.
We have support from the lower boundary of the ascending channel, at 4.10.
We have a downtrend on the RSI indicator that is about to break and retest, supporting the upside.
There is a major support area in green at 4.05, which represents a strong basis for the upside.
Don't forget a simple thing: ease and capital.
When you reach the first target, save some money and then change your stop-loss order to an entry order.
For inquiries, please leave a comment.
We have a trend to hold above the Moving Average 100.
Entry price: 4.25.
First target: 4.35.
Second target: 4.46.
Third target: 4.05.
Don't forget a simple thing: ease and capital.
When you reach the first target, save some money and then change your stop-loss order to an entry order.
For inquiries, please leave a comment.
Thank you.
APTUSD

#APT/USDT#APT
The price is moving within an ascending channel on the 1-hour frame, adhering well to it, and is on track to break it strongly upwards and retest it.
We have support from the lower boundary of the ascending channel, at 0.1560.
We have a bearish trend on the RSI indicator that is about to break and retest, supporting the upside.
There is a major support area in green at 0.1555, which represents a strong basis for the upside.
Don't forget a simple thing: ease and capital.
When you reach the first target, save some money and then change your stop-loss order to an entry order.
For inquiries, please leave a comment.
We have a trend to hold above the 100 Moving Average.
Entry price: 0.1600
First target: 0.1640
Second target: 0.1677
Third target: 0.1719
Don't forget a simple thing: ease and capital.
When you reach your first target, save some money and then change your stop-loss order to an entry order.
For inquiries, please leave a comment.
Thank you.
APT : Long term purchaseHello friends🙌
👀You see that the price is in a range and now we are at the bottom of the range. The scenario is simple. The bottom of the range is a good buying opportunity that can be used because 80% of the failures in the range are fake.
⚠So we can buy with risk and capital management and move with it to the specified targets.
🔥Follow us for more signals🔥
*Trade safely with us*

APT : Did the buyers arrive?Hello friends🙌
📈An ascending channel and then a descending channel and then an ascending channel.📉
✔The point is that when the price entered an ascending channel, your price entered and with a failure it entered a descending channel and you exited with a loss and again when the price is at the peak of despair you see that the main buyers enter and push the price up and cause a new ascending channel.
🔊Considering these tips we have told you, always have a trading plan and follow capital management so that you do not fall into the trap.
🔥Follow us for more signals🔥
*Trade safely with us*

APT - A lower timeframe view - Breakout Entry- On 1D candle, APT is still trading inside the channel
- currently price is trading near the resistance and got rejected from the resistance as expected.
- I'm expecting few more candles near the resistance zone before breakout.
If we look at the higher timeframe (1W) view we shared earlier, there is huge potential for uptrend as we are expecting past pattern to repeat
if you are looking for a short term trade without focusing on weekly chart, this is a good opportunity
Entry Price: 5.313
Stop Loss: 3.462
TP1: 6.141
TP2: 7.270
TP3: 8.634
TP4: 10.583
TP5: 14.768
Don't forget to keep stoploss
Cheers
GreenCrypto

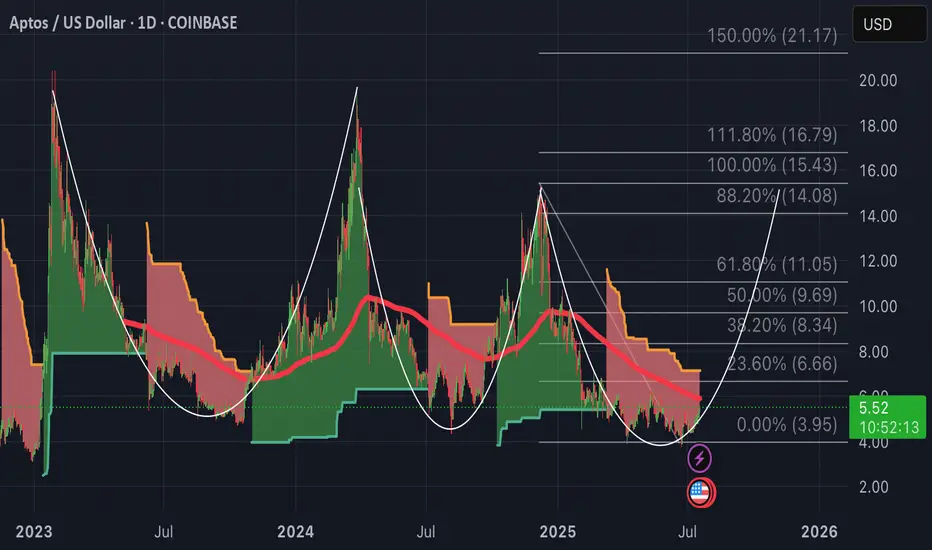
APT-Setup for another macro bullish swingStrictly looking macro time frames we can see APT is setup for another bullish swing to retest 100% Fibonacci near $14.90
Super Trend still flashing bearish red signals but this looks to be reverting soon as price ticks up closer to a 200MA convergence.
Breakout above $5.24 pivot: APT closed above the 23.6% Fibonacci retracement ($4.99), turning it into support.
Bullish indicators: MACD histogram at +0.076 (strongest since July 12) and RSI14 at 65.43 (neutral-bullish).
Liquidation clusters: A push above $5.60 could trigger $4.2M in short liquidations (next key resistance at $5.80 Fibonacci extension).
Supporting factors
: Hyperion’s RION tokenomics, The Aptos-based decentralized mapping project unveiled its token distribution (30% liquidity incentives), driving speculation about airdrop farming.
Shelby network growth: Aptos Labs’ partnership with Jump Crypto for decentralized storage saw $1.3B in stablecoin inflows and record DEX volumes ($5B/month).
Conclusion:
APT’s rally reflects a blend of macro tailwinds, technical momentum, and ecosystem developments – though its 79.78 RSI7 suggests overheating risks.
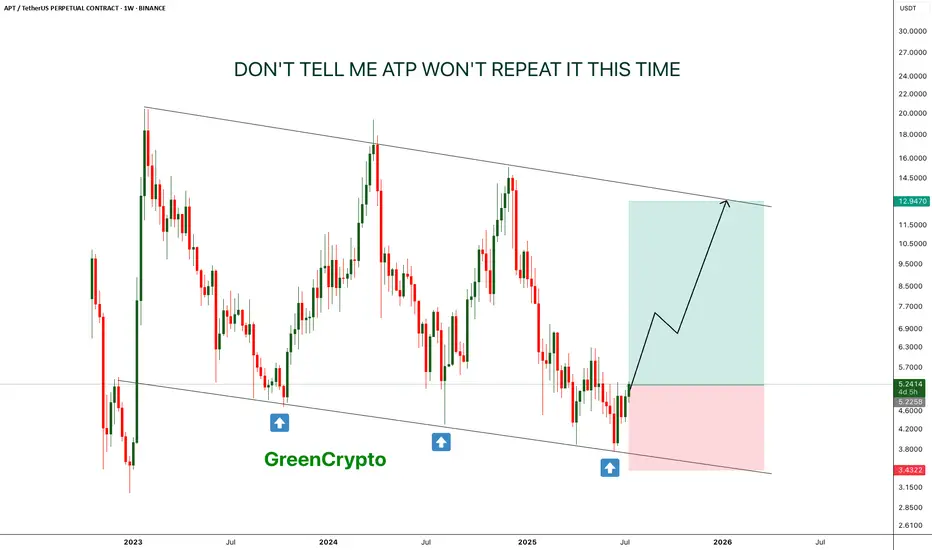
APT - Don't tell me this pattern won't repeat- This time is the charm, APT is is reversing from lower low on weekly chart.
- just like last two time, it is expect to forma new HL.
- there is a high chance that previous two patterns will repeat again
Entry Price: 5.22
Stop Loss: 3.4
TP1: 6.6632
TP2: 8.5059
TP3: 12.6945
Max Leverage: 5x
Don't forget to keep stoploss
Cheers
GreenCrypto
#APT/USDT#APT
The price is moving within a descending channel on the 1-hour frame, adhering well to it, and is on its way to breaking it strongly upwards and retesting it.
We have a bounce from the lower boundary of the descending channel. This support is at 4.43.
We have a downtrend on the RSI indicator that is about to be broken and retested, supporting the upside.
There is a major support area in green at 4.35, which represents a strong basis for the upside.
Don't forget a simple thing: ease and capital.
When you reach the first target, save some money and then change your stop-loss order to an entry order.
For inquiries, please leave a comment.
We have a trend to hold above the 100 Moving Average.
Entry price: 4.47
First target: 4.50
Second target: 4.54
Third target: 4.60
Don't forget a simple thing: ease and capital.
When you reach the first target, save some money and then change your stop-loss order to an entry order.
For inquiries, please leave a comment.
Thank you.

Live tradehello friends👋
✅️Considering the drop we had, now the price has reached an important and good support and the price is supported by the buyers, and the downward trend line has broken and the ceiling has been raised. Considering this, we entered into the transaction with capital and risk management.
🔥Join us for more signals🔥
*Trade safely with us*

APT/USDT – Final Defense at Weekly Demand Zone! Prepare for MoveAPT is currently standing at a make-or-break level. Price has retraced back to the critical weekly demand zone between $4.00 and $4.40 — a region that previously served as the launchpad for a major rally in early 2023.
This isn't just any support — it’s a historical accumulation zone, where strong buying interest was previously observed. The big question is: Will history repeat itself, or is a major breakdown looming?
🔍 Pattern Structure and Technical Outlook:
APT has been consolidating inside a large horizontal range (accumulation box) between $4.00 and $18.27 for nearly two years.
Price is now retesting the lower boundary of this range, right at the $4.00–$4.40 zone.
Current price action shows heavy selling pressure, but buyers may step in at this demand level.
A potential double bottom or false breakdown could form if this week closes with a long lower wick and bullish body.
🟢 Bullish Scenario: Reversal from the Legendary Support
If the $4.00–$4.40 zone holds once again, we could witness a technical rebound with meaningful upside targets:
Key Bullish Targets:
1. $5.14 – Immediate minor resistance, easy to break if short-covering begins.
2. $5.86 – A key level previously rejected, acting as the first confirmation of trend reversal.
3. $7.63 – $9.00 – Former consolidation zone, potential mid-term target.
4. $10.18 to $14.51 – If momentum builds, this becomes the next major expansion zone.
> 📈 Positive catalysts such as improving crypto sentiment, strong volume inflow, or bullish fundamentals could accelerate this scenario.
🔴 Bearish Scenario: Critical Breakdown from Demand Structure
If sellers remain dominant and price closes below $4.00, this would:
Confirm a breakdown from the long-standing accumulation range
Open the door for a deeper retracement toward:
$3.50
$2.80
Possibly as low as the psychological level of $2.00
> ⚠️ Such a breakdown could indicate a major distribution phase and a loss of confidence from larger market players.
🧠 Suggested Trading Strategies:
Buy on Confirmation: Look for strong bullish reversal candles (hammer, pin bar, bullish engulfing) at the demand zone.
Breakout Strategy: Wait for a breakout and retest above $5.86–$7.63 for a safer entry.
Bearish Bias: Consider short entries on a confirmed breakdown and failed retest above $4.00.
📌 Conclusion:
APT is testing its final line of defense. The $4.00 zone remains the last stand for bulls before opening the door to deeper downside levels. Will buyers show strength once again, or are we headed for a major sell-off?
> This week’s close is crucial and could define APT’s trajectory for the upcoming quarter. Watch volume, candle structure, and buyer reaction very closely.
#APTUSDT #APTAnalysis #CryptoReversal #DemandZone #SupportAndResistance #PriceActionTrading #AltcoinSetup #TechnicalAnalysis #CryptoBreakout

Aptos Long Term ViewAptos taken out almost all liquidation from below side, it can fall more towards 3.5$ to take out all new buyers and then push towards 15$, remember 15-16$ is an unmitigated zone, sooner or later this imbalance zone will be filled. So if your an investor and want easy 3x gain then buy apt from 5$ 2nd entry 4$ and last buying from 3.5$, ignore lower timeframe volatility and BTC movement, these entries are easily achievable if market crashes by any chance so you can close your position at breakeven. While 7.19-7.50$ area is crucial to break, once this zone is broken there is nothing upside that can stop Aptos from hitting 15$. Any daily candle closing above the marked zone will confirm trend shift, before this trade setup is like high risk n reward. While I'm very confident on Aptos that it will hit 15% mark.

Free signal hello friends👋
✅️Due to the price reaching the important weekly back support, the price is expected to grow, so you can enter into the transaction with risk and capital management and move to the specified goals.
🔥Follow us for more signals🔥
*Trade safely with us*

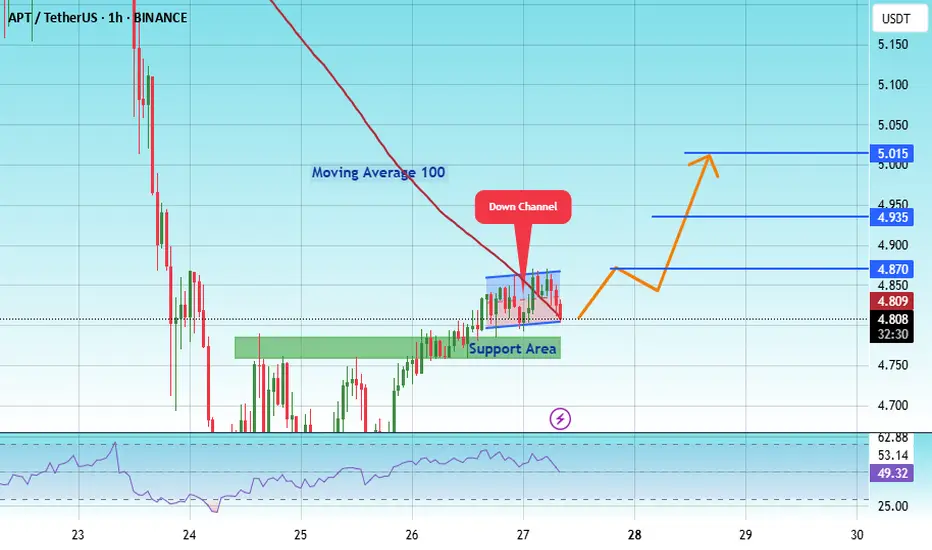
APT at 4.78 $ Historic Support – Massive Reversal Incoming?#APT
The price is moving within a descending channel on the 1-hour frame and is expected to break and continue upward.
We have a trend to stabilize above the 100 moving average once again.
We have a downtrend on the RSI indicator that supports the upward break.
We have a support area at the lower boundary of the channel at 4.78, acting as strong support from which the price can rebound.
We have a major support area in green that pushed the price higher at 4.60.
Entry price: 4.88
First target: 5.047
Second target: 5.19
Third target: 5.35
To manage risk, don't forget stop loss and capital management.
When you reach the first target, save some profits and then change your stop order to an entry order.
For inquiries, please comment.
Thank you.

#APT/USDT#APT
The price is moving within a descending channel on the 1-hour frame and is expected to break and continue upward.
We have a trend to stabilize above the 100 moving average once again.
We have a downtrend on the RSI indicator that supports the upward move with a breakout.
We have a support area at the lower boundary of the channel at 3.81, acting as strong support from which the price can rebound.
Entry price: 4.03
First target: 4.16
Second target: 4.30
Third target: 4.59

APT at Historic Support – Massive Reversal Incoming?APTUSDT technical analysis update
APT has been trading inside a descending channel for over 900 days, and it's now once again testing the channel support. As shown in the chart, the price has bounced multiple times from this level, making it a historically strong support zone.
Currently, the target is the upper boundary of the channel (resistance). If APT manages to break out of this long-term descending channel, it could trigger a strong bullish move, possibly a moonshot.

APT around a historical support DO or DIEAPT / USDT
Price dropped hard to retest the massive historical support again
This multi years support ( 3$-4$) zone always shows great buying pressures thats why it catch our attention!
This support also can play as DO or DIE borderline between bulls and bears
The buyers must defend this area otherwise it will die and make new lows
Keep an eye on it

APTUSDT 1W AnalysisAPT ~ 1W Analysis
#APT If you still have faith in this coin. This support can be considered to start buying back with a short-term target of at least 15%++

#APT/USDT#APT
The price is moving within a descending channel on the 1-hour frame, adhering well to it, and is heading towards a strong breakout and retest.
We are experiencing a rebound from the lower boundary of the descending channel, which is support at 4.87.
We are experiencing a downtrend on the RSI indicator that is about to be broken and retested, supporting the upward trend.
We are heading towards stability above the 100 Moving Average.
Entry price: 4.92
First target: 4.95
Second target: 5.02
Third target: 5.10

APTUSDT 1D AnalysisAPT ~ 1D Analysis
#APT Buy back gradually from here if you still have confidence in this coin with a short term target of at least 15%+ and a long term target of $15

APTOS $APTI don't think I need to explain what APTOS is here.
Right now, it's a good point for a swing position, which is why you're seeing this post.
Best regards EXCAVO

#APT/USDT#APT
The price is moving within a descending channel on the 1-hour frame and is expected to break and continue upward.
We have a trend to stabilize above the 100 moving average once again.
We have a downtrend on the RSI indicator that supports the upward move with a breakout.
We have a support area at the lower limit of the channel at 5.50, acting as strong support from which the price can rebound.
Entry price: 5.70
First target: 5.82
Second target: 6.00
Third target: 6.17

#APT/USDT#APT
The price is moving within a descending channel on the 1-hour frame, adhering well to it, and is heading for a strong breakout and retest.
We are experiencing a rebound from the lower boundary of the descending channel, which is support at 4.95.
We are experiencing a downtrend on the RSI indicator that is about to be broken and retested, supporting the upward trend.
We are looking for stability above the 100 Moving Average.
Entry price: 5.22
First target: 5.34
Second target: 5.47
Third target: 5.65

APTUSDT 1D Analysis APT ~ 1D Analysis
#APT Buy back gradually from this support block with a short term target of at least 15%++ from here.
