5 RULES DISCIPLINED TRADERS FOLLOW 👨🎓Hey guys! In this article you will learn about 5 RULES DISCIPLINED TRADERS FOLLOW, let's dive in it!
But before you do so, make sure you follow my page and turn TradingView notifications ON! Let's go!
1️⃣ Follow Financial Plan, Do Not Go All In
A trading plan is a written set of rules that specifies a trader's entry, exit, and money management criteria for every buy or sell entry.
Do not go all in! Want to lose most or all of your money real fast? Make outsized trading bets, like a roulette player betting it all on red or black.
In fact, big trading bets are a form of gambling.
So avoid gambling, stop going “all in” in single stock or coin.
Start planning your investments, invest in the long-term at least 10% of your income every month in markets and other assets. If you invest a certain amount every month, you are buying shares in good times as well as bad times.
In good times, the value of your shares increase. If you keep your cool and stick with the plan even when the market is down, you get more shares for your money. These additional shares boost investment returns when the market rebounds.
This is a big part of the reason why regular stock investors get a higher long-term return compared to safer investments despite the temporary ups and downs in the market.
A long-term investor has a minimum of a 20-year time horizon; this time frame enables them to avoid playing it safe and to instead take measured risks, which can ultimately pay off in the long run.
2️⃣ Treat Trading Like A Business
To be successful, you must approach trading as a full- or part-time business, not as a hobby or a job.
If it's approached as a hobby, there is no real commitment to learning. If it's a job, it can be frustrating because there is no regular paycheck.
Trading is a business and incurs expenses, losses, taxes, uncertainty, stress, and risk. As a trader, you are essentially a small business owner and you must research and strategize to maximize your business's potential.
Think in Long term – Don’t trade like you are going to retire tomorrow
Have a Clean Trading Office That inspire you
Have a trading Plan for Your Trading Business
Don’t Present Yourself all Over the Market – Have a Proper EDGE over the Market
Have a Strict Daily Trading Routine & Follow it Continuously
Always Protect Your Trading Capital
Have Solid Trading Journal
3️⃣ Don't Trade Everyday
You don't have to open trades every day
Beginners tend to think that professional traders open their trades every day. But this is not true. Professional traders wait for good trading opportunities and only then enter the market.
Some days there will be no good trading opportunities. Sometimes the volatility will be too low, and you simply will not be able to take more or less decent profits. Sometimes, on the contrary, the volatility will be too high, and you will not be able to open your trades safely. There can be many different reasons in the market when it is best to refrain from trading.
Experienced traders know when to sit back and just wait. At the same time, most novice traders constantly open new positions because they think they should trade. But in the end, they make bad trades and constantly suffer losses.
If you don't find valid good entry points, but still open new trades, you will lose much more money than if you had the patience and stayed out of the market.
4️⃣ Accept Losses, Losses = Learning
It is much more useful to accept the fact that losses are the norm rather than the exception. It is also vital to define your potential losses before you enter any trade. Define your possible loss, or risk, in comparison to your possible reward, or profit. It is also vital that you don't take losing personally.
5️⃣ Risk Only What You Can Afford to Lose
Let the profits flow and cut the losses. This idea is one of the most common among traders.
As George Soros said:
It doesn't matter if you're right or wrong. What matters is how much you earn when you are right and how much you lose when you are wrong.
The key to trading success is to grow your profitable trades.
Traders who are afraid of losing their money often stop paying attention to the market situation and become too attached to the current profit. They make their decisions about open positions based only on the fear that the price will not reach their profit.
We know that unfixed profits still belong to the market. But once you start cutting back on your winning trades, you also cut your risk to reward ratio.
Of course, sometimes the market will give you less profit than you bargained for. And that's okay. To trade successfully, you must free the market and stop restricting it.
But if you are trading with money that you fear losing, you will not have that luxury. Instead, you will be afraid of losing your accumulated profits and you will not be able to sit back and let the market do its job.
The beauty of using multiple risk-reward ratios is that you can ignore your winning ratio and still make good money. If you reduce this ratio, you are faced with the need to make a high percentage of profitable trades in order to make a profit. Basically, you yourself are reducing your chances of achieving success.
Stay tuned for further updates!
Always learn, never give up!
Best regards
Artem Shevelev
Artemcrypto

How to Use Divergence
Hey traders!
RSI divergence, a key concept in technical analysis, occurs when the relative strength index (RSI) of an asset shows different patterns compared to its price movements.
If you like my graphics, share some 💙💛
Bullish Divergence:
In a bullish divergence, the RSI indicates the asset is oversold, forming higher lows, while the price action forms lower lows. This signifies a shift from selling pressure to buying interest. The sellers' last attempt to control the market is met with increasing buying volume.
Bearish Divergence:
Conversely, in a bearish divergence, the price achieves higher highs, reflecting the final push from buyers, while the RSI forms lower highs. This classic overbought scenario signals potential reversal as buyers lose momentum.
These divergence patterns provide reversal signals, whether in trending or ranging markets. It's essential to note that relying on a single strategy is not sufficient for consistent profits, however combining various strategies and setups enhances your win rate. Always trade with a risk level that aligns with your financial capacity.
Share Your Insights! Which indicator do you prefer for identifying divergence? Let me know in the comments below.

Is Bitcoin building up for a big move?
This month, BTC teeters on the edge, poised for a breakout or breakdown. Watch key levels: resistance at 31K and support at 25K.
Crucially, the price nears the triangle apex. The closer we get, the more explosive the breakout. Stay tuned!

Risk Management vs. Time ManagementHey! Have you been spending day thinking about mistakes you made and things you didn't do?
Investors are knowingly comparing an exchanges to a casino. A gambler, losing, does not get up from the gambling table in the hope of winning back. He believes that the likelihood of winning increases with every lost bet. This phenomenon, called player mistake, is common among investors.
The pioneers of the theory of behaviour finance Hersh Shifrin and Meyer Statman showed in 1985 that investors intuitively misjudge the likelihood of repeating random results - they hold unprofitable positions too long, hoping for a return in prices, and close profitable positions too quickly, fearing that the movement will end.
The assertion that the market cannot fall for many sessions in a row is untenable. Short-term changes in asset prices are mostly random, notes analyst and author of several books on behaviour finance, James Montier, in his article Global equity strategy, gamblers fallacy. Tails does not become more probable after a series of heads, the coin has no memory - in the same way, the chances of success do not increase after a series of failures.
The major problem in the trading when we trying to recoup from losses. Many people make this mistake over and over again.
The reason of this mistake is the unwillingness to accept and calculate affordable losses and come to terms with the result, the wrong internal setting that you must end every trade and every trading session with a profit. But not every trade will be profitable.
How can I avoid this mistake?
1. After loss trade, tell yourself: "Stop, I won't trade now, I will pause."
2. Analyze the failed trade and write it down. Thus, you will allow yourself to "cool down" and more intelligently approach the situation on the market. There will always be opportunities, don't be afraid to miss out on any movement and profits.
3. Calmly develop a new trading plan based on market changes. If according to the trading plan you need to enter, then enter and earn. Do not rush to enter the market immediately, because it is easy to enter, but it is difficult to exit, since it is no longer possible to change the initial price at which you entered.
4. Make sure you following your risk management and always trade with possibility to lose.
Stay safe and good luck!

Veracity Bullish Surge About to End?!🚀 KUCOIN:VRAUSDT Price Analysis 📊
Verasity is in a bullish spree since September 29, showing strong upward momentum. Currently, it's nearing a crucial resistance level at 6886. A break above could pave the way for higher targets at 7463 - 8010.
🎯 Potential Targets: 7463 - 8010
🛡️ Support Levels: 6037 - 5438 - 5053
Stay alert for a breakout of the trendline, signaling a correction.

Bitcoin Dominance AnalysisBitcoin dominance serves as a crucial indicator, offering insights into the broader altcoin market. Today, we observe a clear breakout from a cup and handle pattern, indicating a potential shift in market dynamics.
Key Resistance Levels Ahead: [/b
Resistance 1: 50.70%
Resistance 2: 50.91%
I anticipate pullbacks and increased activity in the altcoin market as a result. Keep an eye on potential opportunities! 🪙 🔍

HOW TO BALANCE YOUR LIFE AND TRADINGHey! When we all started we passed trough some difficulties in trading.
Usually we face this problems during first year of trading. Most of people by the end of year losing all of money and quit trading forever.
Basically this caused by overtrading and having no idea what to do. Like many business in our lives trading require some abilities and technics which you can study and apply to get good results. But when you are novice trade you probably don't even know where to start.
So on the pic you see basic problems and solutions to start from:
PROBLEMS:
- Worried about trades all day and night
This point distracts from important things and giving huge depression in your live.
- Losses affecting personality and mood
When you starting to losing too much, it often hard to get money back, moreover trying to recoup will give even more loss.
- Mindset confusion
Like every depression in our lives it confuses our abilities to think clear.
- Rushing for new trades
Overtrading is common mistake, causing huge losses from impatient traders/investors.
- Trading assets for all of your money
I f you ever tried trading for 100% of your money — write me a comment!
This problem causing new traders losing too much, and trading become gambling.
SOLUTION:
- Plan your trades
Focus on the future trades, plan your entries, take profits, stop loss. Like every business it should be planned and if something not working you have to fix it and try again.
- Take small trades
In trading Small is BIG, start with small trades, don't give rush, if you will not be rich till the end of year it is okay. But first learn how to trade and make sure you learned from mistakes and wins.
- Focus on affordable risk
Yeah, just 10% from traders have profits every month, rest of traders struggling somewhere in the middle. To make sure you will be in 10% winners, try to understand your risks before opening new trades.
- Use trading system
Trading system is something which suits your personality, you have to try different strategies and technics before understanding your trading criterias. But once trading system is setup, you will be fine and closing months in solid profits.
- Take breaks in trading
Make sure you have some time for other activities, try to plan your trading time and sometimes on the market is nothing to do, so take a breath and relax. Market won't go away :)
👍I appreciate your likes and comments below this post, lets discuss our problems in trading! 💬

Kusama KSMUSDT Analysis: A Opportunity UnfoldingKusama's chart paints an intriguing picture for both swing traders and crypto enthusiasts looking to fortify their portfolios.
The formation of an Inverted Head & Shoulders pattern signifies a potential upward surge. This pattern, residing in the $20.0 range, holds immense significance. It not only marks a major downtrend resistance but also represents the neckline of pattern.
Adding to the potency of this setup, the RSI indicator has crafted a bullish divergence between the left shoulder and the head of the pattern. This divergence not only validates the pattern but also underlines its strength.
However, a word of caution: while the market excitement might push you towards FOMO, it's crucial to maintain a balanced approach. The ideal entry point lies at a clear breakout, reinforced by solid volume and supported by rigorous risk management.
In summary, this juncture presents a golden opportunity, ripe for those who tread wisely and decisively. Watch the $20.0 level closely; it's the gateway to a potentially profitable trades.
Stay vigilant and trade responsibly. Peace out. 🚀💹

Ten Thousands Dollars Bitcoin GuardianFor upcoming days and up to 2 weeks we will face price action near 12500 and 10800. Looking for continuation after this zone, up to 15 000 levels...

AI Shaping the Market Landscape of 2030-sDear @TradingView ,
Today, I would like to share some observations regarding the S&P Composite index that highlight a repeatable market cycle. It is evident that this cycle consists of a 30-20 year period of Economic Growth, followed by a subsequent phase of 15-10 years characterized by Downturn or Sideways movement. By examining the historical data, we can identify patterns that shed light on the cyclical nature of the market.
Throughout history, the market has experienced periods of significant economic expansion, often driven by transformative inventions and advancements. These innovations, such as sailing, engines, railroads, electricity, medicine, computers, the internet, smartphones, fertilizer, and artificial intelligence, have played pivotal roles in shaping positive market trends. Each breakthrough has had a profound impact on various industries, driving productivity, and spurring economic growth.
Sailing: Pioneering Global Trade (Timeline: Ancient Times)
Sailing, one of humanity's earliest inventions, opened up new avenues for exploration and trade. The ability to traverse vast distances by sea connected civilizations, facilitated the exchange of goods, and laid the foundation for early economic systems.
Engines: Powering Industrial Revolution (Timeline: 18th-19th Century)
The invention of steam engines during the Industrial Revolution revolutionized manufacturing and transportation. Steam-powered engines enabled the mass production of goods and led to the creation of railways, powering economic growth and fostering global trade networks.
Railroads: Connecting Nations (Timeline: 19th Century)
The advent of railroads marked a monumental shift in transportation. The construction of railway networks facilitated efficient movement of goods and people, enabling rapid industrialization and spurring economic development across continents.
Fertilizer: Revolutionizing Agriculture (Timeline: 19th Century)
The development and widespread use of fertilizers marked a significant turning point in agricultural practices. During the 19th century, scientists discovered the importance of essential nutrients for plant growth. The invention of chemical fertilizers allowed farmers to replenish soil nutrients, thereby increasing crop yields and transforming agricultural productivity. The widespread adoption of fertilizers revolutionized global food production, ensuring food security and supporting population growth.
Electricity: Illuminating a New Era (Timeline: Late 19th Century)
The discovery and harnessing of electricity ushered in a new era of innovation and productivity. Electric power revolutionized industries, enabling the mass production of consumer goods, while also transforming communication and lighting systems, contributing to economic growth.
Medicine: Advancing Healthcare (Timeline: 20th Century)
Medical advancements, such as vaccines, antibiotics, and improved surgical techniques, have significantly improved public health and increased life expectancy. These breakthroughs not only saved lives but also led to increased productivity and economic stability.
Computers: Automation and Digital Revolution (Timeline: 20th Century)
The invention of computers and subsequent advancements in computing technology revolutionized the way we work, communicate, and process information. Automation, data analysis, and improved efficiency in various sectors led to increased productivity and the emergence of new industries.
The Internet: Global Connectivity (Timeline: Late 20th Century)
The internet, a transformative invention of the late 20th century, connected the world in an unprecedented manner. It facilitated the exchange of information, enabled e-commerce, and transformed communication. The internet played a pivotal role in the emergence of new business models and industries, driving market growth.
Smartphones: Empowering Connectivity (Timeline: 21st Century)
Smartphones revolutionized the way we access information, communicate, and interact with the world. These handheld devices amalgamated various technologies, such as internet connectivity, computing power, and applications, making them indispensable tools for personal and business use. The widespread adoption of smartphones led to significant advancements in mobile technology and transformed industries such as e-commerce, social media, and digital entertainment.
Artificial Intelligence (AI): Shaping the Future (Timeline: Present)
Artificial intelligence has emerged as a game-changer in recent years, with applications spanning across industries. AI algorithms and machine learning techniques are driving automation, data analysis, and predictive capabilities, enhancing productivity and enabling the development of innovative solutions. AI continues to revolutionize industries such as writing, coding, finance, security, manufacturing, and transportation, driving market growth and shaping the future of various sectors.
Throughout history, transformative inventions and advancements have played crucial roles in shaping the market landscape. The S&P Composite index serves as a valuable tool to gauge market performance and track these cycles over time. By analyzing the historical movements of the index, we can observe the repetitive pattern of prolonged Economic Growth, typically spanning around 30-20 years. During this phase, the market experiences upward trends driven by innovation, increasing productivity, and expanding global trade.
However, it is important to recognize that these periods of growth are not indefinite. As history has shown, there comes a point when the market enters a phase of Downturn or Sideways movement, lasting approximately 15-10 years. This phase is characterized by market corrections, global wars, economic recessions, or periods of depression, where the market may exhibit increased volatility and limited overall growth.
Sincerely
Artem Shevelev

Bearish Specter Haunts Bitcoin's ChannelHello dear TradingView followers and community!
Today, the Bitcoin price is making a notable attempt to breach the support level of the Head & Shoulders pattern. Based on the height of the head, it is anticipated to potentially land in the range of 24,000 to 25,000, marking a decline of approximately -11.5%.
Nevertheless, it's crucial to bear in mind that the price of Bitcoin has a reputation for delivering unexpected surprises, including bull and bear traps that can catch us off guard. Therefore, exercising caution in our current positions and refraining from engaging in risky trades is undoubtedly advisable.
Best regards
Artem Crypto

Bitcoin 1 Day TimeframeBitcoin has been in an accumulation phase since mid-May 2022, and it appears that we have now reached the E phase, where the price begins to move outside the established trading range. The trading range has been established between $ 25,000 and $ 19,000, and it is evident that we are currently trading above this range, specifically above $ 26,500 since mid-March.
One positive aspect of the current situation is that the price is forming a symmetrical triangle within a local uptrend. This pattern often serves as a confirmation of an upcoming move to higher price levels. In this case, the symmetrical triangle suggests the potential for Bitcoin to reach the range of $ 36,000 to $ 45,000.
The formation of a symmetrical triangle within an uptrend indicates that there is consolidation taking place, with buyers and sellers in a balanced position. As the triangle pattern reaches its apex, it typically precedes a breakout or significant price movement. In this context, the symmetrical triangle pattern suggests a bullish bias, indicating that the next major move for Bitcoin is more likely to be to the upside.
In summary, Bitcoin's current accumulation phase and the formation of a symmetrical triangle pattern within an uptrend provide a positive outlook for potential price appreciation. The pattern suggests the possibility of a move to the range of $ 36,000 to $ 45,000. However, it is essential to remain vigilant and closely monitor market conditions to adjust trading strategies accordingly.

Is Bitcoin Trying to Turn On US?! Warm greetings to all TradingView traders!
Let's check out the Weekly timeframe analysis for Bitcoin, where an interesting pattern unfolds.
Similar to previous periods, it appears that Bitcoin's current situation shares resemblances.
Keep a keen eye on the Weekly timeframe chart and observe the UCS_Stochastic Momentum Index indicator.
Historically, the K line crossing the D line has often preceded significant price drops.
While this indicator may have limitations and potential inaccuracies, it does suggest that Bitcoin could be on the verge of a noteworthy turning point.
🎙️ Dear fellow traders, I'd greatly appreciate your thoughts on the next move for Bitcoin. Please take a moment to share your comments and insights. Your valuable input helps us gain a deeper understanding of the market. Let's engage in a discussion and uncover the potential of Bitcoin together

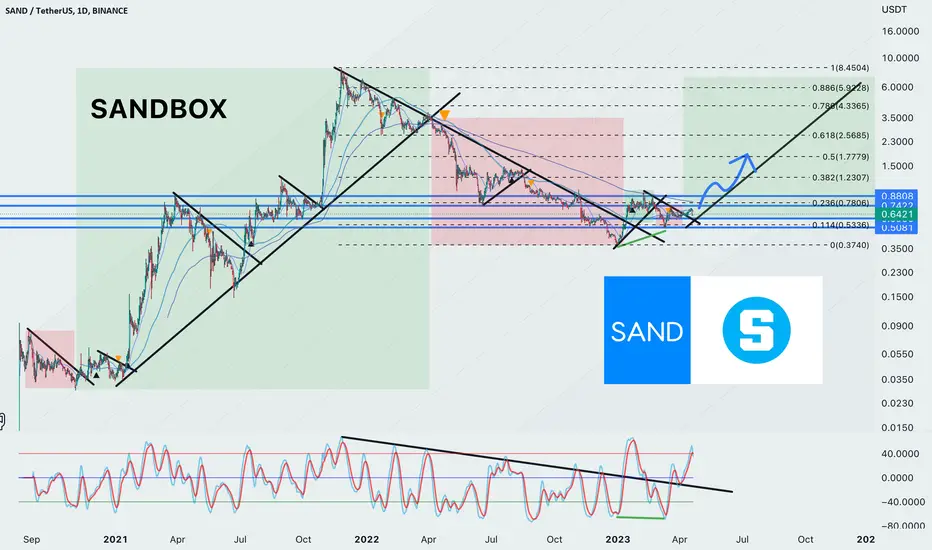
Analyzing the Price Trends of SAND Cryptocurrency SANDBOXThe growth of SAND cryptocurrency in the 2021 year has been nothing short of remarkable. In just 13 months (from 2020), the price of SAND rose from a humble 0.02$ to an impressive 8.00$. This meteoric rise has caught the attention of many investors, who are now scrambling to get in on the action. What is even more impressive is that this growth occurred after a time of great uncertainty in the world, as the COVID-19 pandemic was wreaking havoc on the global economy. Despite these challenges, SAND was able to grow exponentially, proving that its unique blend of gaming and blockchain technology is resonating with a wide range of people. As we look to the future, it's clear that SAND has the potential to continue its growth trajectory.
The SAND cryptocurrency experienced a significant price drop in 2022, with the token falling from its previous high of 8.00$ to just 0.37$. This decline took many investors by surprise, and many were left wondering what the future held for SAND. However, it's important to note that this price drop was not unique to SAND, as the entire cryptocurrency market experienced a bearish trend during this time. Despite this setback, the team behind SAND remained committed to the project, and continued to work on improving the platform and expanding its partnerships. In 2023, the price of SAND finally established a bottom, with the token hovering around the 0.37$ mark. While this is a significant drop from its previous highs, it's important to keep in mind that cryptocurrency markets follow same cycles over and over again.
Based on technical analysis of SAND's chart and its Fractal structure, it's possible that the token may experience a price increase in the coming months. The chart indicates that SAND has been consolidating in a range between 0.3$ and 0.8$ for several months, which could indicate a period of accumulation by investors. Additionally, there has been a recent uptick in trading volume, which may signal increased interest in the token. Based on these factors, it's possible that SAND could see a price increase in the spring or summer of 2023, with the token potentially reaching levels of 2.0$ to 2.56$.
ArShevelev /// Ethereum Diamond & Triangle. Still Heading North.Hey there! Ethereum price has fantastic opportunity to make further move to the north. However no one says the road will be easy.
Currently price action is locked in diamond pattern, indicating for local swing reversal.
Thus far, it is viable to purchase for the mid-long term along a support line in the $1340-1450 range.
Patterns Cheat Sheet :

Ripple's Mid-2023 Move: A Bold Step Forward or a Risky Gamble?I strongly believe that XRP may experience a temporary downward trend before making another significant surge.
Upon conducting a thorough analysis of XRPUSDT and XRPBTC, I have developed opinion that XRP may experience a temporary downturn before experiencing another substantial surge.
Repeating history cycles in trading is a well-known phenomenon. Market cycles, which refer to the periodic recurrence of trends, are a characteristic feature of financial markets. These cycles are driven by a range of factors, including economic indicators, political events, and technological advances, among others. While the duration and intensity of market cycles may vary, patterns tend to repeat themselves over time.
Based on my analysis of the Relative Strength Index (RSI) and the price range (channel), I believe that XRP may experience a temporary dip before potentially rallying from 0.5. It is important to note that this rally may occur without significant retracements down to 0.23, as I previously indicated in my earlier update.
It is essential to exercise extra caution in light of the current market conditions, where traders and investors are not as prone to FOMO (fear of missing out) as they were in 2017. As a result, any temporary dip could potentially be smaller than anticipated, just as the rally could be relatively moderate.

Bitcoin's Incredible Rise: Say Goodbye to $18,000 ForeverHey traders its @ArShevelev , It is possible that the recent banking crisis will demonstrate the true value of Bitcoin
Despite banks' shares sliding down by 70%, Bitcoin passes the bank stress test as it has been performing nicely, gaining 75% from its bottom.
This resilience of Bitcoin during times of economic uncertainty has been attributed to its decentralized nature, which means it is not controlled by any government or financial institution.
Additionally, Bitcoin's limited supply and the fact that it is not subject to inflationary pressures have also contributed to its appeal as a safe-haven asset.
As more investors seek alternative investments outside of traditional financial systems, cryptocurrencies like Bitcoin are becoming increasingly popular as a means of diversifying portfolios and mitigating risk.
In my opinion, it would be prudent to carefully evaluate the current price structure by crossing and retesting the 29,000 level, which serves as a critical support/resistance level. It is reasonable to anticipate potential price movements above the 29,000 level within the range of 41 to 30 over the coming months or even a year.
I have included my price prediction drawings on the chart below for your reference.
STOP EVERYTHING and check out the mind-blowing Accumulation PATTERN you've NEVER seen before:
Best regards,
Artem Shevelev

ArShevelev /// BAL Next Leves to Get ProfitHey traders!
BALUSDT in pretty flat triangle in range of 5-7. This zone could be potential accumulation phase, so I want to take early trade and enter below 7-ish with targets 8-9-10-11
Good luck!

ArShevelev /// GMT What's Next?Hi traders!
GMTUSD price made a +50% move after retesting important support level. I believe it will rebound near 0.38 and start moving up 0.6 - 0.68
Good luck!

Uncovering Wyckoff Accumulation Secret PatternWyckoff Accumulation & Distribution is a trading strategy that was developed by Richard Wyckoff in the early 1900s. It is based on the premise that markets move in cycles and that traders may recognize and use these cycles.
In accumulation phase Wyckoff strategy involves identifying a Trading Range where buyers are accumulating shares of a stock before it moves higher. This allows traders to enter into positions at lower prices and benefit from the eventual price increase. Wyckoff Accumulation is an effective way for traders and investors to gain on market movements and make profits from their trades.
The Wyckoff Trading Ranges feature a chart pattern called Descending Wedge. This pattern involves two trendlines, one falling and one rising, which converge to form a wedge shape.
This pattern indicates that the price of an asset is likely to break out in the direction of the falling trendline.
In my understanding, "Continuous Weakness" means a shift away from selling towards buying. Sellers fail to hold the pressure, so buyers take the lead leading in D,E: MARKUP phases.
Kind regards
Artem Shevelev
Please check out my older Education Ideas
Consider put like and follow my page for more updates)

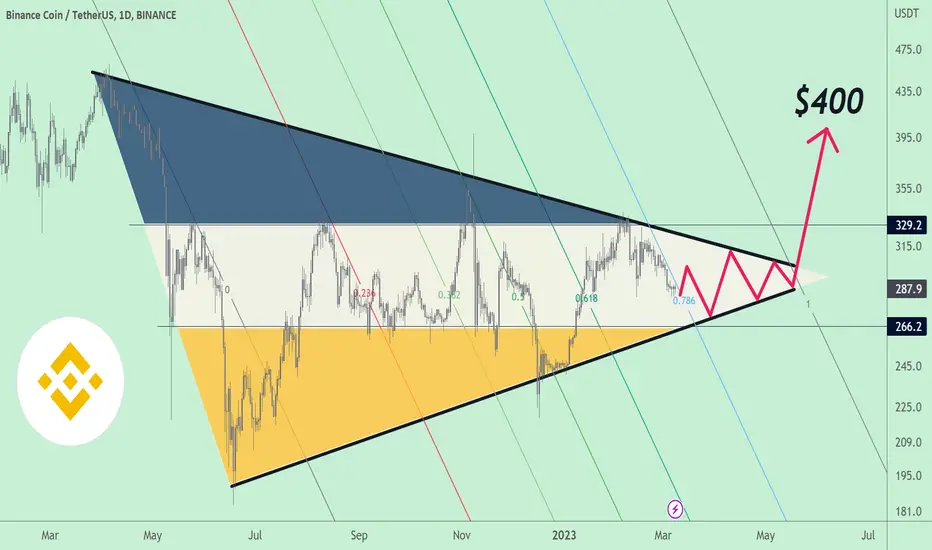
ArShevelev /// BNB Crazy Big Triangle to Breakout!Binance holding nicely during whole bear market phase, and it seems like it will make another good profits for those who entering next bull phase!
$400 is a "musthave" expectations, realisticly prices could be much, much higher in 2025.
Kind Regards
Artem Crypto
ArShevelev /// Bitcoin's Decline is InevitableThe fact is that a lot of people just don't care about Bitcoin anymore. If you do a Google search for "Bitcoin," it will lead to 623 million results. But if you do a similar search for "bitcoin price," there are only 157 million results, and the vast majority of them are not important news articles or price analysis.
And the reason why Bitcoin prices remain stuck in sideways channels or breakdowns is because most people don't care about it anymore. Price action is boring.
They're waiting to see how much they can make by buying low and selling high, and they're not so concerned about the reality that such a purchase demands endurance and perseverance.
Most people are used to trading in 2022 on futures in a continuous downtrend, but now the time has come for a trend shift, and we see the movements altering each other up and down, causing the market to go sideways.
If there is a long-term buyer on bitcoin, I am confident that it will purchase quietly and change the public attention away from purchasing but towards selling. Remember that.
Things might change if the price goes below the 20600 level, which I believe is critical for momentum. Yet, if 20600 is broken, we will almost certainly witness a double bottom attempt.
Kind regards
Artem Crypto

The Simpliest Math Behind Every Succesful TraderWhat exactly is risk management?
The ability to control your losses so that you do not lose all of your equity is referred to as risk management. This is a system that may be applied to everything that involves probabilities: trading, poker, blackjack, sports betting, and so on.
Many inexperienced traders underestimate the significance of risk management or don't understand the basics when it comes to risk management.
Would you risk $5,000 on every trade if you had a $10,000 trading account? Probably not. Because it only takes two consecutive losses in order to lose everything.
🧠 Now, let's imagine a thought experiment, in wich 🤩Alex and 🤨Peter are both traders with $10,000 in their accounts. Alex is a high-risk trader who puts $2500 risk on every trade. Peter is a cautious trader who puts $100 risk on every trade. Both apply a trading strategy that has a 50% success rate with an average risk-to-reward ratio of 1:2.
For good example, let's imagine the next 8 trades had the following results:
4 losing trades in a row
4 winning trades in a row
Here is the result for Alex: -$2,500, -$2,500, -$2,500, -$2,500 = -$10,000 Loss of the total account 😭😭😭😭
Here is the result for Peter: -$100, -$100, -$100, -$100, +$200, +$200, +$200, +$200 = +$800 Profits. 🏆 🏆 🏆 🏆
Can you tell the difference? See how risk management show the difference between being a profitable or losing trader. Peter managed to recover losing trades, and get into good profits after 8 trades. Alex didn't survive 4 trades...
🚨 You might have the finest trading strategy in the world, but if you don't manage how much you lose, you'll lose it all. It's only a matter of probability and time.
However, following this basic example will assist you to make your trading more profitable. Simply give it a shot.
Kind regards
Artem Crypto
Follow, Like and Share are appreciated!
Take a look at my other Educational ideas below:
