💱EURUSD - Range Formation. Heading for support EURUSD is entering a new range of 1.0912 - 1.1067. The price makes a shakeout against the support and seems to form a growth, but on the H1 we see a breakdown of the uptrend.
TA on the high timeframe:
1) Range is forming on the background of a bullish trend
2) On the lower chart we see the correction from the liquidity area 1.09700.
TA on the low timeframe:
1) Earlier we saw a breakout of the uptrend, after which the price forms a retest of 1.09700 resistance
2) The retest forms range resistance. The price starts to form it and heads towards the range support
3) Most likely, in case of breakout of the local support 1.09430, we will see a fall to 1.08900.
Key support📉: 1.09430, 1.08900
Key resistance📈: 1.09700
Ascending Channel

CADCHF → Formation of a pre-breakout consolidationFX:CADCHF is preparing for the continuation of the uptrend. The price within the ascending price channel is forming a consolidation against the resistance 0.68220. What to expect from the price?
The chart clearly shows a bullish trend. The market is interested in the resistance at 0.68220, which the sellers are defending so strongly. If the price breaks through that area, it might continue rising, and the CHF-CAD will continue going down.
The moving averages show that the market is ready to exit the consolidation. At the same time, the indicator acts as support. The nearest target, which the price can strive for, is the resistance at 0.69312 level.
Support levels: SMA-50, trend support, 0.67194
Resistance levels: 0.68030, 0.68220
I expect the consolidation aimed at breaking the resistance will break the level in the nearest future. After the breakdown of the level I will be waiting for the strengthening of the currency pair to the upper boundary of the trend.
Regards, R.Linda!

GOLD → Breakthrough of the global trend support. 1800? OANDA:XAUUSD last week motivated us to keep a close eye on the trend support and the Triangle Beak pattern. A break of the support breaks the base of the trend, but there is still no confirmation, we only see the primary phase. What to expect from the price?
A breakout of the trend base forms quite a strong bearish momentum. Earlier, the broken level was also tested, but the false-break format did not give any result, Price is closing in the red zone on the daily and weekly timeframe.
If the bears can hold below 1939, 1925 or even below 1907, they have an excellent corridor to move down towards the 1800 area.
Pay attention to the 1907 - 1808 range. We have a void on volume and with the support levels, price could "fly" down.
There is a lot of important news coming out this coming week, it is worth keeping an eye on the press releases and considering the news in your trading:
I expect bearish scenarios to develop in the coming week. Preliminarily, the Fed is not going to cut rates, they will either hold or increase. There is a crisis in the countries against the background of geopolitical reasons; there are quite a lot of disputable nuances related to inflation in the West. In general, we have a rather complicated situation. Analysts shout about the U.S. recession, it is possible that the price of gold will go down deliberately, but again, everything is just a rumor.
Regards R. Linda!

Bitcoin - Plan for the next 6 months! (strategy)
Bitcoin is pumping, but buying at the current price is not worth it at all. I have been talking about the 10k, 15k, or 20k (unfilled CME gap) for a long time. Usually, summer is choppy, followed by September and October, which are generally very bearish months for Bitcoin.
Of course, I am not here to immediately FOMO into Bitcoin, and I do not recommend anyone do it. You can take a look at altcoins; they are extremely bearish, and since I have been bearish for 3 months, they have crashed by 50% or 70%. Just take a look, for example, at MATIC or Cardano.
I do not have any Bitcoin because timing is important when it comes to investments. The most efficient way is to buy Bitcoin around 20k later this year and ride the third impulse wave to the upside. I expect a huge ABC correction to be triggered soon, and as we know, the usual retracement for the 1st impulse wave is most likely 0.618 or even deeper.
Bitcoin is one of the most bearish assets in the world. Gold almost hit an all-time high, as did Nasdaq. Bitcoin is supposed to be the most bullish asset, right? It already should be above the previous all-time high somewhere around 100k, but it's struggling below 30k.
This analysis is not a trade setup; there is no stop-loss, entry point, profit target, expected duration of the trade, risk-to-reward ratio, or timing. I share my trades transparently and post trade setups privately.
I am expecting a big crash on Bitcoin, no matter this recent pump. The market moves in waves, and corrections do make sense to me. I think 10k is no longer possible for Bitcoin due to the recent pump because the current uptrend from 15k is now transforming from a corrective wave into an impulse wave, which is a sign of the start of the bull market.
On the chart, you can see a projection for a Diamond or Head and Shoulders pattern that can be formed in the next few months prior to the final dump to 21k.
My strategy and game plan for Bitcoin is that first we are going to go higher, to around 33000, to take the liquidity above the previous swing high from 2022. After that, I am expecting a huge crash back to 25k, and then some consolidation pattern should occur as wave (B). In September, we can expect a final huge crash to 20K, followed by an extremely strong buy-back from whales.
Thank you, and for more ideas, hit "Like" and "Follow"!

EURCHFEURCHF is in new uptrend, as previously it was in down trend now the trend has shifted. Currently the pair is retracing at fib golden ratio which is also the previous support. Will the pair continue its upward trajectory ?

AUDCAD - BROKEN CHANNEL📉Hey Traders👋🏻
The AUDCAD Price Reached a Major Resistance Level (0.91064 - 0.90637) and Formed an Ascending Channel✔
Currently, The Price Reject To Create New Higher High, The Last Higher Low is Broken (Break of Structure)
Moreover, The Support Line of The Channel is Broken!
So, I Expect a Bearish Move📉
i'm waiting for a retest...
-----------
TARGET: 0.88315🎯
___________
if you agreed with this IDEA, please leave a LIKE, SUBSCRIBE or COMMENT!

GOLD → Candlestick analysis - the market is ready to fall OANDA:XAUUSD quickly enough reaches the specified target of 1914 and forms a bullish rebound after a false breakout.
The price forms a range of 1939-1914, within which it can reach local resistance by the end of the session.
The daily timeframe hints that the fall will continue. The price exits the local descending range downward, breaking the support (another view is a break of the triangle support), after which a correction is formed - which is a logical component of trading. And the daily candle on Thursday closes at the very low, which suggests that the potential is not yet exhausted. The gold market is bearish right now.
Today's publishings are:
8:30 GMT Manifactruting ( FX:GBPUSD GBP)
13:45 GMT Services PMI ( FX:EURUSD USD)
Resistance levels: 1925, 1939.
Support levels, 1914.
The daily candlestick forms a local level - the low of the day. If price breaks this local support, it will head much lower, as there is a void under 1914 on the chart, but within the trading session a rebound could lead to a strengthening to 1925 or to 1939.
Regards R. Linda!

GBPAUD → Price continues to strengthen. I expect a breakthroughFX:GBPAUD is showing a chic dynamic based on the reversal pattern. At the moment the price is in a range and most likely the market will have to form a consolidation before breaking through the flat resistance.
Earlier the price acquires strong support from the 200-hour moving average. A strong consolidation forms a bullish position, after which we saw a rally to 1.90000
At the moment, I expect a retest of 1.90353 and the formation of a pullback to support in the near future. In the medium term from the trend support or from the level 1.89200 I would expect an active strengthening of the currency pair.
Support levels: trend bottom line, level 1.89200, sma200
Resistance levels: 1.90353, 1.91835
The pound continues to get stronger and the resistance of the range will not stop the price. I expect pre-breakout consolidation with a further breakthrough to 1.91835.
Regards R.Linda!

GOLD → Price is heading for new lows. What to expect from gold?OANDA:XAUUSD is falling. There was a breakout of the support level. At the moment the gold is in the range 1939 - 1914. Regarding this flat, various scenarios are possible. What to expect from the price in the near future?
Obviously, the price is aimed at testing the liquidity zone, which is below 1914. Yesterday, before the American session closed, the price tested the previously broken strong level. There was a shakeout relative to 1939. Now, after capturing the liquidity of 1939, the price is headed down.
On the H4, the local resistance level of 1928 is formed and the price is consolidating lower. Gold is likely to hit a new low (1914 or 1900) before a bullish pullback.
At the moment, the market is bearish. Until the price breaks one of the key resistances, it will not change. But the price is not going to do that yet :)
Resistance levels: 1928, 1939, SMA-50
Support levels: 1920, 1914, 1885
I expect the price fall to 1914. A small pullback may follow from this support, which may further lead to a breakout and a decline to 1900.
Regards to R. Linda!

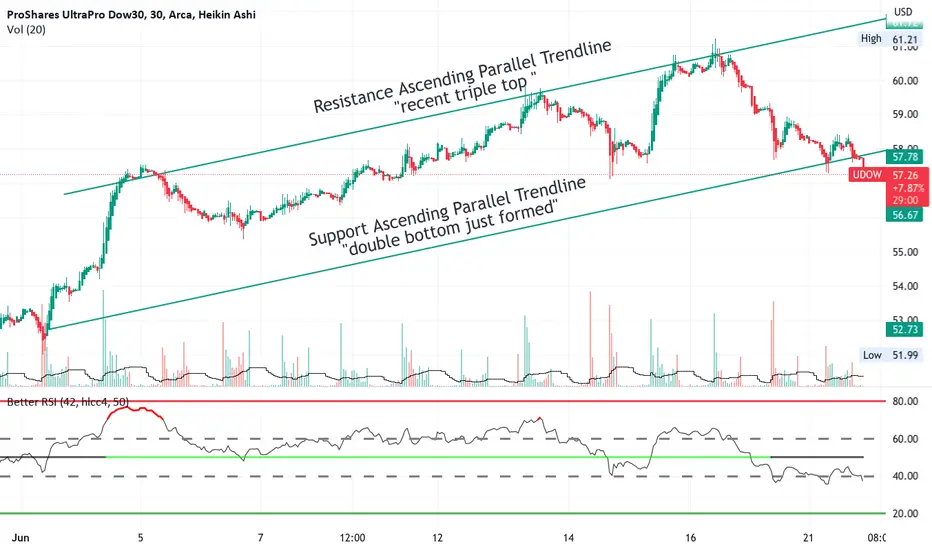
UDOW a triple leveraged ETF of the DOW indexUDOW is shown here on the 30-minute chart rising over the past month in an ascending
parallel channel. The chart shows the price currently situated near to the bottom of
the channel which is the support trendline drawn onto the chart with the resistance
trendline as well. My trading plan is I will take a long trade of 50 shares with a stop loss
immediately below the support trendline. I see a targets as $ 62 and $ 65 making for
a very favorable reward for the risk taken. For the entry, I will use the 5- minute chart
and enter when the HA candles are green and the RSI is above 50. I realize that the DOW
has less volatility than the S & P or NASDAQ but with that is less overall risk of reversals
and pullbacks. I tend to take higher-risk trades but see this as having a balancing effect
in my overall portfolio.
Bitcoin update...As we expected in the previous analysis, Bitcoin came to our trend line
Bitcoin is in an ascending channel
Fib Extension 0.5
Fib Retracement 0.88
The moving origins are close together (100 & 150)
We have reached the supply area

Bitcoin - Bull trap triggered, huge crash is starting!
Today I opened a short on BTC, and in this analysis, I will tell you why. In the previous analysis called "Bitcoin - The biggest bull trap in history!" I told you I wanted to short Bitcoin at the 0.618 FIB retracement; today we reached the important level and took liquidity above the previous swing high. Now everyone is extremely bullish, and it's time to short it.
On the chart, you can see a huge parallel channel on the weekly scale, and today we retested the trendline of the channel and the POC of the previous triangle. This is a very strong resistance, which is why I expect a huge decline in price in the next few days or even weeks. I am a very transparent trader because I share all the trades that I make with the entry points, SL, and TP.
From the Elliott Wave perspective, we can see a falling wedge, which is a bearish leading diagonal pattern with an overlapping wave structure. Usually you want to short it at wave (4) of the diagonal pattern, and we hit this wave today. In my opinion, wave 2 of the higher degree has been completed, and we are ready for the 3rd wave, which can be extremely steep.
It's possible that Bitcoin will start consolidating a little bit at the current price, so altcoins can also pump a bit. But it's only going to be temporary.
Set up notifications for my ideas so you will be alerted in your email when I publish new analyses immediately!
This analysis is not a trade setup; there is no stop-loss, entry point, profit target, expected duration of the trade, risk-to-reward ratio, or timing. I share my trades transparently and post trade setups privately.
Thank you, and for more ideas, hit "Like" and "Follow"!

GOLD → Breakthrough 1939. Greetings from the Bears OANDA:XAUUSD breaks support after another retest of the 1939 level. Consolidation is forming and the price is headed down. What can happen and what should we be prepared for?
There is a large pool of liquidity below the 1925 area, and if it touches this level, the volumes may surge and the volatility may increase. The price may retest the previously broken 1939 before further declines.
But at the moment the fact is that the market is about to fall and there are many reasons for that, all of which are pointed out on the chart.
After breaking through the support and consolidation of the price below the level, we got an entry point. The price is expected to fall under the pressure of the bears and the current trend.
At 14:00 GMT FED Powell is broadcasting, it is worth looking out for his words. (Expect increased volatility).
Resistance levels: 1939, SMA-50.
Support levels: 1925, 1914, 1885.
As a priority I expect the price decline towards 1900, but based on the situation, from the key support levels or before the news something unpredictable may happen. The priority is to sell.
Sincerely R. Linda!

GBPAUD →Technical pullback, after which the growth will continueFX:GBPAUD forms a reversal pattern at the base and support of the lateral range of 1.86094. The implementation phase of the set-up leads to the strengthening of the currency pair to 1.88950. The technical pullback begins, which may reach the retest of SMA-200.
The price is inside the range. From the support we see active price strengthening towards resistance. The strategy of trading inside the range is simple - it is worth to focus on the resistance and support of the flat.
At the moment correction is forming, which may be directed towards 0.382 Fibo or to SMA-200, as we have an uptrend, these levels are the key for possible entry point.
Support levels: 1.87738, SMA-200, 0.382 fibo
Resistance levels: 1.88200, 1.89214
I expect the end of the technical pullback in the area of 1.87738-1.87450 with further strengthening of the currency pair to 1.89214 or to 1.90350.
Sincerely R. Linda!

GOLD → Possible scenarios for the situationOANDA:XAUUSD still looks quite bearish. The bulls continue to hold the 1939 level and then we are reminded of the Market Maker traps. What could happen?
We continue to see a strong consolidation, which is formed by dynamic sellers and limit buyers, who put limit orders in the 1939 area (there was a false breakout earlier).
There is a huge volume of liquidity, and a breakthrough on one side of the range will form a strong surge of volatility and volume. Below I would like to offer some scenarios, which, in my opinion, are relevant at the moment:
Everything depends on how the price behaves near one of the key levels.
It could be a rebound, a breakout, or a false breakout, but at the moment I look at gold as an instrument that is getting ready to fall.
Support levels: 1947, 1939
Resistance levels: SMA50, range resistance, SMA200
I expect that resistance will affect the price predictably and we will see the price continue to fall to 1939 followed by the possibility of a support breakout.
Regards R. Linda!

KLAYUSDT → Buyers are breaking resistance. What to expect next? BINANCE:KLAYUSDT has been forming a downward range for several months. After touching the lower boundary of the wedge, the price forms an active strengthening and breaks the resistance of the range. What to expect from the coin?
Above the level of 0.1551, near the wedge resistance, a pre-break consolidation is formed. Today we see the realization of the accumulation and the price breaks the resistance of the figure. This is quite a strong signal that a trend change attempt and a strong momentum may form.
BINANCE:BTCUSDT starts to strengthen and pulls some of the cryptocurrency market with it.
The entire market has been in a freeze lately amid fundamental circumstances, one of which is the SEC claims against major cryptocurrency exchanges.
Support levels: 0.1551, the previously broken wedge boundary
Resistance levels: 0.1663, 0.1933
The bulls are trying to take the situation into their own hands, but resistance at 0.1663 separates us from a strong growth. If the buyers will manage to overcome this area, then the market can show active strengthening to 0.2340.
Regards R.Linda!

Bitcoin - The biggest bull trap in history!
In the past few days, Bitcoin has been pumping, which I was expecting. I share all trades that I make transparently. But this pump is something that we need to be aware of!
Clearly, this falling wedge pattern is coming to an end, because it has been a pretty long time. The price of Bitcoin is stuck in this "range". My ideas on it are the following: We are going to see a bullish breakout above the wedge, just right at the 0.618 FIB. All traders usually try to buy this breakout, but they probably don't know that there is a 0.618 FIB retracement just above the breakout level. Which is definitely an opportunity to short Bitcoin, not long! The next scenario I see is that we are going to see another touch on the upper trendline of the wedge, and after that, we are going to go down in a classic way.
I do not expect any strong bullish uptrend above 30k at all, and I am not buying Bitcoin, but we can trade it on futures.
From the Elliott Wave perspective, this wedge looks like a leading first wave diagonal pattern, which suggests the start of a huge crash. Now we are in wave (2), which is usually pretty strong and steep, so we can end wave (2) pretty soon!
I want to short Bitcoin at the 0.618 FIB retracement, if the price comes to this level! Otherwise, I trade altcoins on futures.
We have an unfilled CME GAP at 21k, do not forget it. But I think we are going to go even lower, to 15k or 10k. But I think if we really want to start a bull market, we need to fill the GAP before a new all time high!
This analysis is not a trade setup; there is no stop-loss, entry point, profit target, expected duration of the trade, risk-to-reward ratio, or timing. I share my trades transparently and post trade setups privately.
Thank you, and for more ideas, hit "Like" and "Follow"!

ETHEREUM long setup Hello Traders, here is the full analysis for this pair, let me know in the comment section below if you have any questions, the entry will be taken only if all rules of the strategies will be satisfied. I suggest you keep this pair on your watchlist and see if the rules of your strategy are satisfied. Please also refer to the Important Risk Notice linked below.

LINA new volume and new ascending channel 🚀💣🚀Hello 🐋
based on the chart
the price is in the ascending channel and become close to the round number and the channel resistance, and after a long time range and correction to the downside again we can see new volume for the price 📖
if
the price breaks the channel resistance to the upside, we can see even more gain for the price in log term targets 🚀💣
Please, feel free to share your point of view, write it in the comments below, thanks 🐋

📈 HOW TO: ASCENDING TRIANGLE PATTERN📍 What Is an Ascending Triangle?
This pattern emerges when the price movement allows for a horizontal line to be drawn across the swing highs, while a rising trendline is drawn along the swing lows. These two lines together form a triangle shape. Traders actively monitor triangle patterns for potential breakouts, which can occur either upward or downward.
Ascending triangles are often referred to as continuation patterns because they typically result in a breakout in the same direction as the prevailing trend that was present before the triangle formation. This pattern offers traders a clear entry point, profit target, and stop-loss level, making it a tradable opportunity. It is worth noting that an ascending triangle can be distinguished from a descending triangle.
📍 How to Identify and Use the Ascending Triangle Candlestick pattern
To identify the ascending triangle pattern, you need to look for a period of price consolidation within an ongoing uptrend. During this phase, the price will exhibit a series of lower highs and higher lows, indicating a temporary balance between buyers and sellers. The upper resistance line of the pattern can be found by connecting at least two highs within the consolidation phase, while a rising trendline is drawn by connecting at least two higher lows.
Confirming the pattern involves ensuring that the price was in a clear uptrend before the consolidation phase, the upper resistance line is horizontal or slightly slanted upward, and the rising trendline intersects with the upper resistance line. Additionally, analyzing candlestick patterns within the consolidation phase, such as doji, hammer, or engulfing patterns, can provide further confirmation of buying pressure.
Once the ascending triangle pattern is confirmed, traders can set their entry and exit points. Typically, a long position is entered when the price breaks above the upper resistance line, indicating a bullish breakout. The height of the triangle pattern can be used to estimate a target price level, and a stop-loss order should be placed below the pattern to manage risk.
💥 Key Takeaways
🔹 Ascending triangles are considered a continuation pattern, as the price will typically break out of the triangle in the price direction prevailing before the triangle, although this won't always occur.
🔹 The trendlines of a triangle need to run along at least two swing highs and two swing lows.
🔹 A long trade is taken if the price breaks above the top of the pattern.
🔹 A short trade is taken if the price breaks below the lower trendline.
🔹 A profit target is calculated by taking the height of the triangle, at its thickest point, and adding or subtracting that to/from the breakout point.
🔹 A stop loss is typically placed just outside the pattern on the opposite side from the breakout.
👤 @QuantVue
📅 Daily Ideas about market update, psychology & indicators
❤️ If you appreciate our work, please like, comment and follow ❤️

TATAPOWER rising channel On the chart we can see a rising channel. Looks like the price may stay in this upsloping channel, a bit longer.
We can entry short at the upper boundary.
Invalidation of this thesis would be if the price breaks above the upsloping resistance line.

AUDJPYAUDJPY is trading is bullish parallel channel and currently trading at top of the channel which also acting as the resistance to pair. Will the bear take benefit from these confluences and push price to lower side?

LTCUSDT LTCUSDT is trading in long term bullish channel. Currently the instrument creating support near the channel bottom, and seems like preparing for another bullish leg.
