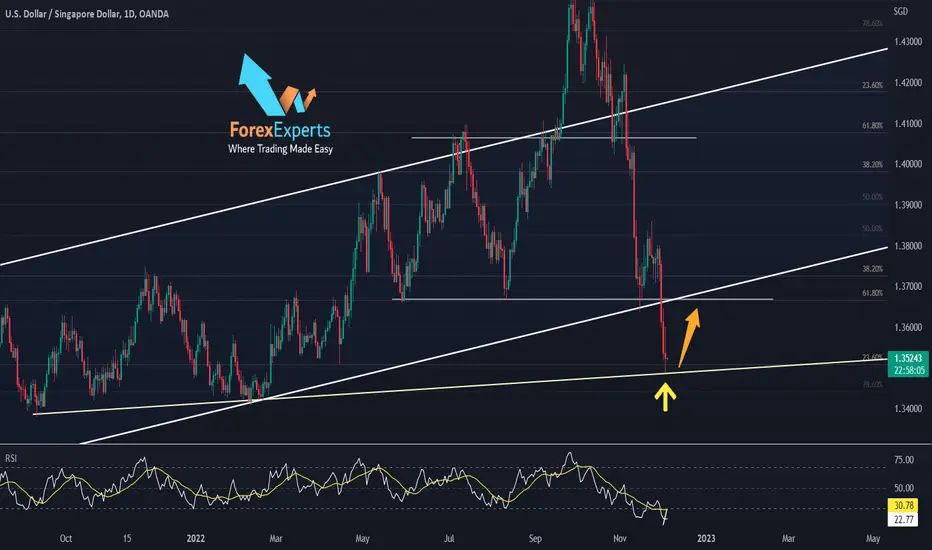
USDSGD coming back for a retestAfter USDSGD has escaped the ascending channel and the head and shoulders pattern, it is now touching an ascending trend line starting back from Sept 21 and touched again on Feb 22, also touching a 23.6 fib level,
currently looking to retest the previous support (neckline) and a 61.8 fib, which is now resistance @1.366, and also the lower channel line. Which was broken earlier.
in a 1-hour time frame appears to print a divergence on the RSI indicator, which indicates that we might have a change in the direction
--------------------------------
Feel free to share your thoughts in the comments, and kindly support the idea with a like. Your support is greatly appreciated!
Ascending Channel
AutodeskAscending Parallel Channel
Formation of HH and HL
Entry @ current Level
Trade with specified Stop Loss
TP levels are specified
Ride the trend with trailing stop Loss

AUDSGD - ascending trend channelHello! Here you have a quick analysis on AUDSGD, which is currently moving in an uptrend. We can expect another move up, creating a higher high on a daily timeframe. EMAs and MACD are also bullish, so we have multiple factors of confluence.

4 bearish targets converge on DXYWe just recently reached the breakdown target for the ascending h&s pattern with the pink neckline when price fell to 109.2. Our next target is for the slightly bigger head and shoulders with the bluish green neckline at 106.9 which we are now very close to reaching. the next breakdown target after that is for both the largest h&s pattern with the yellow neckline at around 104.69. This also happens to be the exact breakdown target for the purple channel if it confirms its breakdown in this zone. We can see we just recently closed 1 daily candle below the purple channel, and our follow up candle has already so far as of now retested the bottom trendline of the purple channel as resistance..should this candle close below the purple channel as well that greatly increases the probability it will confirm the breakdown from the purple channel. The final breakdown target at 104.39 is for breaking down from the red descending channel. We can see that both the red breakdown target and the yellow/purple take us to a very crucial horizontal trendline which is currently being overlapped by the 200ma(in blue) If DXY cant get price action back above the purple trendline soon odds are good it will retest the 200ma and this horizontal line as well. *not financial advice*

Going Long on NFLX!The stock shows strong support by bullish parallel channel as well as confluence of a bounce back from C retracement arm of ABCD harmonics pattern.
The buy time is just right, and buyers should aim high to 336 price.

Bitcoin - 1 million USD (You have never seen this before)
You see this ascending parallel channel for the first time! The channel is projected from the start of the bull market in 2018 to the end of the bull market in 2021.
The road to 1 million will be full of traps, liquidations, scams, and frauds. But if you are ready for a roller coaster, you can hold your bitcoins in cold wallets such as Trezor, where they will be frozen to death.
This is a projection because, of course, no one can predict the halving dates. I want to show you how Bitcoin can behave on the road to 1 million USD.
This parallel channel should be sustainable over time; there is not too much pressure, and we can reach 1 million in 2037. But for now, we are in 2022, and the current price is 16,500 USD.
As you can clearly see, Bitcoin could reach 6,500 USD next year to touch the bottom of the parallel channel. I don't see any problem with that.
Who will get rekt after FTX? Let me know in the comment section right now!
Bitcoin is extremely volatile and dangerous asset, they said. If you bought the peak, then yes, it's dangerous.
Thanks for your attention!

EURUSD - Buy callA strong entry point can be seen on the currency by considering following indications:
1. A bullish rally
2. Morning start pattern (bullish candlestick)
3. Well-respected bullish parallel channel
4. A bounce from the bullish ABCD harmonics pattern (on daily chart)

NZDUSD : POTENTIAL SHORT POSITIONI am looking forward to a short term sell after a rejection at the third touch of the ascending channel, down to the low support level.

GOLD (XAUUSD) BEARISH MOMENTUM FORECASTHead and shoulder formed at the third touch of the expanding channel, followed by a bearish impulsive break.
Looking forward to some further bearish momentum after the formation of a corrective structure at the moment either in the form of an ascending or expanding channel.

Decending Channel + weak bullish signalThe end of an ascending channel and the beginning of a descending channel.
As we can see the RSI indicator is in an overbought zone for some hours, however the MACD weren't strong enough to continue going up after crossing the signal line and went down again, so the candles continues to make HL and just two HH.
The BB moving average was crossed but just with two shadow candles and the second one was a bearish candle followed by a full bearish candle

GBPUSD-Weekly Market Analysis-Nov22,Wk4It's amazing that for more than a week, the market trial along the tip of the ascending channel; shows that the market has hesitance to break and close above the channel.
That is excellent news, as I plan to short the GBPUSD off the Weekly Resistance Level. You could check the related ideas within the tradingview post for my lower timeframe strategy.
If a break and close above the parallel channel happens, I will wait for a candlestick pattern confirmation at 1.2572 for a Bearish Butterfly Pattern. The harmonic pattern has the potential to form within the next consolidation zone, which is great for extension patterns like the Butterfly Patterns.

Gold - US Dollar - Parallel Channel XAUUSD - Long - Ascending Parallel Channel with support and resistance. ( November 17)

XAUUSD - Gold Long against USD The bulls have defended well-respected bullish channel (highlighted above) aggressively. The prices are likely to stay bullish for the upcoming days.

GOLD 4 steps trading (short position) ❌🧨Hello 🐋
Based on the chart
the price is close to great monthly resistance area ✔️
if
the price doesn't break resistance zone to the upside, we will see more correction to the downside ❌🧨
Please, feel free to share your point of view, write it in the comments below, thanks 🐋

Bitcoin - The strongest support right now! 0.618 FIB
Today I woke up and saw a massive red dildo and I have to make an update and give you an idea, so keep reading!
As you can see on the chart, the price went down pretty significantly, but is it really a problem? I don't think so.
I detected an impulse wave that was completed a few days ago, and we are retracing this wave. There is nothing wrong with that. Currently we are at the 0.618 FIB retracement, which is a classic correction for an impulse wave (1).
The 0.618 FIB is a very healthy correction and usually the majority is selling while the smart money is buying.
If you think Bitcoin is going to 13k, let me know in the comment section.
Counter-trends are usually very steep, which can be seen on this chart.
Bitcoin is very weak compared to altcoins, very weak. This is an indication of an alt season to me.
For more analysis, hit "Like" and "Follow"!

Bitcoin - Next week will be extremely bullish!
It looks like next week will be extremely bullish for Bitcon and also for the altcoins!
Price is currently moving in the ascending parallel channel, so the bulls have strong momentum.
As per my Elliott Wave analysis, the first impulse wave has been completed, and I expect another 2 impulse waves to the upside.
23 000 USD next week is definitely possible!
There are no gaps that need to be filled on this chart, which looks safe.
The chart is printing a bullish flag, so wait for a breakout for confirmation!
I wish you massive profits!
I expect tremendous gains for selected altcoins. You can find them in the related section down below.
For more analysis, hit "Like" and "Follow"!
