$Bitcoin seems to be in need of some correctional breath.Hello guys,
As we all know there can't be only one directional move in any healthy financial asset. It seems the digital gold is somehow in an exhausted state since we have been watching the Bulls strong accumulation since the first day of the ETF approval.
As we predicted earlier this week about its possible bearish momentum formation this bearish behavior continues to be seen on Bitcoin's short term market price action. For now I am watching closely for this bearish triangle breakout and a successful retest. As far as things go as it is and since the weekend is here and market might not move strongly, there is a high probability for Bitcoin to see some correctional move.
I will be updating the idea after collecting some more market indications.
Stay Tuned.
Disclaimer :
The opinion expressed here is not an investment advice – it is provided for informational purposes only. It does not necessarily reflect the opinion of #CryptoTalk-ET rather it is authored and complied by one of its founding member and article contributor. Every investment and all trading involves RISK, so you should always perform your own research prior to making decisions. We do not recommend investing money you cannot afford to lose.
With Regards.
Nathnael B.
Ascending Triangle

SWING IDEA - GRINDWELL NORTONGrindwell Norton invites attention as it positions itself for a potential breakout. This exploration delves into the compelling factors shaping a promising swing trading opportunity.
Reasons are listed below :
Grindwell Norton has undergone rigorous testing at the 2320 levels, displaying resilience and now gearing up for a potential breakthrough.
A bullish ascending triangle pattern is unfolding, suggesting an imminent breakout as the stock converges towards higher levels.
The weekly timeframe reveals a powerful bullish signal in the form of an engulfing candle, hinting at a shift in market sentiment and the potential for upward momentum.
Witnessing a consistent pattern of higher highs, Grindwell Norton exemplifies a robust upward trajectory, reinforcing confidence in the prevailing bullish trend.
Trading above both the 50-day and 200-day Exponential Moving Averages (EMAs) on the weekly chart, the stock exhibits strength and stability, enhancing the overall technical outlook.
A notable increase in volume activity aligns with recent price movements, adding weight to the potential breakout scenario.
Target - 2635 // 2864
Stoploss - weekly close below 2200
DISCLAIMER -
Decisions to buy, sell, hold or trade in securities, commodities and other investments involve risk and are best made based on the advice of qualified financial professionals. Any trading in securities or other investments involves a risk of substantial losses. The practice of "Day Trading" involves particularly high risks and can cause you to lose substantial sums of money. Before undertaking any trading program, you should consult a qualified financial professional. Please consider carefully whether such trading is suitable for you in light of your financial condition and ability to bear financial risks. Under no circumstances shall we be liable for any loss or damage you or anyone else incurs as a result of any trading or investment activity that you or anyone else engages in based on any information or material you receive through TradingView or our services.
@visionary.growth.insights

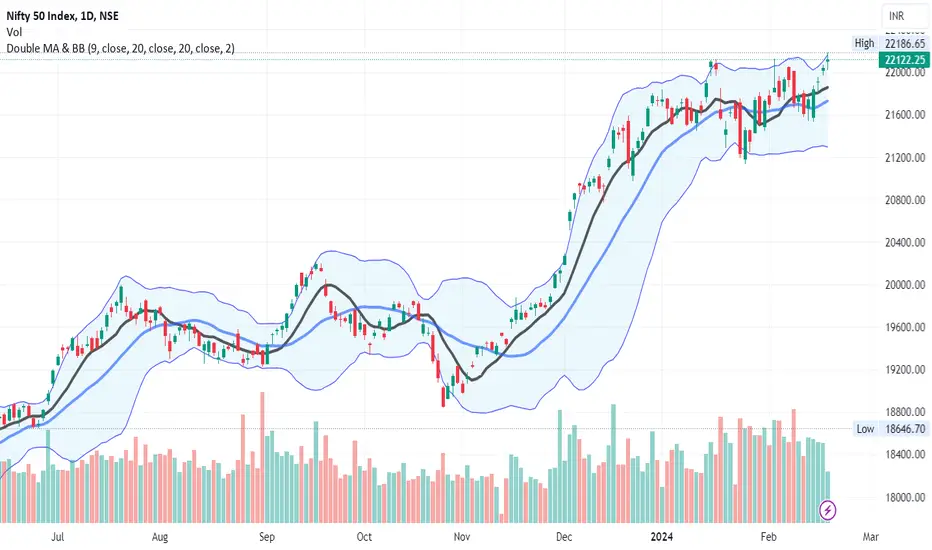
NIFTY DAILY - 19/2/2024Fifth winning strike of bulls and Nifty50 made All the Time High that is 22186.
Nifty has form green body candle with long upper and lower shadows.
Currently candle is trading near upper band of Bollinger Band.
Index is forming Ascending Triangle So further uptrend can be seen towards 22381 with support of 21939 level.
⚠️ Important: Always maintain your Risk & Reward Ratio.
✅Like and follow to never miss a new idea!✅
Disclaimer: I am not SEBI Registered Advisor. My posts are purely for training and educational purposes.
Eat🍜 Sleep😴 TradingView📈 Repeat 🔁
Happy learning with trading. Cheers!🥂
FAIRCHEM OR : Multibagger Returns Soon !!FAIRCHEMOR stock has made Big Broadening Pattern
And around the support of Broadening pattern stock has made Ascending Triangle pattern
Also Stock has given Breakout of Ascending Triangle pattern
We can clearly see Breakout with Huge Green Candle!!!!
Stock can show 2100 levels in coming weeks
Which is 50% from here on.
Broadening Pattern target is 3000+
Which is more than 100% From current price.
Disclaimer : We are not SEBI registered analyst. Do your own research before taking any investment decision.
#stock #stockmarket #investing #money #finance #trading #investment

Ether's Ascending Support Line at Critical PointJust like in BTC and everywhere else in the crypto markets, the trading volumes on ETH are also very low.
However, the main difference from BTC is that Ether's supply is now deflationary. Since the merge of the new consensus mechanism; Ether's circulating supply has been going down. (The first year in deflation).
And alongside this data, on-chain metrics show that ETH's total addresses with balance are at all time high levels >97.5m; total staked ETH are above 26m and that is a 20% increase over the last 90 days; with 127k depositors (stakers) over 17.7% increase in the 90 days.
The chart also looks promising with an ascending support line, however, it is at a very critical zone now. If it breaks down from here; we may see test of the previous resistance trend which I highlighted with dotted red line. Right now, we are testing the
But, due to the bullish fundamentals and on-chain metrics of ETH, I am expecting a bounce from here. Also, please keep in mind, I am a bit biased as I am a believer in Ether becoming the smart ledger of the world's assets.
Please do your own research,
Good luck!

LUNA in Coming Days.Hi.
COINEX:LUNAUSDT
😊Today, I want to analyze LUNA for you in a 4h time frame so that we can have a short-term view of LUNA regarding the technical analysis. (Please ✌️ respectfully ✌️share if you have a different opinion from me or other analysts).
LUNA is in an ascending triangle which means the price is about to do a good bullish movement. The price can increase as much as the measured price movement ( AB=CD ) .The break out needed for increasing further has not happened but it should happen pretty soon.
Stay awesome my friends.
_ _ _ _ _ _ _ _ _ _ _ _ _ _ _ _ _ _ _ _ _ _ _ _ _ _ _ _ _ _ _ _ _
✅ Thank you, and for more ideas, hit ❤️ Like ❤️ and 🌟 Follow 🌟!
⚠️Things can change...
The markets are always changing and even with all these signals, the market changes tend to be strong and fast!!

Microsoft - It's That SimpleHello Traders, welcome to today's analysis of Microsoft.
--------
Explanation of my video analysis:
In 2019 Microsoft stock started creating a major bullish trendline which was tested again in 2020 and also the beginning of 2023. Furthermore Microsoft also broke out of a massive ascending triangle formation and is now just looking extremely bullish. If Microsoft retest the previous breakout area mentioned in the analysis, we will be looking for long continuation setups.
--------
I will only take a trade if all the rules of my strategy are satisfied.
Let me know in the comment section below if you have any questions.
Keep your long term vision.

EURJPY → A break of resistance will lead to a rise to 164.0FX:EURJPY is realizing the potential of rebound from support and forms a retest of resistance. At the moment consolidation is forming above the level, which increases chances for further growth.
Globally, the currency pair continues to form a strong bullish trend, having left the previously formed ascending channel, which is currently a strong support area. The price is retesting the resistance at 161.87, after a small correction the chances of breaking through the level are increasing. The weakness of the Japanese Yen is quite clearly shown on the quotations. The price consolidation above 161.4 will allow to overcome 161.870 and continue the growth towards the range resistance - 163.6 and 164.2.
Resistance levels: 161.87
Support levels: 161.4, 160.9
The currency pair continues to strengthen, buyers are quite active. Consolidation above 161.4, breakout of 161.87 and consolidation above this area will form a local bottom for continuation of growth.
Regards R. Linda!

XEM Starting to breakout Ascending TriangleThe ADX Has Bottomed out showing we're soon to start rising and find strength in the upcoming Trend as well as currently Oscillators are traditionally performing better.
The MACD has recently signaled a buy and we're cruising above the signal line.
We're forming an ascending triangle with the price target taking us close to the next fib line more importantly running that 50 period moving average to form a golden cross more than likely forming a new more volatile uptrend!
Watch XEM Y'all
Fib Ranges have it running between 100-400%

USDJPY Ascending TriangleUSDJPY Ascending Triangle, looking for a move higher in the short term to retest the triangle trendline for resistance.

LDO - 180% profit in a few weeks, buy now!LDO looks absolutely strong. It just hit a new all-time high a few weeks ago, and this is serious. What you want to do is buy coins that have reached an all-time high for massive profits. What is the next target? The 3.0 FIB extension is 185% far away, which is good; take profit here. Strong Elliott Wave combos (1)(2)(1)(2) provide a solid trade setup. We can see that the chart formed an ascending triangle, which is a very strong bullish pattern. Let me know what you think about my analysis, and please hit boost and follow for more ideas. Thank you, and I wish you successful trades!
Lido DAO is a decentralized autonomous organization (DAO) which provides staking infrastructure for multiple blockchain networks.
Most notably, the platform provides a liquid staking solution for Ethereum, allowing users to stake their ETH and receive stETH (Lido staked ETH) tokens in exchange, which represent the user's staked ETH and staking rewards.
Lido DAO is secured by a mix of decentralized governance, audited code and smart contracts. The Lido protocol runs on Ethereum with help from smart contracts that process user deposits and distribute staking rewards, among other functions. Several third-party security firms have audited Lido’s smart contracts in order to identify and address potential vulnerabilities.
The platform’s native token is LDO - which also serves as the governance token for Lido DAO. Holders can participate in governance proposals and vote on key decisions such as board adjustments, new integrations and platform updates. LDO holders have the right to determine the development and operation of the platform.
Lido currently supports staking for Ethereum and Polygon only with the recent sunsetting of Solana. Let me know what you think about my analysis, and please hit boost and follow for more ideas. Thank you, and I wish you successful trades!

WOOUSDT Analysis, Chart is speaking itself !!!➡️ Due to the ascending structure of the chart
- High potential areas are clear in the chart
- You can look for reasons to enter according to your own personal strategy after approval.
⏮️Previous Analysis
🤑Stay awesome my friends.
_ _ _ _ _ _ _ _ _ _ _ _ _ _ _ _ _ _ _ _ _ _ _ _ _ _ _ _ _ _ _ _ _
✅Thank you, and for more ideas, hit ❤️Like❤️ and 🌟Follow🌟!
⚠️Things can change...
The markets are always changing and even with all these signals, the market changes tend to be strong and fast!!

🔵Ethereum can easily reach $4K, technical analysis reasons!Hi.
➡️ Due to the ascending structure of the chart
- High potential areas are clear in the chart
- You can look for reasons to enter according to your own personal strategy after approval.
-AB=CD
-Cup&Handle
-Ascending Triangle
-trend line
🤑Stay awesome my friends.
_ _ _ _ _ _ _ _ _ _ _ _ _ _ _ _ _ _ _ _ _ _ _ _ _ _ _ _ _ _ _ _ _
✅Thank you, and for more ideas, hit ❤️Like❤️ and 🌟Follow🌟!

⚠️The last bullish chance of BITCOIN in Short term!Hi.
COINEX:BTCUSDT
As you can see, the price was able to break the Adam&Eve and reach the first target, now the price is in an ascending triangle , which can easily reach the desired target after the break.
🟡Summery:
-BTC has been Bullish Recently!
-The odds of another Bullish Movement is High!
-Bullish Pattern is Visible on The chart!
-AB=CD
- On the way to 45k [ /i]
🤑Stay awesome my friends.
_ _ _ _ _ _ _ _ _ _ _ _ _ _ _ _ _ _ _ _ _ _ _ _ _ _ _ _ _ _ _ _ _
✅Thank you, and for more ideas, hit ❤️Like❤️ and 🌟Follow🌟!
Previous Analysis:
⚠️Things can change...
The markets are always changing and even with all these signals, the market changes tend to be strong and fast!!

NVDA Ascending Triangle on the 4HrKeeping an eye on this Ascending Triangle on the 4Hr. A breakout could bring a 30 Point gap up.

Dymension(DYM) is Ready Go UP🚀➕20%🚀🔥Project Dymension(DYM) as been launched in exchanges for less than 3 days, and today I am trying to share an opportunity for you to buy DYM token .
📚What Is Dymension(DYM)❗️❓
Crypto apps are in dire need of ease of use and economic sustainability. Recently, rollups have shown a simple business model that works, fees minus base layer costs equals their profit. As a result, a surge of L2s were deployed each with its own custom implementation, multi-sig bridge, and security assumptions. This led to a fragmented, unsecure, and chaotic user experience diminishing the advantages of rollups and modular blockchains.
✅ Dymension(DYM) was able to break the 🔴 Resistance zone($6.40-$6.08) 🔴.
📈From the point of view of Classical Technical Analysis , Dymension(DYM) seems to have succeeded in forming the Ascending Triangle .
🔔I expect Dymension(DYM) will go UP to 🟡 Potential Reversal Zone(PRZ) 🟡.
❗️⚠️Note⚠️❗️: An important point you should always remember is capital management and lack of greed.
Dymension Analyze (DYMUSDT), 15-minute time frame ⏰.
Do not forget to put Stop loss for your positions (For every position you want to open).
Please follow your strategy; this is just my Idea, and I will gladly see your ideas in this post.
Please do not forget the ✅' like '✅ button 🙏😊 & Share it with your friends; thanks, and Trade safe.

NALCO (NATIONAL ALUMINIUM) - SWING TRADING ANALYSISAfter a very long consolidation in a form of Ascending triangle a good breakout is there with a good volume.
Disclaimer - All information on this page is for educational purposes only,
we are not SEBI Registered, Please consult a SEBI registered financial advisor for your financial matters before investing And taking any decision. We are not responsible for any profit/loss you made.
HAPPY TRADING GUYS
@Jagadheesh_Jk

🚧GTAI is Bullish now🚧 & many Traders don't see it 👀!!!Hi .
KUCOIN:GTAIUSDT
✅ Today, I want to analyze GTAI for you in a 2H time frame so that we can have a Short-term view of GTAI regarding the technical analysis. (Please ✌️ respectfully ✌️share if you have a different opinion from me or other analysts).
➡️ As you can see, the price completed its downward waves ( ABC )after breaking Rising Wedge, and now it's time to confirm the breaking of the ascending triangle, After then The price will rise And starts 5 WAVES ascending and rise up to top of Channel.
Stay awesome my friends.
_ _ _ _ _ _ _ _ _ _ _ _ _ _ _ _ _ _ _ _ _ _ _ _ _ _ _ _ _ _ _ _ _
✅ Thank you, and for more ideas, hit ❤️ Like ❤️ and 🌟 Follow 🌟!
⚠️ Things can change...
The markets are always changing and even with all these signals, the market changes tend to be strong and fast!!

🚧Bitcoin is Bullish now🚧 & many Traders don't see it 👀!!!Hi.
COINEX:BTCUSDT
As you can see , t he price was able to break the cup&handle and reach the first target, now the price is in an ascending triangle, which can easily reach the desired target after the break.
🟡 Summery:
-btcT has been Bullish Recently!
-The odds of another Bullish Movement is High!
-Bullish Pattern is Visible on The chart!
-AB=CD
-On the way to 45k
🤑Stay awesome my friends.
_ _ _ _ _ _ _ _ _ _ _ _ _ _ _ _ _ _ _ _ _ _ _ _ _ _ _ _ _ _ _ _ _
✅ Thank you, and for more ideas, hi t ❤️ Like ❤️ and 🌟 Follow 🌟!
⚠️ Things can change...
The markets are always changing and even with all these signals, the market changes tend to be strong and fast!!
Previous Analysis:

⚠️Upclining USDT dominance !Hi.
USDT.D
- The Tether market dominance chart shows that CRYPTOCAP:USDT has maintained support around 5.60%
-As long as this support holds, the crypto market is likely to see further downturns🔻
-More confirmation of trend changes is needed before entering bullish positions.
Stay awesome my friends.
_ _ _ _ _ _ _ _ _ _ _ _ _ _ _ _ _ _ _ _ _ _ _ _ _ _ _ _ _ _ _ _ _
✅ Thank you, and for more ideas, hit ❤️ Like ❤️ and 🌟 Follow 🌟!
⚠️ Things can change...
The markets are always changing and even with all these signals, the market changes tend to be strong and fast!!

AUDJPY Ascending Triangle Pattern BreakoutWe expect further downside on this pair, signalled by the ascending channel pattern breakout. We can also see the breakout of a counter trendline which further supports our directional basis.

✅GTAI's Situation: What Shall we Expect, can ascend further?Hi every one
➡️ As you can see, GTAI has grown well since its introduction. After the broken of Falling Wedge, started 5 upward wave and successfully completed it, and then started a corrective wave, which it has now completed. Now it's time for it to start its upward wave, and considering that the price is now in an ascending triangle.
-Hidden divergence has occurred, this signal can be strong.
➡️ second scenario:
If the first scenario failed , we can look at the second scenario. In the second scenario, the price can form a bullish flag, which can have a good growth after breaking the price.
🤑Stay awesome my friends.
_ _ _ _ _ _ _ _ _ _ _ _ _ _ _ _ _ _ _ _ _ _ _ _ _ _ _ _ _ _ _ _ _
✅Thank you, and for more ideas, hit ❤️ Like ❤️ and 🌟 Follow 🌟!

GROK BULL RUN STILL POSSIBLEGood morning traders
A few days ago i posted about GROK and the potential it has of starting its bull run
We seen a heavy sell off last night back down to a previous support level that was set in the previous weeks
If we take a look at the volume it shows that it could be a measured move for traders to add more to their bags at lower prices before the bull market resumes
I am still very bullish on GROK at this time and the cup and handle pattern is still valid
An invalidation would be shown when the bottom of the cup pattern is breached and closed lower
Until then i will continue to add to my GROK holdings at a discount
Another thing to point out is we have now started to form a bullish ascending triangle pattern on all higher timeframes and we could be in for a bit of sideways action until around 4th February 2024 by which time i do believe we can break to the upside depending on other fundamental factors involved
Thanks for reading and if you could leave a like and a follow i would be very grateful as this helps me reach more users with my market analysis
MY TAKE ON COMMUNITY...
Do not join their telegram channel as if you ask any questions they will mute you pretty quickly and the moon kids will give you abuse for not living in pure hope alone, I found their community very toxic from the off and i left within 5 minutes, not a good luck for them as a team of mods with selective punishment based on their moon boy energy
Don't become a moon boy, it is not logical to invest in to something based on hope, do your own due diligence and more if you can to make yourself comfortable with your investment decisions
Enjoy the rest of your day!
