CGF - Another Buying OpportunityCGF has pulled back as anticipated, and is expected to give another buying opportunity. The recent pullback seems incomplete though and may be it has a little more room to the downside before turning up. I have two scenarios:
Scenario 1 - Can go higher after forming a base and shows bullish price action
Scenario 2 - Can dip lower towards my Buy Zone and trendline Support between $4.40 - $4.70.
In both the above scenarios, my target is the same targeting the previous highs, atleast towards $6.75 (potential 40% gain).
Please note these are my own notes, by no means trading advice. Please do your own research before entering into any trade.
ASX


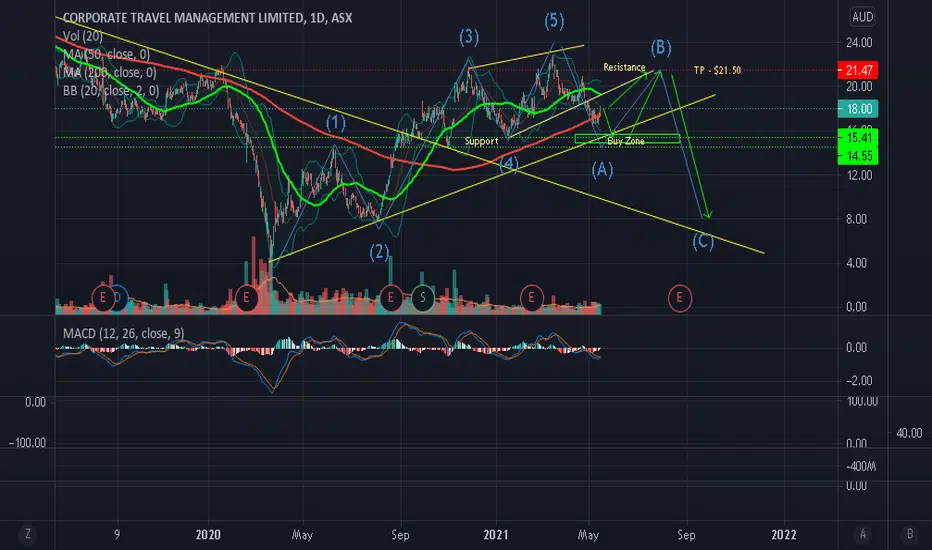
CTD - Bullish Trade PlanCTD has given an anticipated pullback lower, but the question is that, is the upside swing ready or it may go a bit lower to give a buying opportunity? I have two scenarios:
Scenario 1 - Can go higher after the recent bullish bounce i.e it may march higher.
Scenario 2 - Can dip lower towards my Buy Zone and trendline Support between $15.00 - $15.60.
In both the above scenarios, my target is the same as this could be a B wave.
Please note these are my own notes, by no means trading advice. Please do your own research before entering into any trade.

LLC - Another great Buying OpportunityLLC may be getting ready for a another buying opportunity. The current pullback is a retracement of the trend. It seems that Price is forming a base right at the edge of the channel. A close above the trendline (tentatively $12.15) could be a bullish sign and I would be a buyer . My trade plan for this trade is as follows:
TP1 - (potential gain 10%)
TP2 - (potential gain 20%)
Stoploss - 11.60
Please note these are my own notes, by no means trading advice. Please do your own research before entering into any trade

NST - Bullish Trade PlanNST has broken out of the bearish trendline with high volume. The breakout to the upside has worked worked well and this could be a confirmation of a new swing to the upside. NST has moved up since and has been consolidating within a flag pattern which is a bullish pattern and a follow through to the upside is expected, therefore I am long NST.
My trade plan is given below:
TP: $12.50 (potential gain - 12%)
Stoploss - $10.15
Please note these are my own notes, by no means trading advice. Please do your own research before entering into any trade.

ADV Possible upcoming trendConsidering the numerous support areas along with trend lines; I expect a change in trend direction....
Don't forget to wait not only for a break of the red area, and a retest; but also for a bullish candle stick pattern to take a long position.
ASX:ADV

NXL.ASX_Breakout Trade_ShortENTRY: 4.03
SL: 4.70
TP1: 3.51
TP2: 2.39
- ADX>20
- RSI<50,RSI>30
- Daily RS N/A
- Daily FFI -ve
- Daily MACD -ve
- Weekly RS N/A
- Weekly FFI -ve
- Weekly MACD N/A
- Breakdown with good volume on 29 Apr 2021
- Retraced with low volume today

NIC.ASX_Breakout and Retrace Trade_ShortENTRY: 1.155
SL: 1.300
TP1: 1.065
TP2: 0.965
- ADX<20
- RSI<50,RSI>30
- Daily RS -ve
- Daily FFI -ve
- Daily MACD -ve
- Weekly RS N/A
- Weekly FFI -ve
- Weekly MACD -ve
- Breakdown with good volume on 27 Apr 2021
- Retraced with low volume today

NWH.ASX_Range Breakout and Retrace Trade_ShortENTRY: 1.740
SL: 1.920
TP: 1.555
- ADX>20
- RSI<50, RSI<30
- Daily RS -ve
- Daily FFI -ve
- Daily MACD -ve
- Weekly RS -ve
- Weekly FFI -ve
- Weekly MACD -ve
- Breakout from range and descending triangle with decent volume on 4 May 2021

2 possible bullish scenarios for AAC Don't forget to wait for trendline break, and a retest along with bullish candle stick pattern to go long.
ASX:AAC

Long trade on AMPAMP is currently trading at all-time lows. I do anticipate price will trade sideways for some time until the company finds stability and confidence within its management, albeit not long-term.
With respect to the technicals, it is clear a double bottom has formed on the weekly time frame which has married the plummet of Covid in March 2020. I am not convinced selling pressure will continue beyond $1.05-1.06. This is a great long trade with excellent risk:reward prospects on one of Australia's most renowned dividend-paying public companies.
Thank you traders. Manage your risk.

GXY.ASX_Range Breakout Trade_LongENTRY: 4.04
SL: 3.65
TP1: 4.49
TP2: 5.34
- ADX>20
- RSI>50, RSI>70
- Daily RS +ve
- Daily FFI +ve
- Daily MACD +ve
- Weekly RS +ve
- Weekly FFI +ve
- Weekly MACD +ve
- Breakout with decent volume on 14 Apr 2021
- Breakout with ok volume today. Prefer to be higher.

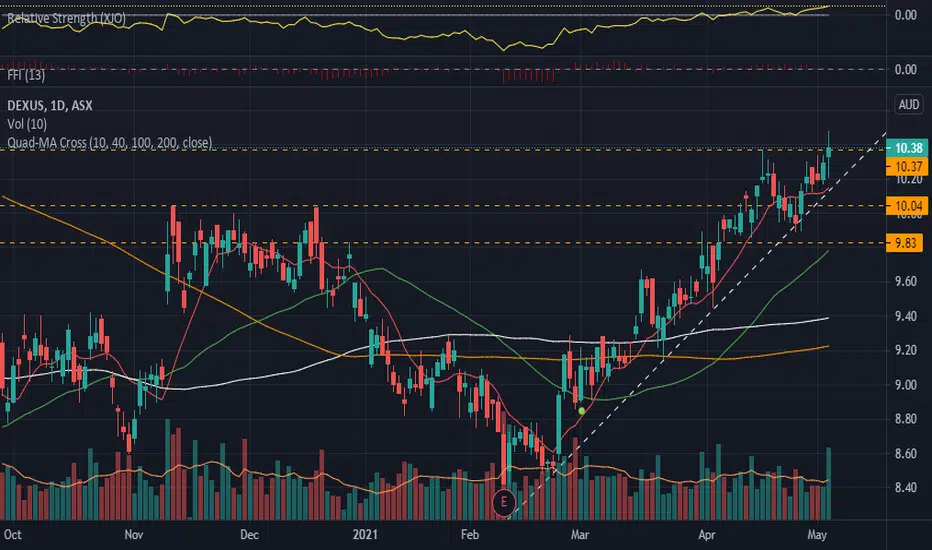
DXS.ASX_Range Breakout Trade_LongENTRY: 4.04
SL: 10.43
TP1: 11.49
TP2: 13.51
- ADX>20
- RSI>50, RSI<70
- Daily RS +ve
- Daily FFI +ve
- Daily MACD +ve
- Weekly RS -ve
- Weekly FFI +ve
- Weekly MACD +ve
- Breakout with good volume today. Prefer a better closing.
XJO - no time to panicThe ASX has just broken its ATH on Monday at 7172 (although I'm told if you add in dividends, we're actually quite a bit higher). However, the moves today (and likely tomorrow judging by the US futures), will likely cause some concerns amongst traders. Its a relatively big move (at least for the last couple of months), but in the scheme of things, today is just 1% down.
From what I'm seeing the XJO just slightly above Monday open and around the high point of Friday. Nothing to worry about here.
In addition, the overall trend is still up and the Bollinger bands are starting to expand again after tightening last week.
TO me the ASX actually looks like it has broken out from a range it was stuck in over most of April, this could just be profit taking or a pullback after a big move yesterday. Although I suspect that it's entirely being driven out of fear arising from the US Markets.
All in all, I think these are pretty bullish markers currently.
I'm watching it closely and I think the telling point will be if the 50 day MA is breached at around 6900.
Anyway, happy trading and if you like this post, check out my blog at www.nickthetraderguy.com.
Cheers,
Nick the Trader Guy

