Gold NEW ATH to $2,912?! (1H UPDATE)4H chart has hit our resistance zone & rejected. But, on the smaller TF we're currently seeing a re-distribution schematic play out on Gold ahead of its sell off which means we MIGHT see 1 more new ATH. Re-distribution schematics normally take place in between Wave 3 high, Wave 4 low & Wave 5 high.
This sell off schematic normally builds up within a 'Flat Correction' channel, which traps in early sellers & late buyers into the market. This is why it's a hard pattern to recognise.
⭕️POI 1: $2,857 - $2,848
⭕️POI 2: $2,826 - $2,817
ATH

Breaking: $BERA dips -50% Just A Day After Listing. The cryptocurrency market is no stranger to volatility, and the recent performance of BIST:BERA , the native token of Berachain, is a testament to this. Launched just yesterday, BIST:BERA has already experienced a whirlwind of price action, capturing the attention of traders and investors alike. After an initial surge of 650%, the token has since dipped by 50%, currently trading at $7 per coin. This dramatic price movement has left many wondering: Is this a temporary shakeout or a sign of deeper issues?
Technical Analysis
From a technical perspective, BIST:BERA ’s price action is forming a symmetrical triangle pattern on its daily chart. This pattern is typically a continuation signal, suggesting that the asset is consolidating before making its next significant move. The key levels to watch are the upper resistance (ceiling) and the lower support (floor) of the triangle.
- Bullish Scenario: If BIST:BERA breaks above the triangle’s ceiling, it could trigger a bullish run with an estimated upside potential of 107%. This would likely attract fresh buying interest, pushing the price toward new highs.
- Bearish Scenario: Conversely, if the price fails to break out and instead falls below the triangle’s support level, BIST:BERA could test the $5 support zone. This scenario would likely be driven by profit-taking from early investors and airdrop participants.
The current price dip of 28.06% in the last 24 hours may seem alarming, but it could also be a healthy correction after the initial euphoria. The symmetrical triangle pattern suggests that the market is undecided, and the next major move will depend on whether buyers or sellers gain control.
Berachain’s Innovative Approach to Blockchain
Beyond the price action, BIST:BERA ’s underlying technology and ecosystem are worth examining. Berachain is not just another Layer 1 blockchain; it introduces several innovative features that set it apart from its competitors.
1. Proof of Liquidity (PoL): A Novel Consensus Mechanism
Berachain’s Proof of Liquidity (PoL) is a groundbreaking consensus mechanism that aligns network security with liquidity provision. Unlike traditional Proof of Work (PoW) or Proof of Stake (PoS) systems, PoL incentivizes users to provide liquidity to the network, ensuring a more robust and efficient ecosystem.
2. EVM Compatibility and Modular Design
Berachain is fully compatible with the Ethereum Virtual Machine (EVM), making it an attractive option for developers looking to build or migrate decentralized applications (dApps). Its modular design allows for the creation of customized Layer 1 blockchains without sacrificing interoperability or performance.
3. Two-Token Model: BERA and BGT
Berachain operates on a unique two-token model:
- BERA: Used for gas fees and staking, BERA is the utility token that powers the network.
- BGT: A non-transferable governance and rewards token, BGT aligns the interests of network participants by incentivizing long-term engagement.
Market Sentiment and Exchange Listings
The current market cap of $806 million and a circulating supply of 107.48 million BERA coins indicate that the token is still in its early stages. With a max supply yet to be determined, BIST:BERA has room for growth as the ecosystem matures and adoption increases.
Conclusion
While the 50% dip may deter some investors, the technical and fundamental factors suggest that this could be a buying opportunity for those with a higher risk tolerance.
As always, it’s crucial to conduct thorough research and consider your risk appetite before investing in any cryptocurrency. BIST:BERA ’s journey is just beginning, and its future will depend on both market dynamics and the team’s ability to deliver on its ambitious vision. Whether you’re a trader or a hodler, BIST:BERA is undoubtedly a coin to watch in the coming weeks and months.

SOL 4H RANGESOLANA is down -40% from making a new ATH to the bottom of the crash wick @ $175. Looking at the chart, unless BTC decides to gap down again from a TA standpoint SOL looks good here.
A triple tap of the bottom with a reclaim of the bullish orderblock that coincides with the golden pocket zone from local LTF high to low, followed by a strong reaction from that zone. Q1 is historically good for altcoins and so the all of these points added together the R:R at this level is good IMO.
Profit taking through the range quarters.
The idea is invalid once price accepts below the triple tap bottom under $170.

TOTAL DAILY The flash crash of Monday took TOTAL all the way down under the previous cycles high and tapped the 1D 200 EMA before reacting well to move price between the DAILY RESISTANCE & SUPPORT.
For me I still think crypto has space to grow, seasonality tells us the first quarter of a bullrun year is great in terms of returns with a tail off in Q2-3, coupled with the US administration being pro crypto and the looming strategic reserve getting closer, ETFs relentlessly buying Bitcoin, same with MicroStrategy.
The two entry options for me are when the wick gets filled and a reclaims the '21 ATH once again, that would sweep the demand zone and take out a lot of stop losses before targeting the DAILY RESISTANCE and the HIGHS.
Another entry would have to be a reclaim of the DAILY RESISTANCE, I would be worried that the wick still needs filling but maybe it would be during the bear market. For that reason a close SL would be useful.

Bitcoin Down: Tariffs to Blame?I wake up to read that both equities are Bitcoin are down on Tariffs as the "reason." Is this true? More importantly, is knowing this valuable? I don't think so.
The media needs to write some narrative every day to get read and sell ads. So they take the latest buzz and craft it into a "reason" price moved the way it did. The trouble is that this information is is useless for traders and investors. Once the article is written the move has happened. There is nothing to profit nor more importantly LEARN from having this knowledge. It is a singular event; no long term consistent strategy can be crafted from a single thing happening once.
Bitcoin was already breaking down since January 20th. That day failed a big test of the prior All Time High. INDEX:BTCUSD has actually never closed higher than December 17th.
To emphasize the point more if one looks at the mainstream financial news they are also blaming today's equities route on tariffs. The truth is that stocks only seemed to have a bullish January. The S&P 500 futures never actually made a new high beyond the post-election pump in January.
Traders have to make plays BEFORE the news happens. The only way to do that is by watching charts for opportunities and reading the simple signs. Trade wisely!

Breaking: SpaceN ($SN) Surge Over 2000% Amidst Market VolatilityThe cryptocurrency market has witnessed yet another jaw-dropping rally, with SpaceN ( NYSE:SN ), an NFT one-stop investment management tool, surging over 2000% within a single day. This sudden price explosion has raised several questions regarding the sustainability of such gains, given the token’s 1 billion total supply and only 40 million currently circulating in the market.
Market Overview & Trading Activity
SpaceN’s impressive surge has propelled its market capitalization to approximately $44.99 million, ranking it #846 on CoinGecko. However, a major concern among skeptics is the low trading volume relative to its market cap. With a reported $608,223 in 24-hour trading volume, many are questioning the legitimacy of such a steep price increase on a token with a fully diluted valuation (FDV) of over $1.12 billion.
Despite the concerns, the token has shown resilience, outperforming the broader crypto market, which is down -0.80% in the last week. Over the past seven days, NYSE:SN has seen a price increase of 420.40%, making it one of the best-performing assets within the BNB Chain ecosystem.
Technical Analysis
Following its remarkable rally, NYSE:SN experienced a sharp retracement, currently trading down 2.72% at the time of writing. While such a correction is expected after a parabolic move, the price action remains above key moving averages (MA), hinting at a potential second leg up.
Support & Resistance Levels: The recent all-time high (ATH) of $6.15, recorded on January 29, 2025, is a crucial resistance point. If bullish momentum picks up, a move toward this level is possible, with $5 acting as a pivot zone.
Volume Concerns: The lack of significant trading volume and the reliance on Gate.io as its primary exchange raises questions about liquidity. A listing on a top-tier exchange such as Binance or KuCoin could be a major catalyst for further price appreciation.
Trend Outlook: NYSE:SN is trading within a falling trend after the initial spike. However, if the daily candlestick closes in a bullish structure, a potential retest of key resistance zones could lead to renewed momentum.
The Promise of SpaceN
Beyond the price action, the fundamentals of SpaceN provide an interesting case for long-term adoption:
- NFT Management Tool: SpaceN aims to be a one-stop investment management platform for NFTs, allowing users to track investment income, stay updated on NFT projects, and access NFT-focused social circles.
- DAO Functionality: Users can create self-organized DAOs, trade NFTs, and build communities based on shared holdings.
- BNB Chain Ecosystem: Being built on the BNB Chain, SpaceN could benefit from future integrations and potential ecosystem expansions.
Final Thoughts: Is There More Room to Run?
Despite its meteoric rise and subsequent correction, NYSE:SN remains a token to watch. The low trading volume relative to market cap presents some red flags, but the token’s fundamentals and the broader NFT sector’s growth could provide the necessary fuel for another push higher. A key factor will be whether SpaceN secures additional exchange listings and maintains bullish technical indicators.
For traders and investors, keeping an eye on volume trends, resistance levels, and exchange-related news will be crucial. If momentum returns, a push toward $5 and potentially reclaiming its ATH could be on the table. However, caution is advised, given the volatile nature of such explosive moves.
Will NYSE:SN continue its rally, or was this a one-off spike? The next few days will be critical in determining the trajectory of this NFT-focused token.

TradeCityPro | EOSUSDT Seeking Structure Formation👋 Welcome to TradeCityPro Channel!
Let’s analyze another altcoin on our watchlist, one of the oldest altcoins, which has experienced two bull runs so far.
📊 Weekly Timeframe
In the weekly timeframe, it’s still one of those coins that remains within its long-term range box, which has lasted nearly 1,000 days.
Recently, by making a fake breakout of its last support at 0.4485, it had an attractive upward move and reached the top of its range box at 1.3255.
I haven’t held this coin myself and probably won’t buy it in the future either, but you can make your purchase either after the box ceiling breakout or take early triggers in lower timeframes.
Now, why won’t I buy it? Because coins like EOS or LTC, which are old, didn’t even reach their previous highs during the last bull run, or at most, moved up to those levels, which isn’t very appealing.
📈 Daily Timeframe
In the daily timeframe, however, it’s one of those coins that stands a notch above others and hasn’t returned to its daily range box, holding above higher supports.
The 0.7558 level is highly significant as it represents both 50% Dow Theory wave retracement and 0.5 Fibonacci level, making it a PRZ (Potential Reversal Zone). Losing this level could delay the next bullish move, but after that, the 0.6192 level will also hold great significance.
After our move to 1.3703 and its correction, our volume has been decreasing on the retracements and increasing on every upward move—this is a good sign for bullish continuation. If, in the coming days, sellers fail to break the 0.7558 support, we might see continued range-bound movement or a temporary upward move.
For another purchase, either wait for a fake breakout at 0.7558, or you can make your purchase with the breakout of triggers at 0.9827 and 1.3703, but I’d recommend first checking the project and its community and being patient for momentum entry.
📝 Final Thoughts
Stay calm, trade wisely, and let's capture the market's best opportunities!
This analysis reflects our opinions and is not financial advice.
Share your thoughts in the comments, and don’t forget to share this analysis with your friends! ❤️

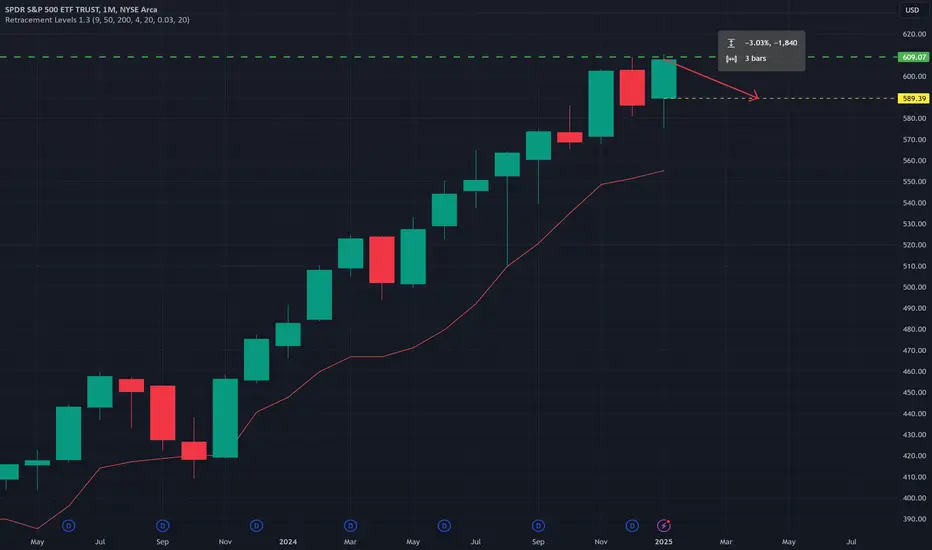
As Goes January So Goes the YearI have written and talked about this statistical superstition born out of trading almanacs of the "January Effect" which proposes that the month of January's direction (a green bar or a red bar) will determine the final close of the year as a whole. I plugged the data into a spreadsheet this year mid-January to get the updated statistic and for the last 97 years this adage has held true 68% of the time. Like all statistics when studying markets "nothing is 100%" but it is safe to say "more often than not" this is true.
The January 2025 Monthly open is -3.03% from the Friday close... SPY is going to open -2.19% as of writing this morning. We still have a whole week of trading days left in January to see how 2025 will MOST PROBABLY play out.
There's a lot of "reasons" talk this morning about some Chinese AI being the culprit of the selloff. I never take heed of the need for the media to publish digestible stories to give such reasons: they are never tradable prior to the event they claim and each is a one-off so knowing the "reason" (if even true) is totally worthless for making money.
The more logical answer according to price which is far more actionable to traders is the failed breakout last Friday. While SPY made a new All Time High the Weekly itself failed to close to confirm it. Not following through on such a move is a clear bearish signal going into a weekend. Now THAT is a much better "reason" to be focused on this week (and every time it happens in the future).
JUST IN: Bitcoin at $107,000Bitcoin, the flagship cryptocurrency, recently broke past the significant $107,000 psychological resistance level before retracing to $106,000. Despite this pullback, several technical and fundamental indicators suggest a bullish trajectory for the digital asset in the near term.
Technical Analysis
A key technical indicator supporting the bullish outlook is the imminent formation of a golden cross pattern on Bitcoin’s chart. This occurs when the 50-day moving average (MA) crosses above the 200-day MA, a classic signal of bullish momentum and a potential sustained uptrend.
Historically, golden cross patterns have often preceded major price rallies in Bitcoin. For instance:
- In 2020, the formation of a golden cross preceded Bitcoin’s surge from $10,000 to its then all-time high of $64,000.
Currently, Bitcoin’s Relative Strength Index (RSI) sits at 58, which is within neutral territory but trending upward. This indicates that there is room for further bullish momentum without the asset being overbought.
Market Performance
As of this writing, Bitcoin is up 2% on the day, trading at $106,000. The price action suggests strong buying interest at the current levels, even as the market absorbs profit-taking near the $107,000 mark. Key support levels to watch include $104,500, while resistance remains at $107,000 and beyond.
Beyond technical signals, several fundamental factors are bolstering Bitcoin’s bullish outlook:
1. Institutional Interest: Recent data highlights a surge in institutional inflows into Bitcoin-focused investment products. This renewed interest comes amid increasing macroeconomic uncertainty and Bitcoin’s reputation as digital gold.
2. Supply Dynamics: Bitcoin’s halving event, expected in mid-2025, is already influencing market sentiment. Historically, halvings have significantly reduced the rate of new Bitcoin entering circulation, often leading to price increases as demand outpaces supply.
3. Global Adoption: Countries and corporations continue to embrace Bitcoin as a legitimate asset. Recent announcements of Bitcoin integration into payment systems and growing adoption as a store of value further validate its utility and potential.
Conclusion
With the golden cross pattern on the verge of confirmation, Bitcoin’s technical setup suggests that a strong bullish run could be imminent. Coupled with favorable fundamentals, including increasing institutional participation and global adoption, Bitcoin appears well-positioned to continue its upward momentum.
Traders and investors should keep an eye on the $107,000 resistance level, as a decisive break above it could pave the way for Bitcoin to target $110,000 and beyond. However, as always, caution is advised, as market volatility remains a key characteristic of the cryptocurrency space.

XAUUSD London Buy Signal 1:6 RRDaily
A strong bullish channel on gold daily indicates a strong momentum towards the ATH.
After a bearish retracement in Aisa, Im anticipating a bullish continuation in London.
Potential RR 1:6

US INAUGURATION & BTCAs the second Trump era begins, this is how Bitcoin looks:
- BTC new ATH in the run up to inauguration and highest ever weekly close. I believe this was in anticipation for Trumps acceptance speech to mention Bitcoin and or the strategic reserve. That did not happen and so we've seen a selloff wick down to Midpoint with price settling at 0.75 in the range.
Typically, wicks get filled and so I would like to see price steadily reach the midpoint and then begin to show some strength before looking to go LONG. That all changes if we see a crypto specific executive order signed in the coming hours/days we should then see a move back to the highs.
- 4H 200 EMA is always an important level for the Bullrun, the vast majority of altcoins are under the 4H 200 EMA thanks to liquidity being drawn out into BTC and Solana memecoin craze.
- Bitcoin is still leading the greater market but I do expect rotation into strong US based altcoins within the next few weeks going into the later part of Q1. Some key alts that fit that category are SOL, SUI, LINK, ONDO, XRP, ENS, and many more.
It's important to remember this is a marathon not a sprint and I fully expect progress to be made but it may not be linear, until we have broken out of the range in the chart and move into a clear trend environment BTC should be treated as such by trading instead of buying and holding.

20/01/25 Weekly outlookLast weeks high: $106,467.97
Last weeks low: $89,292.15
Midpoint: $97,880.06
The Trump era begins...
January 20th 2025 is the date in which America sees its new Republican administration take office. An administration that has promised to embrace crypto instead of demonise it, one that wants the future of crypto to be built in the US, so far Trumps picks for SEC chairman and other important related roles have reflected that pro-crypto belief.
However, launching a $TRUMP memecoin and the subsequent $MELANIA memecoins just moments before inauguration in my opinion is a very bad start. Not only did the launch of TRUMP draw out liquidity from the altcoin market, it also damages the broader market just from an optics point of view. The general publics perception of crypto is it's full of scams, pump and dumps etc so to try and change the general publics mind the answer is to... Launch a memecoin...
Now I'm fully aware Donald Trump himself probably has very little to do with this, just like most celebrity memecoins but I just don't see how this is a positive start for the administration in proving their pro-crypto stance.
Bitcoin did have its highest weekly close of all time @ $106,500, which was $2000 higher than the previous ATH. +20% move from weekly low to high in anticipation for the potential Bitcoin strategic reserve announcement. Avoiding a SFP similar to that of week commencing January 6th will be a priority for BTC, we are in a rangebound environment so a SFP can have the potential to drop back down and undo a lot of the previous weeks progress. Until BTC breaks the rangebound environment and begins a trending move I will treat it as such.
For this week I'm keeping a close eye on the Liberty Financial portfolio (ETH,AAVE,LINK,ONDO,ENS) & US based majors (SOL,SUI,AVAX, ADA, STX,INJ) etc. The play is definitely coins that will be directly influenced by this new US administration, at least for now I cannot see any liquidity go towards any other coins for the time being.

BTC new ATH incomingGreat Morning!! Bitcoin pushing for another ATH breaking out of a bull flag with a fib target of $110,000. Today is the last day of the current administration, with Trump coming in on Monday and today being Gensler's last day in office. #LFG Check out #XRP which usually runs last but this cycle is leading the way.

ATH is Ready to Break Out? TSX:ATH is showing a solid accumulation zone between $0.061 and $0.068, with strong support around the 0.618 Fibonacci level ($0.061).
If ATH can maintain this range and successfully break the upper trend resistance, a bullish move could be on the horizon! 🚀
Stay patient and manage your risks!
DYOR & NFA
#Crypto #Altseason2025

BTC | FRACTAL | Fractal that leads to new ETH ATHBitcoin has been trading stable around 95K, a good indication that the bull run still has some more cards to play for altcoins.
Ethereum, Doge and SOL for example have not yet made new all time high's, indicating that the bullish cycle is far from over.
There's a saying that leads something like "it's not over until someone sings" - well, in this case, the bullish cycle is not over until Ethereum makes a new ATH.
___________________
BINANCE:BTCUSDT

BTC | FRACTAL | Multi Month to Higher High?BTC has been full of surprises - but I'm not complaining.
Initially, I was following a strict Elliot Wave Theory pattern, which played out extremely well - until the price shot out above the target.
I then re-adjusted the target to just under or just over 100k, which hit shortly after. The most interesting part though, is actually Ethereum. The fact that ETH has not yet made a new ATH after the dramatic BTC high, likely tells us the bull cycle is far form over.
I've been making a few updates on ETH and Altseason, and how you use the BTC.D chart, the BTC chart and the TOTAL# together to get a clear indication of where we are at in the cycle.
I've done MANY updates using this chart, because it is such a powerful combo to use. The fact remains - we have not yet seen a new ETH ath. This raises flags (and in the best possible way) indicating that the bullish cycle is not yet over.
_____________________________________
BYBIT:BTCUSDT COINBASE:ETHUSD

I know what's NEXT for Bitcoin!I recently shared two thoughts on Bitcoin price action to come..
In one of them I call for a retrace to 85K or lower, in the other I call for a new ATH. I know this might be a bit confusing so let's shed some more light on it.
Here you see BTC on the 1W Timeframe. I am using the Dynamic Fib Retracement indicator to do some trend analysis based on Fibonacci.
The blue colored zone/band is the golden pocket as calculated by the indicator from pivot highs/lows within a certain lookback range. The lines are the 0.236 (Preliminary), 0.382 (Secondary) and 0.5 (Median) Fibonacci retracement lines calculated in the same way. The purple line is the 1.618 retracement line (aka the ''Target Line'').
Now you understand this I can explain my thought process:
Scenario A (Bullish)
If price can manage to get back above the blue preliminary fib line and hold that range (around $98,550), I am convinced we see a new ATH for Bitcoin. The purple target line suggests the target for that would be around $117,000+ USD per BTC.
Scenario B (Bearish)
If price cannot get back above the blue preliminary fib line and finds resistance in that range around $98,550, I am convinced we see a bigger retracement for Bitcoin. The blue zone/band suggests the target for that would be around 80-83K USD per BTC as of right now, but this golden pocket band will slightly adjust higher so lets say $85,000 per Bitcoin.
Do you agree or do you have other ideas? Let me know!

ETH | FRACTAL ATH $6000 | Bitcoin Overlay I'm still anticipating the new Ethereum All Time High .
I just don't believe that BTC will make such a climb and ETH stays behind - it hasn't happened before, I don't believe it will happen this time.
What has happened before, is an interesting topic - ETH usually makes its ATH AFTER the BTC rally, about when the cycle comes to an end. We see this playout during the past two peaks. Ethereum stays fairly low beneath it's own previous ATH , and shoots out above BTC just when the cycle ends.
Using a fractal form the previous cycle, this puts an interesting target on ETH.
_______________________
COINBASE:BTCUSD COINBASE:ETHUSD

BTC On Its Way To New ATH?!Nice recovery for Bitcoin!
It looks really good for an attempt to break the ATH I must say..
This is the 3D Chart.
We crossed back above and are bouncing off the light blue preliminary fib line on the DFR , this could be a leg up towards $120,000 but lets stay conservative and say $104,000 is our first target if we manage to break through $101,500.
The level to hold for bulls is $96,300. Everything in between is irrelevant and would suggest BTC going higher.
What are your thoughts? Is a new ATH near for Bitcoin?

Bitcoin - Will Bitcoin return to above $100,000?!Bitcoin is above the EMA50 and EMA200 in the four-hour time frame and is trading in its ascending channel. Capital withdrawals from Bitcoin ETFs or risk off sentiment in the US stock market will pave the way for Bitcoin to decline. One can look for Bitcoin sell positions in the supply zone.
Bitcoin's downward correction and its placement in the demand zone will allow us to buy it. It should be noted that there is a possibility of heavy fluctuations and shadows due to the movement of whales in the market and compliance with capital management in the cryptocurrency market will be more important.
In 2025, key narratives in the cryptocurrency market are expected to include asset tokenization, artificial intelligence, and Bitcoin as a reserve asset. Experts also predict that meme coins might become a major trend, while maintaining caution regarding Solana and Ripple ETFs.
In 2024, the crypto market experienced increased adoption and institutional investment. Experts anticipate significant trends in 2025 as the market matures and Bitcoin’s upward trajectory continues.
ETF providers are exploring more innovative and potentially riskier ways to attract investors to cryptocurrencies. New applications submitted to the U.S. Securities and Exchange Commission (SEC) include ETFs converting S&P500 returns into Bitcoin and funds investing in convertible bonds to purchase Bitcoin.
Additionally, Volatility Shares aims to launch inverse and leveraged Solana funds.If approved, more than ten new cryptocurrency-related funds could become available to investors in 2025.
Reports indicate that the Bitcoin network settled over $19 trillion in transactions in 2024, more than double the $8.7 trillion settled in 2023.
At the height of the 2021 bull market, Bitcoin’s transaction volume reached approximately $47 trillion. However, this volume significantly declined in 2022 and 2023. Nevertheless, in 2024, Bitcoin’s network reestablished itself as a store of value and medium of exchange with over $19 trillion settled.
Robert Kiyosaki, author of the best-selling book Rich Dad, Poor Dad, has predicted Bitcoin’s price to range between $175,000 and $350,000 in 2025. A strong advocate of Bitcoin, Kiyosaki believes the cryptocurrency can serve as a hedge against global economic volatility.
According to data from SaylorTracker, MicroStrategy currently holds 446,400 Bitcoin worth approximately $43.7 billion. Michael Saylor, co-founder of MicroStrategy, shared a Bitcoin chart from SaylorTracker on January 5, hinting at potential Monday purchases. He tweeted, “Something on SaylorTracker.com doesn’t seem right.”
The previous week, on December 29, Saylor shared a similar chart, and on December 30, MicroStrategy purchased 2,138 Bitcoin at an average price of $97,837 per unit. These purchases are part of the company’s 21/21 program, which aims to acquire $42 billion worth of Bitcoin through $21 billion in stock issuance and $21 billion in fixed-income securities.
MicroStrategy’s inclusion in the Nasdaq Index on December 23, 2024, provided traditional stock investors indirect exposure to Bitcoin through ETFs. Following its inclusion, the company held a special shareholder meeting to secure approval for increasing funds to buy more Bitcoin.
According to a December 23 filing with the SEC, MicroStrategy has requested shareholder approval to increase its Class A common stock from 330 million to 10.3 billion shares.

XRP / USD Falling WedgeXRP / USD Falling Wedge to retake highs at 2.91+
If a break above occurs, previous ATH test possible above $3.00

an analysis on BTCBINANCE:BTCUSDT
✅ Currently, with the break of the $97,500 resistance, it can grow to the top of its trading range, which is the $99,500 range 👌
✅ Bitcoin's exit from the top of the short-term trading range will start a new upward wave and record a new high for Bitcoin 👍
⚠️ Disclaimer:
This is not financial advice. Always manage your risks and trade responsibly.
👉 Follow me for daily updates,
💬 Comment and like to share your thoughts,
📌 And check the link in my bio for even more resources!
Let’s navigate the markets together—join the journey today! 💹✨

XRP movement and rhythm originally figured for a smaller abcde triangle with upside resolution, however, zooming out makes it appear as tho maybe we have more time to eat up before the next leg up.
this is just a chart to track progress.
hypothesis: one more leg down, but a higher low, followed by new move up for new ATH sometime around january 29th 2025
two highlighted paths in white and red represent the bullish scenario
separate post may be warranted for bearish case
