Daily Price Action AUDJPY Tuesday 4/22/2025In this video, we will be looking into the potential price action of AUDJPY.
AUDJPY

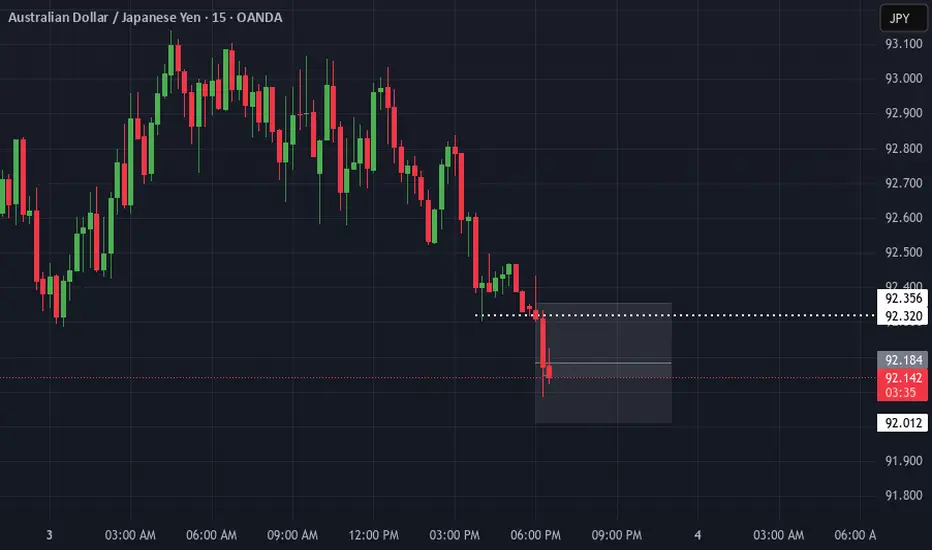
AUD-JPY Local Bearish Bias! Sell!
Hello,Traders!
AUD-JPY is going up now
But the pair will hit a horizontal
Resistance of 92.000 on Monday
From where we will be expecting
A local bearish correction
Sell!
Comment and subscribe to help us grow!
Check out other forecasts below too!
Disclosure: I am part of Trade Nation's Influencer program and receive a monthly fee for using their TradingView charts in my analysis.

AUDJPY Breakout and Potential RetraceHey Traders, in today's trading session we are monitoring AUDJPY for a selling opportunity around 91.800 zone, AUDJPY is trading in a downtrend and currently is in a correction phase in which it is approaching the trend at 91.800 support and resistance area.
Trade safe, Joe.

Bearish reversal?AUD/JPY is rising towards the pivot which is a pullback resistance that lines up with the 61.8% Fibonacci retracement and could reverse to the 1st support.
Pivot: 91.88
1st Support: 88.48
1st Resistance: 93.29
Risk Warning:
Trading Forex and CFDs carries a high level of risk to your capital and you should only trade with money you can afford to lose. Trading Forex and CFDs may not be suitable for all investors, so please ensure that you fully understand the risks involved and seek independent advice if necessary.
Disclaimer:
The above opinions given constitute general market commentary, and do not constitute the opinion or advice of IC Markets or any form of personal or investment advice.
Any opinions, news, research, analyses, prices, other information, or links to third-party sites contained on this website are provided on an "as-is" basis, are intended only to be informative, is not an advice nor a recommendation, nor research, or a record of our trading prices, or an offer of, or solicitation for a transaction in any financial instrument and thus should not be treated as such. The information provided does not involve any specific investment objectives, financial situation and needs of any specific person who may receive it. Please be aware, that past performance is not a reliable indicator of future performance and/or results. Past Performance or Forward-looking scenarios based upon the reasonable beliefs of the third-party provider are not a guarantee of future performance. Actual results may differ materially from those anticipated in forward-looking or past performance statements. IC Markets makes no representation or warranty and assumes no liability as to the accuracy or completeness of the information provided, nor any loss arising from any investment based on a recommendation, forecast or any information supplied by any third-party.

AUD_JPY LOCAL SHORT|
✅AUD_JPY price went up sharply
But a strong resistance level was hit around 91.500
Thus, as a pullback is already happening
And a move down towards the target of 89.500 shall follow
SHORT🔥
✅Like and subscribe to never miss a new idea!✅
Disclosure: I am part of Trade Nation's Influencer program and receive a monthly fee for using their TradingView charts in my analysis.

AUDJPY: Bearish Move From Resistance Confirmed 🇦🇺🇯🇵
There is a high chance that AUDJPY will continue retracing
from the underlined intraday/daily resistance.
As a confirmation, I see a breakout of a neckline of a double top pattern
and a violation of a support line of a rising channel.
With a high probability, the price will retrace at least to 89.9 level.
❤️Please, support my work with like, thank you!❤️
I am part of Trade Nation's Influencer program and receive a monthly fee for using their TradingView charts in my analysis.

Bearish Continuation Setup in AUD/JPYThe AUD/JPY pair is nearing a retest of the previous month's low, following a recent breakdown from a triangle consolidation pattern. This move also saw price fall beneath an ascending trendline, forming a decisive bearish impulse leg.
Currently, the market is in a pullback phase, which may offer a potential shorting opportunity—particularly if a bearish signal emerges. On the daily timeframe, the broader trend remains bearish, adding weight to the likelihood of further downside.
A false breakout above the previous week's high would add further confirmation to the bearish outlook. Should this setup unfold, a continuation lower is expected, with a probable break below the 90.000 support level. The next key support zone is identified around 88.510

Potential bullish rise?AUD/JPY has reacted off the pivot which is a pullback support and could rise to the 1st resistance which has been identified as a pullback resistance.
Pivot: 89.96
1st Support: 88.50
1st Resistance: 92.38
Risk Warning:
Trading Forex and CFDs carries a high level of risk to your capital and you should only trade with money you can afford to lose. Trading Forex and CFDs may not be suitable for all investors, so please ensure that you fully understand the risks involved and seek independent advice if necessary.
Disclaimer:
The above opinions given constitute general market commentary, and do not constitute the opinion or advice of IC Markets or any form of personal or investment advice.
Any opinions, news, research, analyses, prices, other information, or links to third-party sites contained on this website are provided on an "as-is" basis, are intended only to be informative, is not an advice nor a recommendation, nor research, or a record of our trading prices, or an offer of, or solicitation for a transaction in any financial instrument and thus should not be treated as such. The information provided does not involve any specific investment objectives, financial situation and needs of any specific person who may receive it. Please be aware, that past performance is not a reliable indicator of future performance and/or results. Past Performance or Forward-looking scenarios based upon the reasonable beliefs of the third-party provider are not a guarantee of future performance. Actual results may differ materially from those anticipated in forward-looking or past performance statements. IC Markets makes no representation or warranty and assumes no liability as to the accuracy or completeness of the information provided, nor any loss arising from any investment based on a recommendation, forecast or any information supplied by any third-party.

Last Week’s FX Recap: April 7–11 (Zone Reactions & Trade Notes)📈 Weekly Forex Recap – Market Reactions & Lessons (Apr 7–11)
Last week there were about +320 pips of reaction potential (excluding Gold, which I was completely off on). There were multiple opportunities to capture solid intraday or swing setups.
3 out of 6 weekly targets were hit.
5 out of 6 trend biases were either accurate or neutral —meaning no major misreads, aside from one or two volatile zones. The only pair that really got me was Gold.
Let’s run it back real quick:
✅ AUDJPY
Bearish bias accurate.
30 pip reaction off zone with just 1 pip drawdown.
Weekly target hit.
✅ NZDJPY
Bearish bias accurate.
Weekly target hit, though price never reached the watch zone.
No setup triggered, but direction was respected.
⚠️ EURUSD
Range-bound bias played out majority of the week.
Gave about 90–100 pip drop from the hot zone mentioned.
Weekly target came close but didn’t hit.
⚠️ GOLD
Watch zone completely failed.
Short-term bounce gave 480 pip reaction—but that volatility was tough to catch cleanly.
Directional bias wasn’t helpful here. Gold was chaos.
✅ EURGBP
Cleanest setup of the week.
Bias was bullish, price tapped the buy zone and ran 100 pips.
Weekly target hit. Textbook move.
⚠️ GBPUSD
Consolidation-heavy.
Watch zone gave 100 pip reaction, but weekly target didn’t hit.
Bias was unclear—no real conviction either way.
📉 Total Zone Reaction Potential: 320 pips
🎯 Weekly Targets Hit: 3/6
📊 Trend Accuracy: 50% (3 clear hits, 2 neutral, 1 miss)
But that’s done now.
Whether you hit it last week or fumbled the ball, let it go.
We trade forward. Eyes up. Mind clear.
Time to dive into the new week.
Let’s get it. 👊

AUDJPY Will Move Higher! Long!
Take a look at our analysis for AUDJPY.
Time Frame: 1D
Current Trend: Bullish
Sentiment: Oversold (based on 7-period RSI)
Forecast: Bullish
The market is on a crucial zone of demand 90.356.
The oversold market condition in a combination with key structure gives us a relatively strong bullish signal with goal 94.801 level.
P.S
Please, note that an oversold/overbought condition can last for a long time, and therefore being oversold/overbought doesn't mean a price rally will come soon, or at all.
Disclosure: I am part of Trade Nation's Influencer program and receive a monthly fee for using their TradingView charts in my analysis.
Like and subscribe and comment my ideas if you enjoy them!

AUDJPYWe see in Australia against the Japanese yen two scenarios, i.e. the trend is completed to the downside, or if 90.449 is breached, it begins to rise, and we target 93.498 and 92.332, but most likely the scenario is an upward trend that will be activated, i.e. we wait for the taki candle after the breach.

AUDJPY Bearish continuation below 91.85The AUDJPY currency pair remains in a bearish trend, with the recent price action showing signs of an oversold bounce. While a temporary rebound is in play, the broader sentiment remains weak unless a decisive breakout occurs.
Key Levels to Watch:
Resistance Levels: 91.85 (critical level), 92.84, 93.62
Support Levels: 87.87, 86.60, 85.70
Bearish Scenario:
A rejection from the 91.85 resistance level could reaffirm the downside bias, leading to a continuation of the bearish move toward 87.87, with extended declines targeting 86.60 and 85.70 over the longer timeframe.
Bullish Scenario:
A breakout above 91.85 with a daily close above this level would challenge the bearish sentiment, opening the door for further gains toward 92.84, followed by 93.60.
Conclusion:
The market sentiment remains bearish, with 91.85 acting as a critical resistance zone. A rejection from this level could reinforce the downtrend, while a confirmed breakout would shift the outlook to bullish, favouring further upside. Traders should closely monitor price action at this key level for confirmation.
This communication is for informational purposes only and should not be viewed as any form of recommendation as to a particular course of action or as investment advice. It is not intended as an offer or solicitation for the purchase or sale of any financial instrument or as an official confirmation of any transaction. Opinions, estimates and assumptions expressed herein are made as of the date of this communication and are subject to change without notice. This communication has been prepared based upon information, including market prices, data and other information, believed to be reliable; however, Trade Nation does not warrant its completeness or accuracy. All market prices and market data contained in or attached to this communication are indicative and subject to change without notice.

AUD/JPY SHORT FROM RESISTANCE
Hello, Friends!
We are going short on the AUD/JPY with the target of 85.454 level, because the pair is overbought and will soon hit the resistance line above. We deduced the overbought condition from the price being near to the upper BB band. However, we should use low risk here because the 1W TF is green and gives us a counter-signal.
Disclosure: I am part of Trade Nation's Influencer program and receive a monthly fee for using their TradingView charts in my analysis.
✅LIKE AND COMMENT MY IDEAS✅

AUDJPY to find buyers at previous resistance?AUDJPY - 24h expiry
There is no indication that the rally is coming to an end.
Further upside is expected.
Risk/Reward would be poor to call a buy from current levels.
A move through 91.00 will confirm the bullish momentum.
The measured move target is 92.00.
We look to Buy at 89.50 (stop at 88.50)
Our profit targets will be 91.50 and 92.00
Resistance: 91.00 / 91.50 / 92.00
Support: 90.00 / 89.50 / 89.00
Risk Disclaimer
The trade ideas beyond this page are for informational purposes only and do not constitute investment advice or a solicitation to trade. This information is provided by Signal Centre, a third-party unaffiliated with OANDA, and is intended for general circulation only. OANDA does not guarantee the accuracy of this information and assumes no responsibilities for the information provided by the third party. The information does not take into account the specific investment objectives, financial situation, or particular needs of any particular person. You should take into account your specific investment objectives, financial situation, and particular needs before making a commitment to trade, including seeking advice from an independent financial adviser regarding the suitability of the investment, under a separate engagement, as you deem fit.
You accept that you assume all risks in independently viewing the contents and selecting a chosen strategy.
Where the research is distributed in Singapore to a person who is not an Accredited Investor, Expert Investor or an Institutional Investor, Oanda Asia Pacific Pte Ltd (“OAP“) accepts legal responsibility for the contents of the report to such persons only to the extent required by law. Singapore customers should contact OAP at 6579 8289 for matters arising from, or in connection with, the information/research distributed.

Bullish bounce off pullback support?AUD/JPY is falling towards the pivot which acts as a pullback support and could bounce to the 1st resistance which is an overlap resistance.
Pivot: 89.50
1st Support: 87.82
1st Resistance: 93.06
Risk Warning:
Trading Forex and CFDs carries a high level of risk to your capital and you should only trade with money you can afford to lose. Trading Forex and CFDs may not be suitable for all investors, so please ensure that you fully understand the risks involved and seek independent advice if necessary.
Disclaimer:
The above opinions given constitute general market commentary, and do not constitute the opinion or advice of IC Markets or any form of personal or investment advice.
Any opinions, news, research, analyses, prices, other information, or links to third-party sites contained on this website are provided on an "as-is" basis, are intended only to be informative, is not an advice nor a recommendation, nor research, or a record of our trading prices, or an offer of, or solicitation for a transaction in any financial instrument and thus should not be treated as such. The information provided does not involve any specific investment objectives, financial situation and needs of any specific person who may receive it. Please be aware, that past performance is not a reliable indicator of future performance and/or results. Past Performance or Forward-looking scenarios based upon the reasonable beliefs of the third-party provider are not a guarantee of future performance. Actual results may differ materially from those anticipated in forward-looking or past performance statements. IC Markets makes no representation or warranty and assumes no liability as to the accuracy or completeness of the information provided, nor any loss arising from any investment based on a recommendation, forecast or any information supplied by any third-party.

AUD/JPY Technical Outlook: Wave 5 Completion in SightIn AUD/JPY, the 4th wave has been completed, and the 5th wave is in progress. According to Elliott Wave theory, there is a high probability of the market continuing its downward movement.
Regarding potential targets, the price may reach 88.151 and 87.365 on the downside. However, a bullish move could also emerge if the market breaks above 89.645 .

AUD/JPY H1 | Upward momentum gaining traction?AUD/JPY is falling towards a pullback support and could potentially bounce off this level to climb higher.
Buy entry is at 88.75 which is a pullback support.
Stop loss is at 87.60 which is a level that lies underneath an overlap support and the 61.8% Fibonacci retracement.
Take profit is at 90.63 which is a pullback resistance that aligns with the 50.0% Fibonacci retracement.
High Risk Investment Warning
Trading Forex/CFDs on margin carries a high level of risk and may not be suitable for all investors. Leverage can work against you.
Stratos Markets Limited (www.fxcm.com):
CFDs are complex instruments and come with a high risk of losing money rapidly due to leverage. 63% of retail investor accounts lose money when trading CFDs with this provider. You should consider whether you understand how CFDs work and whether you can afford to take the high risk of losing your money.
Stratos Europe Ltd (www.fxcm.com):
CFDs are complex instruments and come with a high risk of losing money rapidly due to leverage. 63% of retail investor accounts lose money when trading CFDs with this provider. You should consider whether you understand how CFDs work and whether you can afford to take the high risk of losing your money.
Stratos Trading Pty. Limited (www.fxcm.com):
Trading FX/CFDs carries significant risks. FXCM AU (AFSL 309763), please read the Financial Services Guide, Product Disclosure Statement, Target Market Determination and Terms of Business at www.fxcm.com
Stratos Global LLC (www.fxcm.com):
Losses can exceed deposits.
Please be advised that the information presented on TradingView is provided to FXCM (‘Company’, ‘we’) by a third-party provider (‘TFA Global Pte Ltd’). Please be reminded that you are solely responsible for the trading decisions on your account. There is a very high degree of risk involved in trading. Any information and/or content is intended entirely for research, educational and informational purposes only and does not constitute investment or consultation advice or investment strategy. The information is not tailored to the investment needs of any specific person and therefore does not involve a consideration of any of the investment objectives, financial situation or needs of any viewer that may receive it. Kindly also note that past performance is not a reliable indicator of future results. Actual results may differ materially from those anticipated in forward-looking or past performance statements. We assume no liability as to the accuracy or completeness of any of the information and/or content provided herein and the Company cannot be held responsible for any omission, mistake nor for any loss or damage including without limitation to any loss of profit which may arise from reliance on any information supplied by TFA Global Pte Ltd.
The speaker(s) is neither an employee, agent nor representative of FXCM and is therefore acting independently. The opinions given are their own, constitute general market commentary, and do not constitute the opinion or advice of FXCM or any form of personal or investment advice. FXCM neither endorses nor guarantees offerings of third-party speakers, nor is FXCM responsible for the content, veracity or opinions of third-party speakers, presenters or participants.

WHY CADJPY IS BULLISH ?? DETAILED ANALYSIS CAD/JPY is currently trading around 104.200, forming a falling wedge pattern—a technical indicator often suggestive of a potential bullish reversal. Traders are closely monitoring this setup for a breakout, which could potentially propel the pair toward the target price of 107.000, indicating a prospective gain of approximately 300 pips.
Fundamentally, the Canadian dollar's performance is closely tied to global oil prices, given Canada's status as a major oil exporter. Recent stability in oil markets has provided underlying support to the loonie. Conversely, the Japanese yen, traditionally viewed as a safe-haven currency, has experienced fluctuations influenced by shifts in global risk sentiment and the Bank of Japan's monetary policy stance. The divergence in economic indicators and central bank policies between Canada and Japan may contribute to the anticipated bullish momentum in the CAD/JPY pair.
Technical analysis reinforces this outlook. The falling wedge pattern observed on the charts is characterized by converging trendlines sloping downward, indicating diminishing bearish momentum. A decisive breakout above the upper trendline of the wedge, accompanied by increased trading volume, would serve as a confirmation of the bullish reversal. Key resistance levels to monitor include 105.000 and 106.000, with a sustained move above these thresholds enhancing the likelihood of reaching the 107.000 target.
Traders should exercise prudent risk management strategies, such as setting appropriate stop-loss orders, to mitigate potential market volatility. Additionally, staying informed about upcoming economic data releases and central bank communications from both Canada and Japan will be crucial in navigating this trade effectively. By aligning technical insights with fundamental developments, traders can position themselves to capitalize on the potential bullish breakout in the CAD/JPY pair.

GBP/USD: The Make-Or-Break Zone”GBP/USD is showing strong bullish momentum, pushing toward the key resistance zone between 1.33000–1.36000. However, a short-term correction may occur before the next leg higher.
Key Levels:
Support Zone: 1.27983
Resistance Zone (Target): 1.33000–1.36000
Invalidation Level of Bullish Trend: 1.22544
Bearish Scenario: If 1.22544 breaks, eyes on 1.13843
The structure supports bullish continuation unless price breaks below 1.22544. Stay patient and look for clean entries post-correction.

AUD-JPY Will Keep Falling! Sell!
Hello,Traders!
AUD-JPY made a bearish
Breakout then made a retest
And is going down again
So we are bearish biased
And we will be expecting
A further bearish continuation
Sell!
Comment and subscribe to help us grow!
Check out other forecasts below too!
Disclosure: I am part of Trade Nation's Influencer program and receive a monthly fee for using their TradingView charts in my analysis.

AUDJPY INTRADAY capped by resistance at 94.45 The AUDJPY pair is in an overall downtrend, though currently experiencing a short-term oversold bounce back.
Key Resistance: 94.45 – A bearish rejection from this level could push prices lower.
Bearish Scenario: A break below 94.45 could lead to further declines toward 92.70, 92.00, and 91.70.
Alternatively a breakout above 94.45 and a daily close higher would negate a bearish outlook.
Upside Targets: 95.20, 95.70, and 96.20 if the bullish trend continues.
Conclusion: The trend remains bearish unless AUDJPY closes above 94.45, which would signal further upside risk.
This communication is for informational purposes only and should not be viewed as any form of recommendation as to a particular course of action or as investment advice. It is not intended as an offer or solicitation for the purchase or sale of any financial instrument or as an official confirmation of any transaction. Opinions, estimates and assumptions expressed herein are made as of the date of this communication and are subject to change without notice. This communication has been prepared based upon information, including market prices, data and other information, believed to be reliable; however, Trade Nation does not warrant its completeness or accuracy. All market prices and market data contained in or attached to this communication are indicative and subject to change without notice.

AUDJPY to find sellers at market price?AUDJPY - 24h expiry
There is no indication that the selloff is coming to an end.
Further downside is expected.
Risk/Reward would be poor to call a sell from current levels.
A move through 92.50 will confirm the bearish momentum.
The measured move target is 91.75.
We look to Sell at 93.00 (stop at 93.50)
Our profit targets will be 92.00 and 91.75
Resistance: 92.75 / 93.00 / 93.25
Support: 92.25 / 92.00 / 91.75
Risk Disclaimer
The trade ideas beyond this page are for informational purposes only and do not constitute investment advice or a solicitation to trade. This information is provided by Signal Centre, a third-party unaffiliated with OANDA, and is intended for general circulation only. OANDA does not guarantee the accuracy of this information and assumes no responsibilities for the information provided by the third party. The information does not take into account the specific investment objectives, financial situation, or particular needs of any particular person. You should take into account your specific investment objectives, financial situation, and particular needs before making a commitment to trade, including seeking advice from an independent financial adviser regarding the suitability of the investment, under a separate engagement, as you deem fit.
You accept that you assume all risks in independently viewing the contents and selecting a chosen strategy.
Where the research is distributed in Singapore to a person who is not an Accredited Investor, Expert Investor or an Institutional Investor, Oanda Asia Pacific Pte Ltd (“OAP“) accepts legal responsibility for the contents of the report to such persons only to the extent required by law. Singapore customers should contact OAP at 6579 8289 for matters arising from, or in connection with, the information/research distributed.
