AUDUSD SHORT FORECAST Q2 W18 D18 Y25AUDUSD SHORT FORECAST Q2 W18 D18 Y25
Fun Coupon Friday !
SUMMARY
- IMO, if this shorts, it's a slippy slide !
- Daily order block setup
- Daily highs confluence
- Weekly 50 Ema forecast to provide resistance for the short.
- Required to await 15' breaks of structure as price is bullish/ ranging at the moment .
- upon intra day breaks of structure, anticipating a creation of 15' order block to provide an area of interest to short from.
FRGNT X
AUDUSD

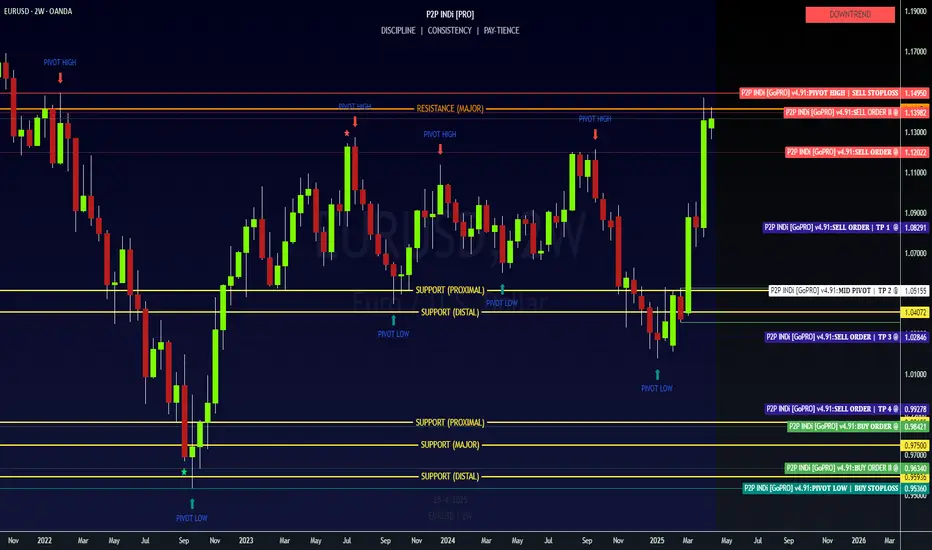
EURUSD (2W) | TECHNICAL ANALYSISChart Date: April 17, 2025 | Timeframe: 2-Week | Pair: EUR/USD
KEY LEVELS (RESISTANCE & SUPPORT)
Pivot High (Stop-Loss): 1.14950
Resistance (Major): 1.14154
Support I (Proximal): 1.05166
Support I (Distal): 1.04072
Support (Proximal): 0.98605
Support (Major): 0.97500
Support (Distal): 0.95936
CURVE ANALYSIS 🧾
Sell Order: 1.13982 → 1.12022
Sell TP 1: 1.08291
Sell TP 2 (Mid Pivot): 1.05155
Sell TP 3: 1.02846
Sell TP 4: 0.99278
Buy Order: 0.98421 → 0.96340
Pivot Low (Stop-Loss): 0.95360
TRADE OUTLOOK 📉 (SHORT BIAS)
Price is deep within a 2W hidden institutional supply zone
Multiple pivot highs intersect resistance at 1.13982 and 1.14950
DOWNWARD TREND confirmed ✔️
If price fails to close above 1.14950, short setups are favored with confidence
High RRR opportunity present on rejections below 1.13982 or 1.12022
Targets: 1.08291, 1.05155, 1.02846, 0.99278
ENTRY PLAN 🧠 | TRADE IDEA
Wait for bearish engulfing or strong rejection below 1.13982
Place entry below 1.12022 with SL above 1.14950
Scale out at 1.08291 (TP1), then trail toward TP4
RISK MANAGEMENT 🎯
Sell SL: 1.14950
Buy SL: 0.95360
Use ATR to confirm volatility threshold before entry
Session bias: Use London/NY overlap for execution
SUMMARY: SHORT SETUP INSTITUTIONAL ZONE 📉
If 0.64086 (hidden institutional supply) holds, and price does not close above 1.14950, we are in a prime high-probability reversal zone. This sets up a powerful bearish swing opportunity targeting 4 support layers, anchored by institutional demand between 0.97500 - 0.95360.
💡 "Discipline | Consistency | PAY -tience"
Daily Price Action: AUDUSD Thursday 4/17/2025In this video, we will be looking into the potential price action of AUDUSD.

AUD/USD) Resistance level pullback Short Read The ChaptianSMC Trading point update
analysis of the AUD/USD pair on the 2-hour timeframe, showing a possible bearish setup. Here's a breakdown of the idea behind it:
Key Observations:
1. Current Trend:
The pair was in an uptrend, as indicated by the rising channel (parallel trendlines). However, it has now broken out of that channel.
2. Resistance Level:
The price has reached a resistance zone around 0.64000, and it seems to be rejecting this level.
3. 2 Timeframe Demand Zone:
Around the 0.63300 – 0.63400 range, this area previously acted as a demand zone (support), and the chart suggests price might retest it.
4. Projected Move:
First, a pullback up into the resistance zone could occur.
Then a drop to the demand zone.
If the demand zone fails to hold, the price could head down toward the key support/FVG (Fair Value Gap) around 0.61000 – 0.61500.
5. EMA (200):
The 200 EMA is below the price, suggesting longer-term bullish pressure, but it's starting to flatten, which could signal weakness in the uptrend.
6. RSI Indicator:
RSI is around 52, showing neutral momentum—neither overbought nor oversold, allowing room for movement in either direction.
Mr SMC Trading point
---
Idea Summary:
The chart suggests a potential reversal from the uptrend into a downtrend, triggered by a failure to break above resistance. The two key targets for a bearish move are:
First: the 2TF demand zone
Final: the key support/FVG zone
Pales support boost 🚀 analysis follow)

AUDUSD SHORT FORECAST Q2 W16 D17 Y25AUDUSD SHORT FORECAST Q2 W16 D17 Y25
GM GM.
Summary
+ Daily high rejection
+ Weekly order block rejection
+ Weekly 50 EMA edging closer to price action
+ 4H bearish close
+ 1H continued short
+ 15' intraday breaks of structure
Just a few confluences mentioned.
Entry Model
Tap
Lower time frame break of structure/ Bearish candle stick formation from point of interest.
FRGNT X

AUDUSD,GBPUSD and NZDUSDHello traders, this is a complete multiple timeframe analysis of this pair. We see could find significant trading opportunities as per analysis upon price action confirmation we may take this trade. Smash the like button if you find value in this analysis and drop a comment if you have any questions or let me know which pair to cover in my next analysis.

AUDUSD(20250416)Today's AnalysisMarket news:
U.S. import prices fell 0.1% in March from the previous month, the first month-on-month decline since September last year.
Technical analysis:
Today's buying and selling boundaries:
0.6346
Support and resistance levels:
0.6414
0.6388
0.6372
0.6320
0.6304
0.6278
Trading strategy:
If the price breaks through 0.6346, consider buying, the first target price is 0.6372
If the price breaks through 0.6320, consider selling, the first target price is 0.6304

AUDUSD Discretionary Analysis: Recovery Mode ActivatedIt’s that feeling when the engine’s been cold for a while, but now it’s starting to rev. AUDUSD is flashing signs it wants to push up — not in a rush, but with purpose. I’m seeing strength building, like it’s getting ready to climb. Recovery mode’s not just activated — it’s already in motion. I’m calling for upside here. If it plays out, I’ll be riding the move. If not, hey, I’ll wait for the next setup. But right now? I like the long.
Just my opinion, not financial advice.

AUD/USD⚔️ Strategy Options:
🟢 Bullish Tactical Play (Range Swing):
Only valid if price closes weekly above 0.6450.
Entry: Buy limit on retest of 0.6310
SL: 0.6150
TP1: 0.6500
TP2: 0.6850
This is a short-term retracement play against a longer-term bearish trend.
🔴 Bearish Trend Continuation:
Ideal if weekly closes below 0.6200
Entry: Sell retrace at 0.6300
SL: 0.6460
TP1: 0.6000
TP2: 0.5800–0.5650
This aligns with macro pressure (risk-off + China slowdown) and offers clean structure.

AUD-USD BEARISH BIAS|SHORT|
✅AUD_USD will soon retest a key resistance level of 0.6409
So I think that the pair will make a pullback
And go down to retest the demand level below at 0.6318
SHORT🔥
✅Like and subscribe to never miss a new idea!✅
Disclosure: I am part of Trade Nation's Influencer program and receive a monthly fee for using their TradingView charts in my analysis.

Bearish drop off multi swing high resistance?AUD/USD has reacted off the resistance level which is a multi swing high resistance and could drop from this level to our take profit.
Entry: 0.6386
Why we like it:
There is a multi swing high resistance.
Stop loss: 0.6447
Why we like it:
There is an overlap resistance level.
Take profit: 0.6265
Why we like it:
There is a pullback support level that lines up with the 23.6% Fibonacci retracement.
Enjoying your TradingView experience? Review us!
Please be advised that the information presented on TradingView is provided to Vantage (‘Vantage Global Limited’, ‘we’) by a third-party provider (‘Everest Fortune Group’). Please be reminded that you are solely responsible for the trading decisions on your account. There is a very high degree of risk involved in trading. Any information and/or content is intended entirely for research, educational and informational purposes only and does not constitute investment or consultation advice or investment strategy. The information is not tailored to the investment needs of any specific person and therefore does not involve a consideration of any of the investment objectives, financial situation or needs of any viewer that may receive it. Kindly also note that past performance is not a reliable indicator of future results. Actual results may differ materially from those anticipated in forward-looking or past performance statements. We assume no liability as to the accuracy or completeness of any of the information and/or content provided herein and the Company cannot be held responsible for any omission, mistake nor for any loss or damage including without limitation to any loss of profit which may arise from reliance on any information supplied by Everest Fortune Group.

AUDUSD keeps surging upwardFrom a technical analysis perspective, the moving average system presents a typical bullish arrangement pattern. The 5-day moving average and the 10-day moving average are continuously rising and diverging 🚀, providing a solid support foundation for the exchange rate of the Australian dollar against the US dollar. At the moment, the MACD indicator is above the zero axis, and its histogram bars are also continuously expanding 📈, which clearly indicates that the bullish momentum is in a strong state 💪. At the same time, although the KDJ indicator is in the overbought area, there has been no significant sign of a turn, which means that the current upward trend is highly likely to continue 😎.
In terms of fundamentals, Australia's recent economic data has been rather remarkable 🌟. For example, Australia's employment data has shown a good growth trend, and the unemployment rate has decreased, indicating that the vitality of Australia's labor market is increasing 💪, which in turn provides strong positive support for the Australian dollar 😃. In addition, Australia's commodity export data is also quite excellent. As a resource-exporting country, the stable increase in commodity prices and the growth in export volume have greatly promoted Australia's economic development 🚀 and further enhanced the attractiveness of the Australian dollar 😍. In contrast, there is a certain degree of uncertainty in the economic policies of the United States. Especially, the progress of the fiscal stimulus plan has been slow, which has somewhat weakened the market's confidence in the US dollar 😕. Based on considerations of risk, investors have started to gradually shift their funds to other currencies, including the Australian dollar, injecting strong impetus into the rise of AUDUSD 💥.
💰💰💰 GBPUSD💰💰💰
🎯 Buy@1.3200 - 1.3230
🎯 TP 1.3300 - 1.3350
Traders, if you're fond of this perspective or have your own insights regarding it, feel free to share in the comments. I'm really looking forward to reading your thoughts! 🤗
👇The accuracy rate of our daily signals has remained above 98% within a month! 📈 We sincerely welcome you to join our channel and share in the success with us! 👉

AUD/USD BUYERS WILL DOMINATE THE MARKET|LONG
Hello, Friends!
AUD/USD pair is trading in a local downtrend which we know by looking at the previous 1W candle which is red. On the 9H timeframe the pair is going down too. The pair is oversold because the price is close to the lower band of the BB indicator. So we are looking to buy the pair with the lower BB line acting as support. The next target is 0.622 area.
Disclosure: I am part of Trade Nation's Influencer program and receive a monthly fee for using their TradingView charts in my analysis.
✅LIKE AND COMMENT MY IDEAS✅

AUDUSD SHORT FORECAST Q2 W16 D15 Y25AUDUSD SHORT FORECAST Q2 W16 D15 Y25
Good Morning Traders!
A very similar setup to what was forecast yesterday! Take a look.
We are sitting in varies higher time frame order blocks with confluence stacking.
We have had a move off the point of interest identified yesterday and a 15' order block was created on the bearish move.
Let price action gravitate to our 15' order block in London for a continued short.
FRGNT X

AUDUSD: Detailed Support & Resistance Analysis 🇦🇺🇺🇸
Here is my latest structure analysis for AUDUSD
for this week.
Resistance 1: 0.6385 - 0.6430 area
Resistance 2: 0.6455 - 0.6470 area
Resistance 3: 0.6518 - 0.6560 area
Support 1: 0.6078 - 0.6135 area
Support 2: 0.5914 - 0.5954 area
Consider these structures for pullback/breakout trading!
❤️Please, support my work with like, thank you!❤️
I am part of Trade Nation's Influencer program and receive a monthly fee for using their TradingView charts in my analysis.

GBPAUD. Can we expect price to retrace higher?Good morning traders, we back with another idea on GBPAUD, yesterday I entered some positions and since I swing all my trades to TP/SL. Today morning following the AUD news, my stops were triggered but only due to ignorance because on Sunday as I was looking at it my plan was to enter today after the 8 am news on GBP. But it’s another lesson for the journal, on the daily TF this pair is ready to move lower but on this 1 hour we can see that price swept the liquidity below and failed to close below the lows, proving that price will move higher for our hourly high in purple.
But since I’ve hit my daily loss, I’ll just monitor and study this setup to avoid today’s loss.

Daily Chart Price Action: AUDUSD Monday 4/14/2025In this video, we are looking at Price Action movement on the Daily Chart. This includes forecasting of upward movement towards .63830 range.

AUDUSD A Fall Expected! SELL!
My dear friends,
Please, find my technical outlook for AUDUSD below:
The instrument tests an important psychological level 0.6314
Bias - Bearish
Technical Indicators: Supper Trend gives a precise Bearish signal, while Pivot Point HL predicts price changes and potential reversals in the market.
Target - 0.6202
About Used Indicators:
Super-trend indicator is more useful in trending markets where there are clear uptrends and downtrends in price.
Disclosure: I am part of Trade Nation's Influencer program and receive a monthly fee for using their TradingView charts in my analysis.
———————————
WISH YOU ALL LUCK

XAU/USD: A Huge Fall Ahead? (READ THE CAPTION)By re-examining the gold chart on the 30-minute timeframe, we can see that the price once again moved exactly as expected and finally managed to rise back above $3100, reaching as high as $3136.5! Currently, gold is trading around $3120, and I expect we will soon see further decline in gold. The potential downside targets are $3115, $3105, and $3100 respectively. This analysis will be updated again!
The Last Analysis :

AUDUSD INTRADAY key resistance retest at 0.6390 AUDUSD maintains a bullish bias, supported by the prevailing upward trend. Recent intraday movement indicates a corrective pullback toward a key consolidation zone, offering a potential setup for trend continuation.
Key Support Level: 0.6266 – previous consolidation range and pivotal support
Upside Targets:
0.6390 – initial resistance
0.6420 and 0.6550 – extended bullish targets on higher timeframes
A bullish breakout from 0.6390 would suggest continuation of the uptrend, confirming buying momentum.
However, a decisive reversal and daily close below 0.6390 would invalidate the bullish structure, opening the door for further retracement toward 0.6266, with additional support at 0.6100 and 0.6030.
Conclusion
AUDUSD remains bullish above 0.6390. A bounce from this level supports further gains. Traders should watch for confirmation signals before positioning for the next move.
This communication is for informational purposes only and should not be viewed as any form of recommendation as to a particular course of action or as investment advice. It is not intended as an offer or solicitation for the purchase or sale of any financial instrument or as an official confirmation of any transaction. Opinions, estimates and assumptions expressed herein are made as of the date of this communication and are subject to change without notice. This communication has been prepared based upon information, including market prices, data and other information, believed to be reliable; however, Trade Nation does not warrant its completeness or accuracy. All market prices and market data contained in or attached to this communication are indicative and subject to change without notice.

AUD/USD BEARS ARE GAINING STRENGTH|SHORT
Hello, Friends!
We are going short on the AUD/USD with the target of 0.621 level, because the pair is overbought and will soon hit the resistance line above. We deduced the overbought condition from the price being near to the upper BB band. However, we should use low risk here because the 1W TF is green and gives us a counter-signal.
Disclosure: I am part of Trade Nation's Influencer program and receive a monthly fee for using their TradingView charts in my analysis.
✅LIKE AND COMMENT MY IDEAS✅

Market Analysis: AUD/USD Gains Pace, Bulls Are Back?Market Analysis: AUD/USD Gains Pace, Bulls Are Back?
AUD/USD started a decent increase above the 0.6150 and 0.6200 levels.
Important Takeaways for AUD USD Analysis Today
- The Aussie Dollar rebounded after forming a base above the 0.6000 level against the US Dollar.
- There is a connecting bullish trend line forming with support at 0.6260 on the hourly chart of AUD/USD at FXOpen.
AUD/USD Technical Analysis
On the hourly chart of AUD/USD at FXOpen, the pair started a fresh increase from the 0.5940 support. The Aussie Dollar was able to clear the 0.6065 resistance to move into a positive zone against the US Dollar.
There was a close above the 0.6200 resistance and the 50-hour simple moving average. Finally, the pair tested the 0.6315 zone. A high was formed near 0.6314 and the pair recently started a consolidation phase.
There was a move below the 0.6300 level. The pair remained above the 23.6% Fib retracement level of the upward move from the 0.5913 swing low to the 0.6314 high.
On the downside, initial support is near the 0.6260 level. There is also a connecting bullish trend line forming with support at 0.6260. The next major support is near the 0.6220 zone. If there is a downside break below the 0.6220 support, the pair could extend its decline toward the 0.6205 level.
Any more losses might signal a move toward 0.6065 and the 61.8% Fib retracement level of the upward move from the 0.5913 swing low to the 0.6314 high.
On the upside, the AUD/USD chart indicates that the pair is now facing resistance near 0.6315. The first major resistance might be 0.6340. An upside break above the 0.6340 resistance might send the pair further higher.
The next major resistance is near the 0.6385 level. Any more gains could clear the path for a move toward the 0.6450 resistance zone.
This article represents the opinion of the Companies operating under the FXOpen brand only. It is not to be construed as an offer, solicitation, or recommendation with respect to products and services provided by the Companies operating under the FXOpen brand, nor is it to be considered financial advice.

Aussie H4 | Potential bullish bounceThe Aussie (AUD/USD) is falling towards a pullback support and could potentially bounce off this level to climb higher.
Buy entry is at 0.6264 which is a pullback support.
Stop loss is at 0.6170 which is a level that lies underneath an overlap support.
Take profit is at 0.6390 which is a multi-swing-high resistance.
High Risk Investment Warning
Trading Forex/CFDs on margin carries a high level of risk and may not be suitable for all investors. Leverage can work against you.
Stratos Markets Limited (tradu.com):
CFDs are complex instruments and come with a high risk of losing money rapidly due to leverage. 63% of retail investor accounts lose money when trading CFDs with this provider. You should consider whether you understand how CFDs work and whether you can afford to take the high risk of losing your money.
Stratos Europe Ltd (tradu.com):
CFDs are complex instruments and come with a high risk of losing money rapidly due to leverage. 63% of retail investor accounts lose money when trading CFDs with this provider. You should consider whether you understand how CFDs work and whether you can afford to take the high risk of losing your money.
Stratos Global LLC (tradu.com):
Losses can exceed deposits.
Please be advised that the information presented on TradingView is provided to Tradu (‘Company’, ‘we’) by a third-party provider (‘TFA Global Pte Ltd’). Please be reminded that you are solely responsible for the trading decisions on your account. There is a very high degree of risk involved in trading. Any information and/or content is intended entirely for research, educational and informational purposes only and does not constitute investment or consultation advice or investment strategy. The information is not tailored to the investment needs of any specific person and therefore does not involve a consideration of any of the investment objectives, financial situation or needs of any viewer that may receive it. Kindly also note that past performance is not a reliable indicator of future results. Actual results may differ materially from those anticipated in forward-looking or past performance statements. We assume no liability as to the accuracy or completeness of any of the information and/or content provided herein and the Company cannot be held responsible for any omission, mistake nor for any loss or damage including without limitation to any loss of profit which may arise from reliance on any information supplied by TFA Global Pte Ltd.
The speaker(s) is neither an employee, agent nor representative of Tradu and is therefore acting independently. The opinions given are their own, constitute general market commentary, and do not constitute the opinion or advice of Tradu or any form of personal or investment advice. Tradu neither endorses nor guarantees offerings of third-party speakers, nor is Tradu responsible for the content, veracity or opinions of third-party speakers, presenters or participants.
