LONG ON AUD/USDWe have a falling channel on the higher timeframe currently sitting at a major support level.
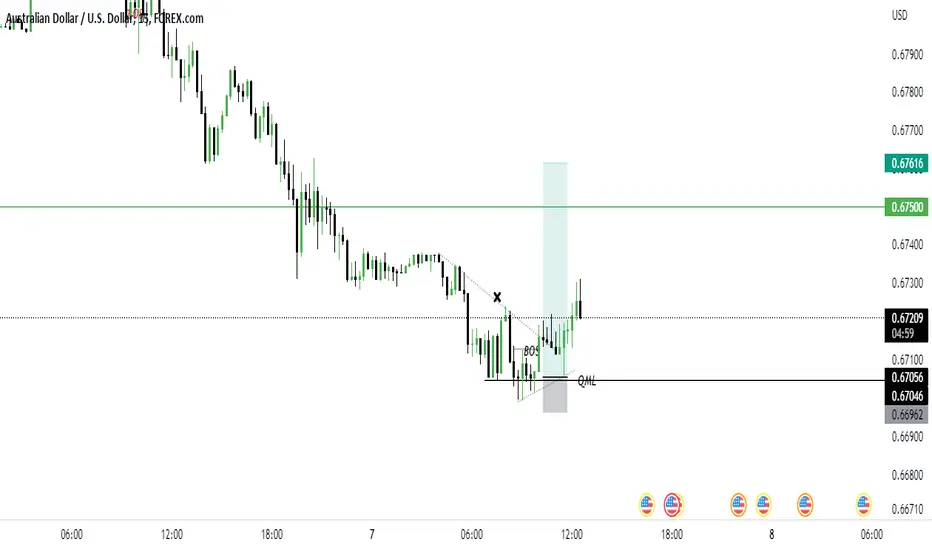
On the 15min timeframe we have formed a double bottom right at support. The dollar is currently falling at the moment.
I will be going Long on this pair.
Entry: 0.67312
Stop Loss: 0.67021 29pips
Take Profit: 0.68277 96 pips
Audusdlong

AUDUSD Potential Long!AUD-USD was trading below a falling resistance
But now we are seeing a bullish breakout
And a retest of the broken line
Which is now a support AT 0.68610
From where price growth is to be expected

AUDUSD buy the breakout!!AUDUSD (4H) has formed a very strong bullish price action after a rejection from the monthly support. The current session we see a bullish engulfer has been created and It is highly likely that AUDUSD will continue to rise as the long-term trend is up and the price is likely to test monthly resistance.
Thank you for visiting the idea. Press the like button if you enjoy the content :)

AUDUSD TO BULL UP!Thinking of the strong reverse at 0.66298 area some few days ago. I see a bull trend turn up here with AUDUSD. Fingers crossed though guys!!!

AUDUSD - Daily Trade Idea - 13-Sep-22AUDUSD (LONG)- If all the support holds in place.
If we see the Support broken out then we could see the shift in the trend.
I marked the TP 1, TP 2 , TP 3 and EXIT (SL) on the chart.
(THIS IDEAS VALID NEXT 24 HOURS)
Please note this is only the Trade Idea base on S & R and not a signal, the market can react differently during the session and only enter if we have the final confirmation for entry.

Mon 12th September 2022 AUD/USD Daily Forex Chart Buy SetupGood morning fellow traders. On my Daily Forex charts using the High Probability & Divergence trading methods from my books, I have identified a new trade setup this morning. As usual, you can read my notes on the chart for my thoughts on this setup. The trade being a AUD/USD Buy. Enjoy the day all. Cheers. Jim

AUDUSD - Daily Trade Idea - 12-Sep-22AUDUSD (LONG)- If all the support holds in place.
If we see the Support broken out then we could see the shift in the trend.
I marked the TP 1, TP 2 , TP 3 and EXIT (SL) on the chart.
(THIS IDEAS VALID NEXT 24 HOURS)
Please note this is only the Trade Idea base on S & R and not a signal, the market can react differently during the session and only enter if we have the final confirmation for entry.

AUDUSD H4Hi traders, AUDUSD..... watch price action in a mentioned area and look for long if break below then leave it or you can trade in 60m timeframe for the downside GOOD LUCK.

AUDUSD MONTHLY VIEWHi traders, AUDUSD is setting up for a long position watch price action in a lower timeframe and look for long.
NOTE : My view or idea is just a technical base not combined with fundamental so trade wisely GOOD LUCK.

AUDUSD LONGOANDA:AUDUSD
AUDUSD broke bearish structure, made a retest at a support
level. Anticipating a bullish move on AUDUSD for the entire
week.

AUDUSD buying signal SK analysisAfter finishing the orange sequence and reaching the target , market now in on the way to our orange whole correction lvl (WCL) RR 3.5:1

📈✌AUDUSD Long Position✌📉FX:AUDUSD
You can enter a short position between Now and the Yellow area.
If the price rises and reaches the risk-free level, you can risk-free the position.
TP 1 and 2 are on the chart.
The optimum stop-loss is below the determined line.
Please share ideas and leave a comment,
let me know what's your idea.
CrazyS✌

AUDUSD - Daily Trade Idea - 9-Sep-22AUDUSD (LONG)- If all the support holds in place.
If we see the Support broken out then we could see the shift in the trend.
I marked the TP 1, TP 2 , TP 3 and EXIT (SL) on the chart.
(THIS IDEAS VALID NEXT 24 HOURS)
Please note this is only the Trade Idea base on S & R and not a signal, the market can react differently during the session and only enter if we have the final confirmation for entry.

AUD/USD has formed a bullish daily candle in the demand levelA bullish candlestick has formed in the daily chart at a very important demand level. This could be a very significant development for AUD/USD
traders as price may have started reversing.
Buyers can buy as long as price doesn't break the demand zone that I have highlighted in my chart. If the reversal is confirmed then AUD/USD could reach 0.70 level in the next few weeks. 0.6680-0.6720 remains my favored buy zone.

AUDUSD Long Trade SetupA bullish opportunity recently presented itself on the aussie-dollar trading chart. This follows from the bullish engulfing candlestick pattern which printed just above the 0.66800 psychological level. A stop loss below the same psychological level and a profit target anywhere between your entry and the swing high of 0.71403 could give you a reward-to-risk ratio as high as 5 or even higher. Be sure to size your position based on your trading account balance and apply other risk management measures before placing trades.
Rooting for you!
Your FX Plug
FX:AUDUSD

AUDUSD - Daily Trade Idea - 8-Sep-22AUDUSD (LONG)- If all the support holds in place.
If we see the Support broken out then we could see the shift in the trend.
I marked the TP 1, TP 2 , TP 3 and EXIT (SL) on the chart.
(THIS IDEAS VALID NEXT 24 HOURS)
Please note this is only the Trade Idea base on S & R and not a signal, the market can react differently during the session and only enter if we have the final confirmation for entry.

AUDUSD – LONGBuying opportunity from Major Support Level and Demand Zone . Buy on a false breakout! The target is next POC level in Supply Zone.
AUDUSD – LONG
ENTRY PRICE - 0.67400
SL - 0.66700
TP - 0.69550
Always follow the 6 Golden Rules of Money Management:
1. Protect your gains and never enter into a position without setting a stop loss.
2. Always trade with a Risk-Reward Ratio of 1 to 1.5 or better.
3. Never over-leverage your account.
4. Accept your losses, move on to the next trade and trust the software.
5. Make realistic goals that can be achieved within reason.
6. Always trade with money you can afford to lose.
Please leave your comment and support me with like if you agree with my idea. If you have a different view, please also share with me your idea in the comments.
Have a nice day!

AUDUSD BUYAUDUSD What Next? BUY!
Hello Fox🦊
My technical analysis on this pair is below:
BIAS: Bullish
ENTRY: 0.67980
TARGET: 0.68992
———————————
📈#AUDUSD BUY
💹Time Frame :1H (forecast)
———————————
WISH YOU ALL LUCK🍀


AUDUSD Falling Wedge And Double BottomLooking at Trading a possible falling wedge and double bottom on AUD/USD today in the 4-hour chart.
My bias is still in fact, bearish. Prices are still moving lower and on the Daily chart, we can see we have a nice gap where prices can still fall right down to the 0,668 price level. So, looking for longs right now is all very well and good, however, we have to be careful and make sure we have bullish confirmation of a reversal before we go jumping into the deep end and going long right away.
On the 4-hour chart, we have a falling wedge with price bouncing nicely in between the top and bottom of this wedge. Usually, we will see a breakout from a falling wedge, which will usually be to the upside.
We also have a possible double bottom inside of this falling wedge. I have highlighted the neckline in yellow. We would need to see the price strongly break out of the wedge and straight through the yellow neckline. We would need to see bullish volume accompany this move to help confirm that the bulls are back.
We have partial divergence on the MACD’s Histogram. This means that the sellers may weaken and the buyers may be getting ready to regain market control.
My concern is the large gap in the daily time frame. We still have space to fall. And, if we do fall further, we can then look for further short entries, using that previous daily support level as a target. However, no short setups currently present themselves, at least to me. I am patiently waiting to see if the price will break to the upside and reclaim that yellow line as support.
We have Bullish confluence all around: Falling Wedge, Double Bottom, Partial Divergence.
But, as much as we would like to try and convince ourselves that the price will indeed reverse from this point, the truth is, that on higher time frames, the price movement is still bearish. We are still making lower lows. So, let's watch what happens today. Perhaps we will get a bullish breakout.
See you on the next one.
The Vortex Trader

Will the AUD turn on Tuesday’s rate hike? The Reserve Bank of Australia (RBA) will release its interest rate decision on Tuesday September 6. Forecasts are for another half-percent increase in the cash rate. If forecasts hold up, Tuesday’s rate hike will be the fourth consecutive 50-basis-points increase from the RBA, lifting the cash rate to 2.35% from the current 1.85%.
Still, even with another rate hike under RBA’s belt, not many investors are pegging the AUD to start outperforming the USD to any great degree or for any sustained period.
To analyse the current trend for the AUD/USD, we can use the Trend Meter Indicator. This indicator can help confirm whether the direction of a pair might turn. The Trend Meter Indicator aggregates the data from several other indicators to measure the current strength of the movement, such as the MACD, RSI signal line cross, and MA cross. If the Trend Meter Indicator shows green dots consecutively, the trend is seemingly bullish and will likely continue so long as it stays on the green side. However, if a red dot appears after a long streak of green dots, the trend might be thought to reverse.
With the use of the trend meter indicator, we can see that the indicator has already given a bearish signal at the end of August on the daily timeframe by providing a red dot indication.
Since then, there has been no sign of green dots, which means that the trend on the downside is still intact, even with support being created at 0.67800.
Traders who want to trade the pullback to the upside might want to wait for the green dot signal using this indicator. Otherwise, it may be wiser to looking for a bullish Australian dollar with other AUD pairs.

AUDUSD M30: Bearish outlook seen, further downside below 1.0040On the M30 time frame, prices are facing bearish pressure from the resistance zone at 0.68500, in line with the Fibonacci confluence levels where a pullback to this zone could present an opportunity to play the drop to our next support target at 0.6780. Prices are holding below the Ichimoku cloud as well supporting the bearish bias.
