Avalanche (AVAX) - August 8Hello?
Welcome, traders.
By "following", you can always get new information quickly.
Please also click "Like".
Have a good day.
-------------------------------------
(AVAXUSDT 1M Chart)
The key is whether it can rise above the 39.76-44.62 section.
To do that, you need to keep the price above the 15.44-20.30 range.
(1W chart)
Primary resistance: 30.03
Secondary resistance: 39.76-44.62
Support: 15.44-20.30
The intervals 15.44-20.30 and 39.76-44.62 are the intervals that determine the trend.
So, if you hold the price above 20.30, it is likely to move above 39.76.
To that end, the key is whether it can be supported by rising above 30.03 in the first place.
(1D chart)
Primary resistance: 27.95-30.03
Secondary resistance: 36.85-39.76
1st support: 23.72
2nd support: 15.44-20.30
The RSI and Stoch RSI indicators are entering the overbought zone.
Therefore, it is necessary to check where support and resistance are found when exiting the overbought zone.
If you fail to break above the 27.95-30.03 section, you should check to see if there is support around 23.72.
If it rises above 30.03 and finds support, it is likely to lead to a move towards the 39.76-44.62 section.
Therefore, the key issue is whether it can rise above 30.03 and receive support.
--------------------------------------
If you look at the 1M chart, you can see that there has been a huge decline.
Therefore, it is not easy to invest even if it shows an upward trend on the 1D chart.
However, if you are not investing now, it is highly likely that you will start investing when it rises to the 39.76-44.62 range.
The 39.76-44.62 interval is the interval that determines the trend.
So, if it moves above 44.62, it will continue its uptrend, but if it doesn't, it will go downhill.
The closer you get to this important support and resistance zone, the more likely the peak will be when you feel compelled to buy now.
Conversely, if you buy, the area that is more likely to decline is more likely to be the bottom.
Between this bottom section and the section where a full-fledged uptrend starts, it is a good section from a mid- to long-term point of view, no matter where you buy.
However, when a further decline occurs, it is important to secure adequate cash because a better opportunity may be missed due to a lack of cash.
In that sense, the method I recommend is
- Buy when the price moves sideways or when the price falls at a certain rate (for example, when it falls by -10% or -20%),
- When the price rises and receives resistance in the resistance section, sell when it rises at a certain rate (for example, when it rises by 10% or 20%).
This is a method to increase the number of remaining coins (tokens) with a small amount of cash profit by selling with the purchase principal (+ transaction fee x 2 ~ transaction fee x 20 included) when selling.
Cash management is important because this method has to be continued until the start of a full-fledged uptrend, so if you buy using too much cash at once, you may run out of cash.
Since the coin (token) secured in this way has an average purchase price of 0, it is always in a state of profit until the price becomes 0.
From a mid- to long-term perspective, the need to increase the number of coins (tokens) is to increase these coins (tokens).
------------------------------------------------------------ -------------------------------------------
** All descriptions are for reference only and do not guarantee a profit or loss in investment.
** The MRHAB-T indicator, which is inactive on the chart, contains indicators that indicate support and resistance points.
** Background color of Long/Short-S indicator: RSI oversold and overbought sections
** Background color of CCI-C indicator: When the short-term CCI line is below -100 and above +100, oversold and overbought sections are displayed.
** The OBV indicator was re-created by applying a formula to the DepthHouse Trading indicator, an indicator disclosed by oh92. (Thanks for this.)
(Short-term Stop Loss can be said to be a point where profit and loss can be preserved or additional entry through split trading. It is a short-term investment perspective.)
---------------------------------
AVAXBTC

$avax gonna melt faces. 120 day downtrend breakout/retest is finally ready.
think it'll outperform just about everything.
we simply melt up.

AVAX - 1H Pullback and next legAVAX broke the supporting zone and can fall to the next demand zone. The previous zone can act as a resistance now, so probably the price pullback to it and after that decrease more. Don't get FOMO, and don't buy on the pullback.

Avalanche (AVAX) - July 27Hello?
Welcome, traders.
By "following", you can always get new information quickly.
Please also click "Like".
Have a good day.
-------------------------------------
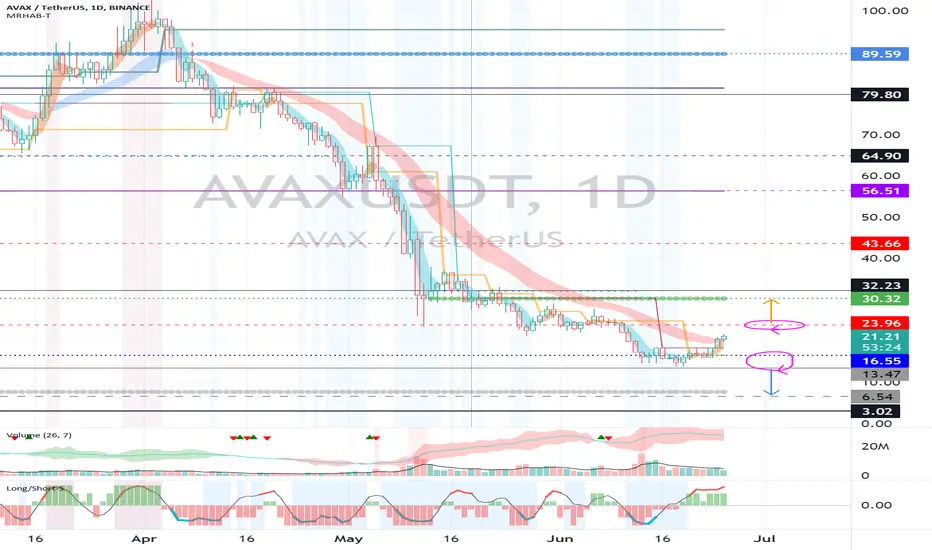
(AVAXUSDT 1W Chart)
The key is to find support in the 19.79-23.96 zone and move higher than 32.23.
If it falls below 19.79 and finds resistance, then it is likely to drop below 13.47, so trade cautiously.
(1D chart)
Primary resistance: 30.32-32.23
Secondary resistance: 43.66
1st support: 19.79-23.96
2nd support: 13.47-16.56
- The RSI indicator is falling out of the overbought zone.
- The Stoch RSI indicator is located in the oversold zone.
So, if you find support near 19.79 when you break out of the oversold zone, you would expect a short-term uptrend.
However, it may temporarily touch the 19.79 area and move higher, so you need to trade cautiously.
- In the CCI-C indicator, if the CCI line is maintained above the EMA line, it is likely to show an upward trend.
Therefore, it is necessary to ensure that the CCI line remains above the EMA line.
------------------------------------------------------------ -------------------------------------------
** All indicators are lagging indicators.
Therefore, it is important to be aware that the indicator moves accordingly with the movement of price and volume.
However, for the sake of convenience, we are talking in reverse for the interpretation of the indicator.
** The MRHAB-T indicator used in the chart is an indicator of our channel that has not been released yet.
** The OBV indicator was re-created by applying a formula to the DepthHouse Trading indicator, an indicator disclosed by oh92. (Thanks for this.)
** Support or resistance is based on the closing price of the 1D chart.
** All descriptions are for reference only and do not guarantee a profit or loss in investment.
(Short-term Stop Loss can be said to be a point where profit and loss can be preserved or additional entry can be made through split trading. It is a short-term investment perspective.)
---------------------------------

$AVAX 1D levels update25.8 stays key
close above could be worth longing otherwise play it back down to lows
only had a few trades w this as mainly traded $APE and $ETH
ww

$avax btc shorttypically don't draw out the triangles, but this one's so pretty.
one of many pairs that looks topped.
btc, as always, will hold up better than alts during this move down.

Avalanche (AVAX) - July 13Hello?
Traders, welcome.
If you "follow", you can always get new information quickly.
Please also click "Like".
Have a good day.
-------------------------------------
(AVAXUSDT 1W Chart)
The key is to find support above 13.47 and move above 23.96.
From a mid- to long-term perspective, it needs to rise above 32.23 to continue the uptrend.
(1D chart)
Primary resistance: 23.96
Secondary resistance: 32.23
Support: 13.47-16.55
If it finds support near 16.55, it is expected to move higher.
------------------------------------------------------------ -----------------------------------------------------
** All indicators are lagging indicators.
Therefore, it is important to be aware that the indicator will move accordingly as price and volume move.
However, for the sake of convenience, we are talking in reverse for the interpretation of the indicator.
** The MRHAB-T indicator used in the chart is an indicator of our channel that has not been released yet.
** The OBV indicator was re-created by applying a formula to the DepthHouse Trading indicator, an indicator disclosed by oh92. (Thanks for this.)
** Support or resistance is based on the closing price of the 1D chart.
** All descriptions are for reference only and do not guarantee a profit or loss in investment.
(Short-term Stop Loss can be said to be a point where profit and loss can be preserved or additional entry can be made through split trading. It is a short-term investment perspective.)
---------------------------------


expecting a correction for AVAXafter the drop price now seems to hold the support level indicated on the chart. if we hold the support today we can expect a rise to 18$-18.40$ area.
please like and share this idea.

Avalanche vs Bitcoin Goes Bullish (90% -165%+ Potential Profits)Avalanche is bullish on both pairings we track, AVAXUSDT and AVAXBTC.
You can find the full trade signal for AVAXUSDT below:
Avalanche Trade Signal (160%+ Potential Target)
AVAXBTC Chart Signals
- Bottom pattern.
- Trading above EMA21.
- Bullish RSI.
- Bitcoin stable above 20K.
- Altcoins market going bullish.
These are just a few signals supporting higher prices for this and other cryptocurrency trading pairs.
The targets are clearly marked on the chart.
Thank you for reading.
Namaste.

Nice long setup on AVAX- 21EMA curling above 50 EMA
- Broke support
- Bullish structure after consolidation
- Last time price reacted like this from the support and EMA's we saw a nice move towards the resistance zone around $21.50. I see this likely to happen again.
4R/R trade

AVAXUSDT 6H TA: Support & ResistanceAccording to the chart, a suitable support range has been established in the range of $14. If this range is maintained and the resistance of the channel line is broken, the price will increase to $21 and $26. Otherwise, the price will decrease to the support range of $14.
Its not Buy or Sell SIGNAL
DYOR
BY : Mohamad Teriz - @AtonicShark

Avalanche (AVAX) - June 26hello?
Traders, welcome.
If you "follow", you can always get new information quickly.
Please also click "Like".
Have a good day.
-------------------------------------
(AVAXUSDT 1W Chart)
Below 32.23 is likely to be a mid- to long-term investment area.
So, whether it can move higher than 32.23 is crucial.
(1D chart)
Resistance: around 32.23
Support: 13.47-16.55
It is necessary to check whether there is any movement that deviates from the section 16.55-23.96.
If it moves above 23.96 and finds support, I expect it to turn into an uptrend in the short-term and medium-term.
However, it is expected that it will lead to further upside only when it rises above 32.23 and needs to be supported.
------------------------------------------------------------ -----------------------------------------------------
** All indicators are lagging indicators.
Therefore, it is important to be aware that the indicator moves accordingly with the movement of price and volume.
However, for convenience, we are talking in reverse for the interpretation of the indicator.
** The MRHAB-T indicator used in the chart is an indicator of our channel that has not been released yet.
** The OBV indicator was re-created by applying a formula to the DepthHouse Trading indicator, an indicator disclosed by oh92. (Thanks for this.)
** Support or resistance is based on the closing price of the 1D chart.
** All descriptions are for reference only and do not guarantee a profit or loss in investment.
(Short-term Stop Loss can be said to be a point where profit and loss can be preserved or additional entry can be made through split trading. It is a short-term investment perspective.)
---------------------------------
AVAX/USDT Technical Analysis Price RoadMap#AVAX/USDT Technical RoadMap:-
$AVAX Currently trading at $15
And Now Trading at Support level.
I am expecting Bounce from here and $AVAX May test $28-$30 again.
Currently -90% Down From All Time High.
All Time High Price was = $147
Current Price = $15
Green Zone is Demand zone for Accumulation.
I am expecting 80%-120% bounced from here.
But Keep an mind another scenario also:-
If Price break High Demand zone then It will free fall till $3
And If Price Hit $3 then Don’t miss to buy For huge Profit.
High Demand Zone :- $10-$12
Resistance:- $30

AVAX/USDT BUYING SETUP (SCALPING)Buying #AVAX/USDT (SCALPING)
$AVAX Retesting on resistance become support after breakout double bottom at 1h timeframe
at 1D timeframe avax rejection two times after hit target down fibonacci 1.618 ( black line ) , RSI showing bullish divergence and Oversold
Buy zone : 16.45 - 16
Target : 17.29 - 18.25 - 19.23 - 20.62 - 22.58
Stop : 15.6

Avalanche AVAX Price Targets and Stop LossAVAX/USDT short
Entry Range: $90.50 - 98.70
Take Profit 1: $84.80
Take Profit 2: $73.30
Take Profit 3: $67.45
Stop Loss: $104.40

Avalanche (AVAX) - June 9hello?
Traders, welcome.
By "following", you can always get new information quickly.
Please also click "Like".
Have a good day.
-------------------------------------
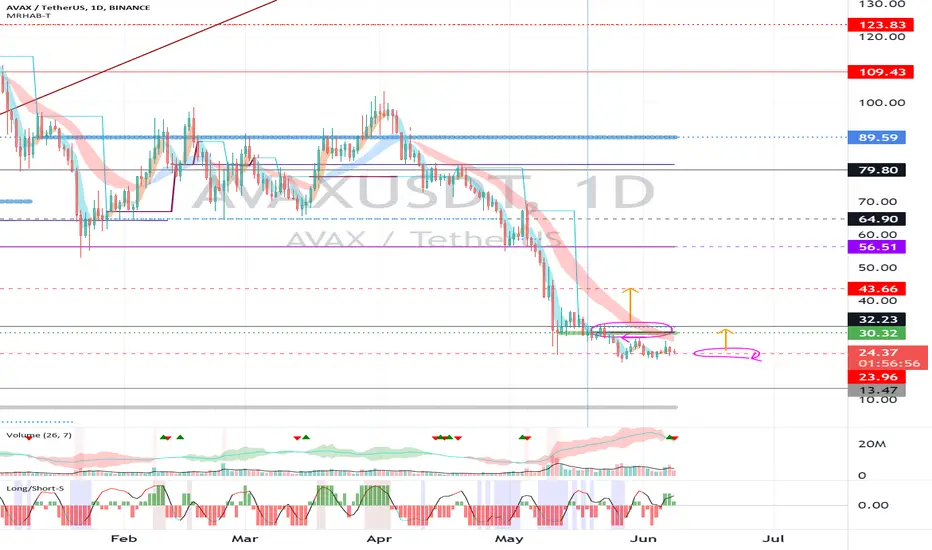
(AVAXUSDT 1W Chart)
Below 32.23 is likely to be a mid- to long-term investment area, so careful trading is required.
So, whether it can move higher than 32.23 is the key question.
(1D chart)
Whether we can find support at 23.96 and move above 32.23 will be the key.
If it moves above 30.32, I expect it to turn into an uptrend in the short and medium term.
(buy)
- After confirming the support in 32.23
(Stop Loss)
- When it falls below 30.32 and receives resistance
- When it falls below 23.96
(Sell)
- When receiving resistance in the section 56.51-64.90
- When receiving resistance in the range 79.80-89.59
If it rises above 89.59, it is expected to surge.
------------------------------------------------------------ -------------------------------------------
** All indicators are lagging indicators.
Therefore, it is important to be aware that the indicator will move accordingly as price and volume move.
However, for the sake of convenience, we are talking in reverse for the interpretation of the indicator.
** The MRHAB-T indicator used in the chart is an indicator of our channel that has not been released yet.
** The OBV indicator was re-created by applying a formula to the DepthHouse Trading indicator, an indicator disclosed by oh92. (Thanks for this.)
** Support or resistance is based on the closing price of the 1D chart.
** All descriptions are for reference only and do not guarantee a profit or loss in investment.
(Short-term Stop Loss can be said to be a point where profit and loss can be preserved or additional entry can be made through split trading. It is a short-term investment perspective.)
---------------------------------
#AVAX/USDT 2Hour UPDATE !!As we can see from the above-mentioned chart that AVAX printed an inverse head and shoulder pattern and broke the neckline.
Now it's moving to retest the neck line so here we can take entry for approx 40% profit.
Hello dear traders, we here new so we ask you to support our ideas with your LIKE and COMMENT, also be free to ask any question in the comments, and we will try to answer for all, thank you, guys.
Remember:-This is not a piece of financial advice. All investment made by me is at my own risk and I am held responsible for my own profit and losses. So, do your own research before investing in this trade.
Thanks for your time, we hope our work is good for you, and you are satisfied, we wish you a good day and big profits.
THANK YOU.

AVAX/USDT BUYING SETUP (SWING)Buying #AVAX/USDT (SWING)
$AVAX showing make a double bottom pattern, we can see avax not make a lower low this a good movement and if we see on weekly chart avax now in key support or demand zone . potential can sustain and breakout the neckline
Buy zone : 23.3 - 22 - 21
Target : 24.57 - 26.37 - 28.53 - 32- 36
Stop : 20.8

AVAXUSDT has formed a wedge pattern on H4
AVAXUSDT has formed a wedge pattern on H4 which indicates after the breakout we can expect the price to go higher. The price has made a higher low after the rejection at 22 we can expect that the price continues to move higher to the upper band of the wedge.
💎 AVAXUSDT
🔵 Entry zone 23.00 - 25.14
🟢 TP1 27.30
🟢 TP2 35.80
🟢 TP3 51.89
🔴 SL 20.60
Good Luck 🎲

AVAX 1H BUYAVAX 1H support is at ~$26
Enter 50% at the current price
and try to set some buy orders near the support zone
If AVAX holds above the trendline,
the Take-Profit target would be 5%, 10%, and 15% from your entry
Cheers

AVAX MANAGINGING TRIPLE TAP Details are mentioned in the chart . ENTER AT YELLOW LINE , STOP AT RED LINE , BAG UNLOADING AT GREEN LINES ESPECIALLY AT H1 SUPPLY .

