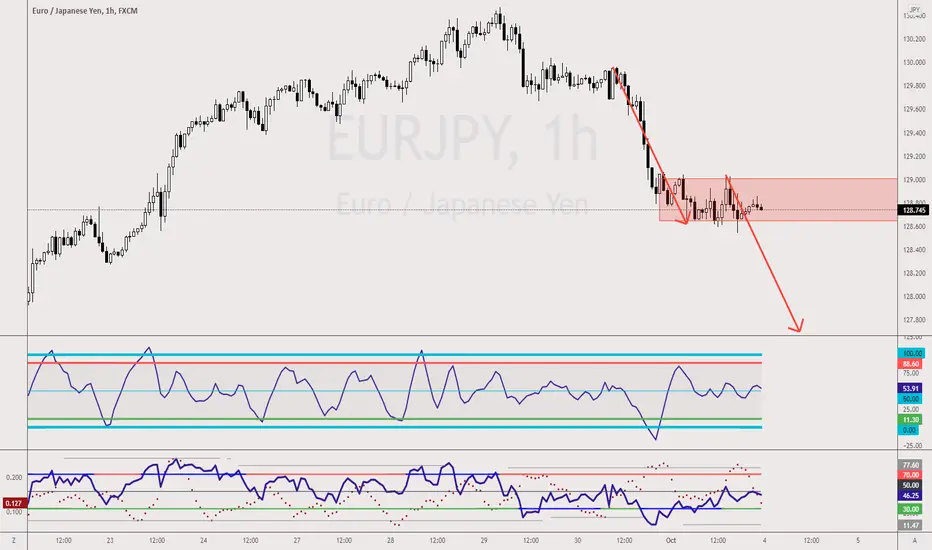
EURJPY - Bearish FlagEURJPY has a Bearish Flag setup, even if this play out, this could be a weak setup as it doesn't land on the previous support level.
Nevertheless, it is a great shorting opportunity for trend traders and if you remember that's partly because of the Bearish Shark Pattern setup that I had shared on 15 March 2021 based on the Weekly chart.
If you are still in this trade at least a 290pips run which in fact if you traded it well it should be a 489pips run. This depend on your knowledge on the Shark Pattern.
Bearish Flag
ETH BEARISH PATTERN!Ethereum is looking very bearish if this pattern plays out and it is printing a bear flag.
If ETH gets rejected at the upper resistance of the bull flag, we could see a retracement of $2500 with a wick to $2250.
Rekoctober could be in play, I think 29th 0f October from history could give us some good gains if there is no "Black Swan" event. This could last until early December or late December I do not have a crystal ball.
DYOR, safe trading.

NAS - Bear Flag in 3DThe price action in tech effectively burned both sides of the options ledger today, forming a bear flag. Patterns are probability signatures and this 9 -iron has yet to show us it's flight path.

Gold - Second Bearish Flag Pattern?From the looks of it, if you were to switch to the 1 hour timeframe, you can clearly spot what appears to be a second bearish flag pattern. For anyone who is not familiar with this, it is a pattern that provides a clear indication to traders that the trend will continue to be bearish. However, please note that in order for this to work, it needs to have a flag pole. From the last breakout from the previous bearish flag till the entry, whatever the length may be, you can expect that to be the range for another breakout.

BTC ready, set, dump!BTC big bear flag. This time incomplete upstrok, 5th wave... see what happened last times it got through the purple VWAP?? and this time?? when it's prob rady to exit the brearflag?? What's going to happen then??
Bearflag
DON't believe the pumper dumper celebrities with 100k fake followers and rubbish TA. They were early adopeters adn buy and hld and speak rubbish all over the interwebs.
DYOR.

Gold in a consolidation modeIf Gold breaks out of that bull flag, I see a further dip down to 1720, 1700...Signal: Buy Gold at CMP guys or wait for a breakout from the bear flag to the downside and you can take a short position.

General Electric (GE) Bearish FlagsIn this technical analysis, I give you an explanation for GE's price movement. After every major market correction, GE forms a bearish flag. It is my hope that after the pandemic we see another flag. The market corrections are labeled. The percent increase/decrease is measured left to right from the arrows. If you notice in the last two flags, the price hit the top resistance line so I expect this flag to hover around the price of $96. I can't estimate how long the recovery period will take or the percent increase.

EURGBP poised for a generous sell opportunity Overall my bias is bearish on EURGBP and it's currently printing a nice bearish flag. So, I'm looking for potential shorts in this area. Keep in mind it's the beginning of the week.

EURAUD Downside?Priuce has broken and retested the support trendline of a bearish flag. Will we see continued downside?

BTC - EQ in 3DBTC has found equilibrium with resistance at the four hour eight period exponential moving average (8EMA). The loss of the Fifty Period Simple Moving Average (50SMA) after the HL - HH pattern (highlighted circle) is a spot to look for resistance to the upside. The Bear Flag / Pennant confirmed to only 16.3%, failing to reach the first marker at the .214 break level.

BTC - Four Hour Bear FlagSupported by the .382 of the 64.9-28.8K retracement zone; this is the classic bear flag look. The red line is the eight period exponential moving average (8 being a fib number) and the blue line as the the 50 period simple moving average. The Bollinger Bands are based on a 20 period median with 2 standard deviations as the upper (UBB) and lower (LBB) boundaries.

EURUSD BEARISH FLAG OR BULLISH REVERSAL?Good day traders
as we have seen that EURUSD has been on a down trend for a while now. we had the liquidity below the lows taken with weak retracement and further push to the down side. we see that pattern repeating it self to fall back down to the daily DEMAND zone. so a slight retracement into 1.17520 to fill imbalance before completing the bearish flag pattern to the downside
1.17000 as target 1 and
1.16800 as target 2
good luck

GBPJPY | Bearish Continuation Correction + Ascending within ;)We've had this on watch for the past two weeks ,it looks like we're just about ready to go to the downside, all I'm waiting for now is to see if we get LTF correction after the breakout which will be our entry.

Bearish Flag and Rising WedgeI see bearish flag and rising wedge. If the upper support of the ascending wedge is broken up and a 4-hour close, this possibility will be cancelled. The first target is 44.5k when breaking below the wedge and closing in 4 hours. If the wedge target is completed and the bear flag is active, the target can range from 38k to 38.5k.

Bear flag forming? (BTC) $38,888 area of interestHello traders,
I've spotted this bear flag , and if it decided to break down the target/measured move would be $38,888.
Stay safe, could be a messy week ahead.
Please like/comment to show your support. 👍

Bitcoin repeating, few more hours till dup timeSo looking back at the wicks i have redrawn the bear flag on 4hr TF, and this would then give us a similar fractal of what occured on ATH, plus three touches to top trend line and three to the bottom, also shakes out any shorts with tight stop losses, a nice spot to look for a entry to a short if not already in one NFA trade safe

GBPUSD, 4hr tf, sell the retest of trendlineTrade ideas for GBPUSD by Hardi
After break below the descending trendline, we finally have a retest today.
Price go towards our desired price at 61.8 fibonacci retracement of recent breakout which could offer us a good 3R trade setup.
Overall if we follow it as bearish flag, the target should be around 1.35xx area but we will be satisfied if we could secure 3R.
Sell GBPUSD 1.3830
Stop loss 1.3900
Take profit 1.3620 (3R)
Use only 1-2% risk
Good luck

BTC Bear flag formationHello everyone.
the bear flag is forming, we might have another drop to 42k level
reasons for that is Rsi Rising while the price is falling, macd consolidating to green zone with out price rise. (yellow line)
see white line for direction
what i think it is consolidation before another drop.
dont trade its risky now, wait for confirmations on charts, and clear break outs.
for now i think its 80% probability we will see 42k soon
in a long run and in daily time frame, hidden bullish divergence is forming, btc need to go down more for it to play out
range of consolidation roughly was 47000 - 45500 and getting smaller, break out either way will give an idea where it can go
not financial advice and do your own research
trade safe good luck

next bitcoin drop-dump imminentlooking at a measured move down to occur in next 4hrs with a dump to around 36500k ish, then look for a slow trade back up to around 48k ish before the next big leg down to around 19k ish

Despite everything - bearish case is still active!Despite all the fundamental things - my technical look on silver keeps still being bearish.
IF the XAG/USD manages it to make daily close above 24.82 USD and overcomes the 50's SMA, the 38.2 % Fibonacci retracement, and the channel I would see more upside and this could be the end of the bearish case in silver.
Otherwise, it's IMO more likely that silver will resolve the bearish flag by breaking to the downside and will reach some price quotes around 22.40-23.00 USD.

GBPJPY, 4hr tf, break of trendlineAnother pair to trade is GBPJPY.
Setup is pretty much like my GBPCHF ideas which is bearish flag pattern.
Although this bearish flag is not as clean as GBPCHF, it is very possible GBPJPY also making a bearish flag.
Sell GBPJPY 152.00
Stop loss 152.70
Take profit 149.10 (5.5R)
Use only 1-2% risk
Good luck
Enter on your own risk

GBPCHF, 4hr tf, bearish flag patternHello guys,
It has been 2 weeks since my last post in tradingview.
I haven't found any interesting setup so I don't post anything.
Today i finally found an interesting trade to share with you all so i will share it.
As you can see, GBPCHF right now hovering at 61.8 fibonacci retracement of recent swing low. It looks like a bearish flag to me and we might get another swing to the downside.
For this pair, our position gonna be sell.
Sell GBPCHF 1.2670
Stop loss 1.2730
Take profit 1.2390 (4.67R)
Use only 1-2% risk
Good luck

USDJPY - Bearish GartleyA Bearish Gartley pattern forming 110.04 within the consolidation of the previous bearish flag pattern.
I'm waiting for candle confirmation for an entry opportunity. 3bar reversal should do.
