NZDCHF - Correction Overload!NZDCHf has been making beautiful bullish corrections all the way to the top. As we're anticipating NZD weakness, we can now look for shorting opportunities. We could possible be in a bear flag now leading to an area of interest. Watch for the flag to breakdown.
See linked chart on how to enter.
Goodluck and trade safe!
Bearish Flag

GBPUSD-Weekly Market Analysis-Mar21,Wk4GBPUSD is in a sideways consolidation. This setup allows us to trade within the zone(green box). The setup is safer when we are shorting from the top of the green box, than buying from the bottom of the green box, and the reason for that is the previous bearish trend which coincides with the starting point of Point X on the Bearish Shark.
However, if you are an aggressive trader, buying within the box can work as well and in the long run as long as you aren't flustered nor overtrade, you will be profitable.

AAVE See ya back at 208-210 area Broke structure with recent BTC dump. Expecting a 1.618 extension move which coincides with bear flag breakdown if it plays here.

Morning Update - SPX - Bear FlagThe overnight H&S hit it's target and now we have a 30 minute bear flag with resistance at the top of the range. The 10 year treasury hit 1.6 overnight after the State of the Union. The Dow hit ATH , an eventual snapback trade for the NAS is in order. The open give us direction. Scouting bounces if we consolidate. Weekly options expiry fireworks or pinned, next week monthly opex.

TESLA Short positionTesla hitting all time high, pending now to the bearish side.
There was high expectation from the Q4 earnings, that were missed.
MACD overbought, descending
Stochastic overbought, descending
With many analyst targeting the 518 level.
We will se probably a bounce on the trendline.
Dr. Michael J. Burry predicts a heavy fall on the stock price, well, lets see if he is right...

EUR/USD LONG [BEARISH FLAG]EUR/USD has been in an uptrend since last May.
Previously it had formed a bearish flag that continued the uptrend .
Currently I see another possible bearish flag forming that could once again indicate a big buy that is about to happen.
The price is currently touching the bottom trend line which indicates a reversal to continue the bearish flag, and adding to the confluence the price is also at a important support level which the price is failing to break .
Therefore I expect the price to increase until the upper trend line completing the bearish flag pattern .
The expected movement of the price is shown by the grey path drawn.

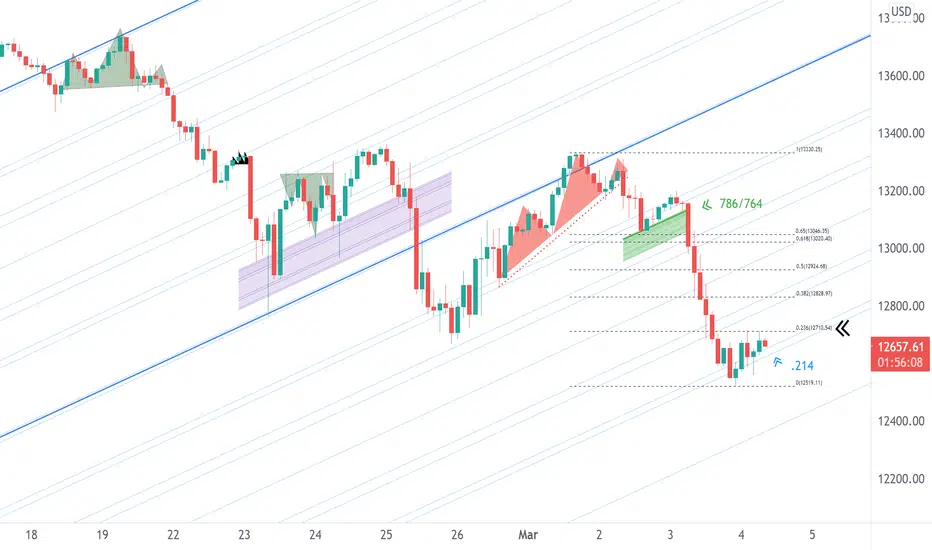
NAS - iH&S embedded in a Bear FlagLinear .236 Resistance from the recent move down. Found Blue Channel .236/.214 Support. Will the market sit on it's hands until Mr. Powell at noon?
📚 What To Look for When Charting Here is a chart of EURCAD. There were various opportunities available both short term and long term. Once you can identify chart patterns, you can easily anticipate where price will go next.
A great chart pattern that I always use is flags - Bull Flags and Bear Flags. In the chart you can see that many times price impulsed and then created a flag and then carried on with the move. Flags can be found both in higher timeframes as well as lower time frames.
Be sure to look out for them!

Bearish flag on WKHS heading below $10NASDAQ:WKHS Workhorse has had some quite bad news in the last couple of days, including the loss of a $6 billion vehicle contract, offered by UPS to one of WKHS competitors. What could have been a massive push to the company's vehicle orders is now gone. Well almost, because Workhorse management want to meet with UPS to discuss the matter. Though I would be very surprised that changes anything to the outcome of the contract awarding.
From TA perspective, buying a stock that has lost half of its value within a few days is tempting, but not always a good idea. I see it forming a bearish flag before continuing the dip, which could lead the stock below $10. The RSI is also showing a big weakness.
BUT, don't get me wrong, I don't recommend to short the stock as the risk-reward ratio is not great, but I prefer waiting for the bottom to buy, then ride the stock back up.

Bear Flag & a Head and Shoulders for GBR?Since my previous post on GBR, we've clearly seen the price breakdown from what appeared like a bullish pennant or potentially a bull flag, but the bearish divergence was/is too strong...
Currently, it appears as though the price is breaking down from a bear flag with a head and shoulders pattern noticeable. I have placed a blue human head and body icon to represent the head of the H&S pattern.
It could be an ascending triangle with a fake-out to the downside occurring now, the higher low trajectory has been negated at the upward sloping support of the pattern, in the next several trading sessions it will be more apparent.
The RSI is trading in a descending triangle creating a series of lower highs.
The DMI is showing a bearish cross where I've placed the red finger point downward.

📚 What To Look for When ChartingHere is a chart of EURCAD. There were various opportunities available both short term and long term. Once you can identify chart patterns, you can easily anticipate where price will go next.
A great chart pattern that I always use is flags - Bull Flags and Bear Flags. In the chart you can see that many times price impulsed and then created a flag and then carried on with the move. Flags can be found both in higher timeframes as well as lower time frames.
Be sure to look out for them!

GOLD - 4 ENTRIESOn the mark, I've illustrated how we had 4 entries on gold which aligned with our trading plan.
As soon as you understand which way the trend is, you can easily find loads of entries. Like my charts? Drop a like!

$FSLY bear flag into EarningsPretty obvious bear flag forming prior to $FSLY up coming Earnings report, my guess is a big gap down coming :)

GOLD - Bear Flag?Gold seems to be making somewhat of a corrective flag. Waiting to see how price reaches 1835 zone and then will short depending on price action. First target would be the 1786..

GOLD - Bear Flag?Gold seems to be making somewhat of a corrective flag. Waiting to see how price reaches 1835 zone and then will short depending on price action. First target would be the 1786..

.786 FIb Rejection Downtrent. Rising wedge/Bearish flag patternsEverything pointing towards down from price action, to market structure, to fib rejections , and chart patterns. I will take profits at 45k

Bitcoin ShortThere are some interesting things shaping up on this chart. We are currently retesting a previous area of support on the hourly which may serve as resistance. If this plays out, then perhaps the bear flag will send us to the 1st target level which sits at the 38% fibs level. Our 2nd target sits at the 50% level while the 3rd is a combination of the 61% and 78% region. If this plays out, our BART Simpson pattern will be completed. We could also see $50k being hit first before correcting. This still can be part of the overall pattern.

$SFIX -- Next leg down coming soonBear flag + my fly or die indicator both showing a big down move coming very soon :) $SFIX short pt 2

AUDCHFCHF has a positive relationship with gold, we are anticipating a large drop in gold which could reflect on the currency, wait for the bear flag to break before sell

GBPUSD 27/1/21All of yesterday, GU was in an impulse phase and towards the end of the day, a bearish flag formed, indicating bearish pattern.
Entered 2 positions and target of 1.37000 which is a 1:3 and 1:6 RR.
Ideas/opinions would be very much appreciated as I am new to this so any feedback will be taken into consideration!

XAUUSD H4 - SHORTBearish flag pattern after a strong bearish impulse leg. Look for potential sell opportunities at the upper trendline. Otherwise, wait for a clear breakdown of support zone before taking a SHORT position.

USDCNH on a bear flag 🦐USDCNH after testing the lows near a dynamic trendline retraced inside a minor ascending channel.
The market reached the 0.618 Fibonacci retracements and now testing a support
According to Plancton's strategy, if the conditions, will be satisfied, we will set a nice short position.
--––
Follow the Shrimp 🦐
Keep in mind.
🟣 Purple structure -> Monthly structure.
🔴 Red structure -> Weekly structure.
🔵 Blue structure -> Daily structure.
🟡 Yellow structure -> 4h structure.
⚫️ Black structure -> <4h structure.
Here is the Plancton0618 technical analysis , please comment below if you have any question.
The ENTRY in the market will be taken only if the condition of the Plancton0618 strategy will trigger.

XAUUSD 1H 15m RISING WEDGE BEAR FLAG SHORT TRADEWatch for MACD to cross below 0 level for confirmation.
Wait for 15m candle close below support level to enter short trade
Find your own SL & TP
