Bearish Flag

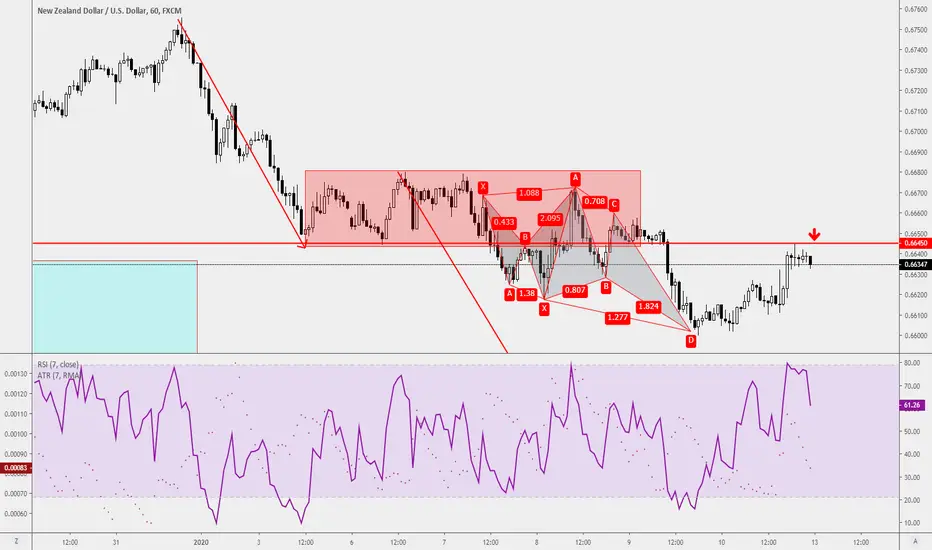
Trade Ideas Educator: NZDUSD ResistanceLooking to short at the resistance(red line), yes, just that. The bearish flag pattern has confirmed after a break and close below of the pink box, looking for trade extension towards the downside. A double top or a retracement after a bearish engulfing candle will enable me to engage this trade.
AUDCAD Bearish FlagBegun looking in to and back testing Flag patterns. Here's one I spotted while doing my usual checks of the charts.
Bottom chart is the 1440 showing us that we're still in a downward trend and have been since the first half of 2019.
Top chart is the 240 showing an initial impulse legs or flag pole, with a nice retracement.
I'd be looking to go short once price breaks and closes below the bottom flag line.
Two options for Stops and Targets.
Option A - Stops one ATR above the highest wick in the patterns and targets as an equal measured move.
Option B - Stops one ATR above the entry signal bar and targets at a re-test of the low.
Let me know what you think, any tips for someone who's looking to incorporate Flags in to my trading?

Radcom Inverse H&SLARGE Inverse H&S, a bear flag has also formed, which will most likely lead to further downsides with the presence of a tightening gaussian channel. If the bear flag collapses some nice symmetry will be seen.


EURCAD Sell IdeaD1 - Price broke below the bottom of the bearish flag pattern, bearish trend pattern (3 lower lows, lower highs structure). We may now look for pullbacks and then sells with bearish evidences.
H4 - Currently it looks like the pullback that we were looking for is happening.
H1 - Uptrend line breakout, bearish trend pattern. We may now look for bearish setups with more bearish evidences in order to join the bears.

Trade Ideas Position: NZDUSD SharkA bearish shark pattern gave a shorting opportunity for the 4-hourly timeframe bearish flag pattern as a trend trading setup.
Trade has already engaged and let's see the development of this trade.

AUDUSD Sell IdeaW1 - Price is moving inside a bearish flag pattern, price reached an important resistance zone formed by the top of this pattern, 100% fibonacci expansion of the first wave we had and it is currently moving lower. Bearish hidden divergence
D1 - Price has broken below the most recent uptrend line.
H4 - We may now look for pullbacks and then sells with more bearish evidences.


Bearish Engulfing 4h CandlestickBearish Engulfing 4hr Candlestick EUR/USD and start of crossing in VFI_LB indicator.
Vwap for entry in 1.22 target below 1.18 support.
Divergence and convergence pattern in indicator and candlestick.
Increase volume for bear in the currency.


GBPCHF OUTLOOK! Preparing SHORT strategy!GBPCHF is currently still in an upward trend compression movement. Where the price is predicted to go to the supply zone in the 1.30 area. With a valid supply in the range of these levels, and predicted to decline again. Because GBPCHF is currently making a "Bearish Flag" pattern. The scenario of a movement is predicted to rise to the supply level, then the price will try to breakout its channel pattern. To get to the targets that I gave in the picture.
Thank you for your time, attention on this idea. Please leave comments and likes, to help me keep burning up in analyzing.
Best Regards,
Don_Hawkish

UXIN Bear FlagUXIN has formed a bear flag, this may lead to potential further downsides.. A short term bounce may be observed within the flag but this will most probably break down.

GBPUSD - Trend Continuation - Bearish Flag + RetestHi Traders!
As you can see the market is in a healthy downtrend.
The market even broke out of the support at 1.29700.
The candle which broke out was a very strong candle in relation to the others.
That is a sign of strength in the market.
After that the market retests the area with a bearish flag.
If the market bounces back successfully, then there is a good chance of a trend continuation.
We recommend to sell the break of the flag with a risk-to-reward of 1 to 2.5.
Thanks and good luck :)!

NZDCAD 1D BEAR FLAG SHORT TRADEBear Flag is a form of range chart pattern. Ranges are repeatable trading chart patterns.
Flag Ranges are consolidation chart patterns that have a directional bias depending on the previous incoming trend.
Each chart pattern will have defining trendlines of the support/resistance levels creating the pattern.
What ever time frame you are trading this chart pattern, wait for a candle close outside of the trendline in the direction of the breakout candle. (Our time frame preference is the Daily chart).
Add volume indicator - Volume is the amount of $ that went into a particular candle or in Forex the # of trades that took place.
Add ATR indicator - Volatility is the amount of price movement that occurred. Use the ATR to measure the price movement.
When you see descending Volume bars and descending ATR line (which indicates volatility) this shows
a dis-interest in traders to invest in this pair creating consolidation which creates the chart pattern.
Trade Management after there is a breakout candle close.
1 - Position size (compare volume bar to volume ma line).
a - Breakout candle must be 100% of average volume for a full position size.
b - If 75% of average volume then ½ position size. (To find 75% of Volume
look at the charts volume settings – divide smaller # into larger # = 75%+)
2 - Enter two trades.
3 - SL for both trades will be 1.5 x ATR.
4 - 1st trade TP will be 1 x ATR.
5 - No TP on 2nd trade – letting profit run and adjusting SL to follow price.
6 - When 1st TP hit – move 2nd trade SL to breakeven.
7 - Adjust the 2nd trade SL to follow price.
*8 – After Breakout candle – if price closes back into chart pattern close trade
*9 - When breakout candle is more than 1 ATR from breakout candle open.
a - Enter 1st trade at candle close with ½ position size.
b - Enter 2nd trade with a pending limit order that is 1 ATR of breakout candle open.
c – Price should pullback to that pending limit order for 2nd trade.
d – If Price returns back into chart pattern close trade before SL is hit.

AUDUSD prepare to SELL! Just an idea!Now we have the potential to make SELL actions. where AUDUSD as we have seen, is currently experiencing a compression pattern. Where we also have a valid and still fresh supply area. you can place pending orders at the level that has been prepared in the picture.
Happy transactions, and don't forget to enjoy preparing for the Christmas and New Year holidays.
Best Regards,
Don_Hawkish

Bear flagbear flag given the current market climate looking for a continuation move this week into OPEX. No position.

Technical analysis of USD/CHFIntraday bias in USD/CHF remains neutral as range trading continues. In the bigger picture, medium-term outlook also remains neutral as USD/CHF is staying in the range between 0.9660/1.0237.
Until the 0.9841 support (50% Fibo retracement and the lows from Sept. and Oct.) stay intact, the rise from 0.9660 is expected to resume sooner or later. On the upside, the first resistance is 0.9926 (December 03 high). If the bulls manage to cross that level, this can act as a validation point to escalate the run-up towards 0.9980 and 1.0000 round-figure, which break will bring retest of 1.0027 area.
However, sustained break of 0.9841 will indicate near-term reversal and pave the way back to 0.9660 support. Right now the pair is testing the lower boundary, near 0.9870, of the bearish flag formation on H4 chart. Also the 50 SMA just crossed bellow 200 SMA on the same time frame, which is a death cross and indicating the potential sell-off extend. But Sellers should wait for a confirmation of the downside break of flag support to aim for the theoretical target of 0.9700.


AUD/NZD Technical analysisThe counter is in a bearish mode making lower highs and lower lows consistently.
A trendline can also be drawn connecting the lower highs of the counter.
Also, it has broken out of a bearish flag pattern.
Hence we expect the pair to be bearish in the near term.

EUR/GBP Wave analysisThe EUR/GBP pair is currently in a downtrend forming an Elliot wave.
It has completed its third and fourth wave, and resumed its fifth wave.
It has broken off a bearish flag pattern.
Hence we expect the pair to bearish in the short-term.

AUDCHF Sell IdeaD1 - 3 lower lows, lower highs structure, followed by a retrace in the form of double wave up.
Price reached an important resistance zone, bearish divergence and it has broken below the most recent uptrend line, currently it looks like a correction is happening.
H4 - The correction is happening in the form of bearish flag, bearish hidden divergence,
If the price breaks below the bottom of the bearish flag pattern we may then start looking for sells with more bearish evidences.
