Understanding Liquidity: Where Big Players Hunt Stops
Understanding Liquidity: Where Big Players Hunt Stops
Ever wondered why price suddenly spikes through your stop-loss and reverses moments later? That’s not a coincidence—it’s liquidity at play. This article will teach you how liquidity zones work, why stop hunts happen, and how to avoid getting trapped like the crowd.
🔵 What Is Liquidity in Trading?
Liquidity refers to how easily an asset can be bought or sold without drastically affecting its price. But in practical trading, liquidity is more than just volume—it’s where traders *place* their money.
Large players—institutions, market makers, or big accounts—need liquidity to fill orders.
They target areas where many retail stop-losses or pending orders are stacked.
These areas are often just above resistance or below support—classic stop-loss zones.
To move large positions without slippage, smart money uses stop hunts to trigger retail orders and create the liquidity they need.
🔵 Where Do Liquidity Zones Form?
Liquidity often builds up in predictable areas:
Above resistance: Where shorts place stop-losses.
Below support: Where longs place stop-losses.
Swing highs/lows: Obvious turning points everyone sees.
Round numbers: e.g., 1000, 10,000, 50,000.
Breakout zones: Where breakout traders place entries or stops.
These zones act like magnets. When price approaches them, it accelerates—seeking the liquidity pool behind the level.
🔵 What Is a Stop Hunt?
A stop hunt happens when price moves just far enough to trigger stop-losses before reversing. This isn’t market noise—it’s an intentional move by big players to:
Trigger a flood of stop orders (buy or sell).
Fill their own large positions using that liquidity.
Reverse price back to fair value or the prior trend.
Example: Price breaks above resistance → stops get hit → institutions sell into that liquidity → price drops sharply.
🔵 Signs You’re in a Liquidity Grab
Look for these clues:
Fast spike beyond key levels followed by rejection.
Wick-heavy candles near highs/lows.
Price touches a level, then sharply reverses.
High volume on failed breakouts or fakeouts.
These are signs of a liquidity event—not a real breakout.
🔵 How to Trade Around Liquidity Zones
You can use liquidity traps to your advantage instead of becoming their victim.
Avoid obvious stops: Don’t place stops directly below support or above resistance. Instead, use ATR-based or structure-based stops.
Wait for confirmation: Don’t chase breakouts. Let price break, reject, then re-enter inside the range.
Watch for wick rejections: If price quickly returns after a level is breached, it's often a trap.
Use higher timeframe confluence: Liquidity grabs are more powerful when they align with HTF reversals or zones.
🔵 Real Example: Liquidity Sweep Before Reversal
In this chart, we see a textbook liquidity grab:
Price breaks below support.
Longs get stopped out.
Candle prints a long wick.
Market reverses into an uptrend.
This is where smart traders enter— after the trap is set, not during.
🔵 Final Thoughts
Liquidity is the invisible hand of the market. Stop hunts aren’t personal—they’re structural. Big players simply go where the orders are. As retail traders, the best thing we can do is:
Understand where traps are set.
Avoid being part of the crowd.
Trade the reaction, not the initial breakout.
By thinking like the smart money, you can stop getting hunted—and start hunting for better trades.
Beyond Technical Analysis

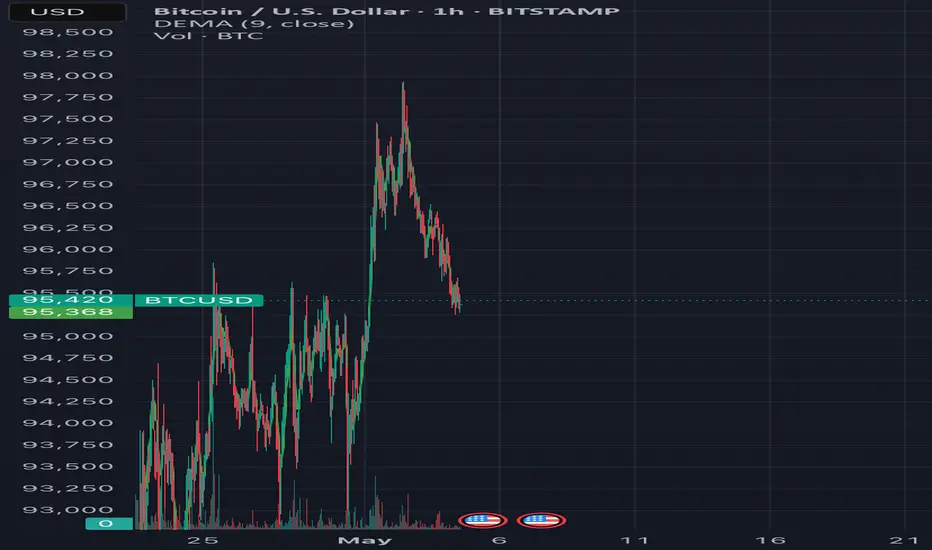
Bitcoin Price Action Analysis – Bearish Correction Toward DemandHello Guys!
Let's analyze btc!
Rising Trendline Break: The bullish structure has broken down as the price failed to hold above the key support region around $96,000–$96,200.
Targeted Demand Zone: The highlighted purple box between $94,200 and $94,700 represents a demand zone that has previously shown strong buyer interest. The current structure suggests Bitcoin may revisit this zone for a potential bounce.
Bearish Momentum: A large arrow indicates the directional bias toward the downside, aligning with the correction and market sentiment.
Fake RSI Divergence: The RSI panel indicates a “Fake Divergence” pattern, which may have misled early bulls. RSI has since dropped and currently hovers in the neutral zone, with no strong bullish signals yet.
_____________________________
Conclusion:
Unless a strong bounce occurs around current levels, Bitcoin looks poised to correct further toward the $94,200–$94,700 demand zone. Traders should watch for reactionary price action and bullish reversal patterns before considering long entries.

BTC Building Strength – Breakout Ahead?$BTC/USDT Weekly Analysis
Bitcoin continues to respect the 50 EMA on the weekly timeframe — a key dynamic support level that has consistently held throughout this bullish structure.
Each time BTC corrected, it found support near the 50 EMA before bouncing back with strength. The current structure mirrors past price action, with price again rebounding from the EMA after a consolidation phase.
We’re also seeing a pattern of lower highs forming a potential descending resistance line. A breakout above this trendline could trigger a fresh rally, possibly taking BTC to new highs.
As long as Bitcoin stays above the 50 EMA, the mid-to-long-term bias remains bullish. A confirmed breakout above the descending resistance could open the door for a strong upside continuation.
DYOR, NFA
Thanks for following along — stay tuned for more updates!

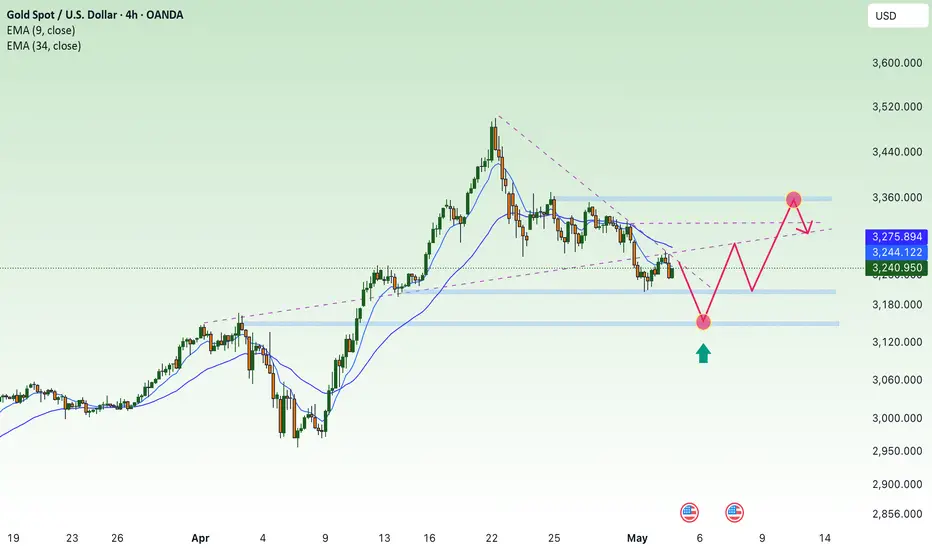
Gold (XAU/USD) - Bullish Reversal Pattern in Play Hello guys!
Let's analyze Gold!
Gold has recently broken out of a descending wedge pattern, a classic bullish reversal signal, with confirmation coming from a clear bullish divergence near the $3,200 zone. After reaching the target of the descending pattern, the price rebounded sharply and is now forming an ascending channel.
Currently, the price is approaching a key resistance zone around $3,280–$3,290. If bulls manage to push through this level, we could see a rally toward the next major resistance around $3,320 and beyond.
🔍 Key Points:
✅ Descending wedge breakout confirmed
✅ Bullish divergence near the bottom signals a momentum shift
✅ Price respecting ascending channel structure
📈target of long position: $3,290–$3,320
📉 target of short position and the entry for long: $3,240 zone
Outlook: Bullish bias remains valid as long as the price is above the $3,240–$3,250 support area. Watch for a breakout above resistance for further upside continuation.

USDJPY COT and Liquidity AnalysisCOT Report Analysis:
You might thinking why Im bearish here when we can see such high number of shorts in the COT. Here is where historical extremes comes in to play. Look how JPY Longs (USDJPY shorts) reached 10 years extreme and in the same time there is 10 years extreme net positions. Right in the time may when Dollar is seasonally strongest. ITs time to take profits from these USDJPY shorts it will take price up.
Dollar Seasonal Tendencies
Hey what up traders welcome to the COT data and Liquidity report. This is a big part of my FX Trading. Im always trying to trade with the Big players so knowing their positions is good thing.
Please be aware that institutions report data to the SEC on Tuesdays and data are reported on Fridays - so again we as retail traders have disadvantage, but there is possibility to read between the lines. Remember in the report is what they want you to see, that's why mostly price reverse on Wednesday after the report so their cards are hidden as long as possible. However if the trend is running you can read it and use for your advantage.
I created this simple free indicator which you can find in the my scripts. It's highlighting the day of the real report - Tuesday.
Here is the tip if the level has confluence with the high volume on COT it can be strong support / Resistance.
Analysis done on the Tradenation Charts
Disclosure: I am part of Trade Nation's Influencer program and receive a monthly fee for using their TradingView charts in my analysis.
"Adapt what is useful, reject what is useless, and add what is specifically your own."
— David Perk aka Dave FX Hunter ⚔️

Bitcoin Buy Opportunity: Last Chance To Buy Below $100,000Bitcoin isn't trading at $78,800 nor $80,000 nor even $85,000 but still, even a small retrace is good to buy; even a small retrace is better to buy and enter a new trade than when prices are moving up.
A strong support range consisting from the lows of December 2024, January and February 2025 can be seen mapped on the chart. The lows on these date produced a support range between $89,250 and $94,250.
Bitcoin is now not trading within this range but if it does go there let me be the one to tell you that this would be an amazing entry zone and buy opportunity. This is marked green on the chart.
The truth is that when Bitcoin goes bullish it never looks back, it grows and grows and grows but, since we are set for the 2025 bull market and several new All-Time Highs, any retraces should be bought strong because there might not be another chance like this available.
Whenever the market goes red, that's the time to buy strong, go LONG and prepare for the continuation of the bullish trend.
Whenever the market turns green, we just let it grow and secure small portions of profits when resistance is hit. Rinse and repeat.
Right now Bitcoin is red but it won't be red for too long. See the trade-idea below to understand how Bitcoin will behave around this resistance zone:
It is the inverse image of the February drop. It will range a few days around this zone and then produce a very strong advance. This is your last chance to accumulate below 100K while Bitcoin is still low.
Once Bitcoin moves above 100K, 90K is gone. Just like $75,000, it is gone for this entire cycle. Just like $80,000, you cannot buy at $80,000 anymore. The same for $85,000 or anything below 90K.
This is the last chance to buy Bitcoin below $100,000 before the continuation of the bullish trend. This opportunity can remain open for a few more hours just as it can last a few days. But it won't be available for too long. Make your decision now, Crypto is going up.
Thanks a lot for your continued support.
Namaste.

FILUSDT Potential UpsidesHey Traders, in today's trading session we are monitoring FILUSDT for a buying opportunity around 2.60 zone, FILUSDT is trading in an uptrend and currently is in a correction phase in which it is approaching the trend at 2.60 support and resistance area.
Trade safe, Joe.

XAUUSD COT and Liquidity AnalysisCOT Report Analysis:
If wee look deeper in to the COT data we can see that market makers been
actually selling this rally. Since they had 356K net longs they been taking profits
on the way. Now we can see that shorts are also slightly increasing.
I would be only bearish for now until 3000. May is also one of the strongest months for USD:
Dollar Seasonal Tendencies
Hey what up traders welcome to the COT data and Liquidity report. This is a big part of my FX Trading. Im always trying to trade with the Big players so knowing their positions is good thing.
Please be aware that institutions report data to the SEC on Tuesdays and data are reported on Fridays - so again we as retail traders have disadvantage, but there is possibility to read between the lines. Remember in the report is what they want you to see, that's why mostly price reverse on Wednesday after the report so their cards are hidden as long as possible. However if the trend is running you can read it and use for your advantage.
I created this simple free indicator which you can find in the my scripts. It's highlighting the day of the real report - Tuesday.
Here is the tip if the level has confluence with the high volume on COT it can be strong support / Resistance.
Analysis done on the Tradenation Charts
Disclosure: I am part of Trade Nation's Influencer program and receive a monthly fee for using their TradingView charts in my analysis.
"Adapt what is useful, reject what is useless, and add what is specifically your own."
— David Perk aka Dave FX Hunter ⚔️

AI Prediction SOL/USD Trading Plan 24 hours!💰 May 4, 2025 8:52 pm. SOL/USD Trading Plan
Long Scenario
- Entry: Breakout above 148.50 (volume >8,000).
- Stop-Loss (SL): 145.50 (below support).
- Take-Profit (TP): 149.50 (below resistance).
- Trailing Stop: 1.5x ATR ($0.77).
- Confirmation: Supertrend (long), MACD bullish crossover, RSI >50.
Short Scenario
- Entry: Breakdown below 146.50 (volume >12,000).
- SL: 147.50 (above resistance).
- TP: 145.50 (above support).
- Trailing Stop: 1x ATR ($0.51).
- Confirmation: Supertrend flips short, MACD bearish, CMF <0.

AI ETH Prediction for Next 6–24 Hours!May 4, 2025 4:21 pm. ETH/USD Trading Strategy
Timeframe: Short-Term (Next 6–24 Hours)
Long Scenario
- Entry: Break above 1833.50 (confirmed bullish momentum).
- Confirmation: MACD bullish crossover + RSI > 50.
- Stop-Loss (SL): 1818.00 (below support zone 1820–1825).
- Take-Profit (TP): 1838.00 (below resistance 1840).
- Trailing Stop: Activate at 1835.00, trail by 0.5%.
Short Scenario
- Entry : Drop below 1825.00 (bearish breakdown).
- Confirmation: Supertrend remains short + Stochastic RSI reversal.
- Stop-Loss (SL): 1836.00 (above resistance 1833.50).
- Take-Profit (TP): 1815.00 (above support 1815).
- Trailing Stop: Activate at 1820.00, trail by 0.5%.

XAUUSD Daily AnalysisGold long-term trend is still bullish. based on ICHIMOKU the Xauusd is in supposed correction. daily support level (3228) was touched. the price is near important support level (3188).
For next weeks:
Support levels:
3188
3166
Resistance levels:
3351
3381
After that waiting for Ichimoku to give us the exact road map.

GBPUSD BULLSGBPUSD BULLS soon to be activated, we go long at the single tap and trde the long pull back.

ETH : What the Options Are Saying (Hint: Big Move Ahead)Right now, Ethereum’s key players are positioning themselves to make some money on the rise.
And guess what? The market's already whispering where it’s headed next — but only if you know how to listen. And the loudest voice right now? Options flow on Deribit.
Let me break it down for you…
---
We caught some serious heat in the options pit lately. On Deribit, someone — or maybe a few someones — started stacking **Call options on ETH at 1,800 and 2,200 strike prices**, all under one portfolio. That’s not random. That’s a classic **Call Spread** setup, expiring June 27, 2025.
Translation? Someone’s betting hard on ETH heading north — straight toward **$2,200**.
But here's where it gets spicy. The **Max pain** for this contract sits right at **$2,000** — currently above spot price. Yeah, we’ve seen mixed stats on whether "price gravitates" to max pain like magic. But from experience? Right before expiry, price tends to *flirt* with that level.
So here's our read:
- There's **bullish sentiment** building.
- Eyes are locked on the **$2,200 zone** — likely within the next **30–50 days**.
- BTC’s playing the same game — big interest around **$100K–$110K strikes**, same expiry.
This isn’t noise. This is signal.
---
If you're tired of FOMO and want to catch the real setups before they blow up — follow. We turn complex flows into simple edge. Just actionable insights.
---
📈 *Trade smart. Stay sharp.
Join the crew that reads the market — not the hype.

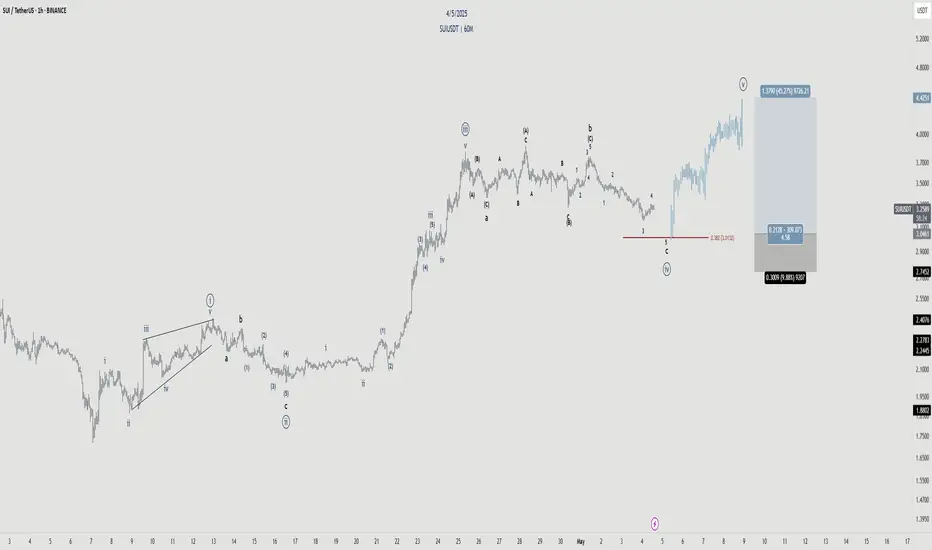
SUI - Incoming wave 5Wave structure is very defined.
Currently looking for the completion of this corrective sequence of Wave 4 before we bounce at the key level 38.2%.
Targeting the high.
XAUUSD on sell#XAUUSD price have breakout 3300 and more which is now at 3315, we expect rejection between the upper rectangle.
Sell at 3315-3317, stop loss at 3335, take profit at 3295-3280.
If H1 makes a closure above 3330 or more then bullish next target is at 3400.

Bitcoin to create new All Time High?Fundamental Analysis
Uncertainty with the Dollar.
Institutional adoption of Bitcoin undergoing unprecedented acceleration.
COT report(Bitcoin Micro Futures) as of: April 29, 2025 shows Non-commercial traders still net short(-3,958) however, a larger percentage of investors who were short the previous week have closed their short positions(-17,401) as opposed to those long(-758).
Technical analysis(Daily TF)
Possible low of the year formed in April(on the 7th)
Displacement of sellers with buy stops above previous highs(2nd & 24th March)
-2 scenarios possible;
1. Correction to fill the liquidity void created on 20th-24th of April then continuation of the bull run or
2. If the daily FVG formed on the 1st of May holds, it could support price higher.

USD/CAD: Time to Go Long?On the monthly chart, USD/CAD has found strong support, signaling a potential bullish continuation. With anticipated USD strength in the coming weeks, there’s a clear opportunity for the pair to move higher.
We are targeting 1.40180 as the first objective, with the potential to extend towards 1.41500 if momentum continues.
On the daily chart, the price is showing signs of weakness but also bullish intent, suggesting a possible retracement before a move higher. Ideally, a pullback into the 1.38490 – 1.38450 zone would offer a high-probability long entry.

Trump's announcement signals the return of buyers🔔🔔🔔 Gold news:
➡️ U.S. President Donald Trump on Sunday announced a 100% tariff on movies produced outside the country. A move to reimpose tariffs by President D. trump. Gold prices are holding on to a recovery to $3,272 early Monday as buyers return to the boom amid uncertainty over potential trade deals between the United States and its trading partners. The US dollar is back in the red amid trade uncertainty and repositioning ahead of the Fed.
Personal opinion:
➡️ A surprise move by President Trump. And it shows us that the trade agreements are still uncertain and it is positive only at the level of cooling down between the parties involved
➡️ Analyze based on important support resistance and Fibonacci levels combined with trend lines to come up with a suitable strategy
Plan:
🔆Price Zone Setup:
👉Buy Gold 3204 - 3206
❌SL: 3199 | ✅TP: 3210 - 3215 – 3320
👉Sell Gold 3313 - 3316
❌SL: 3320 | ✅TP: 3309 - 3305 – 3300
FM wishes you a successful trading day 💰💰💰

Btcusd buyThe market is in an uptrend while also taking liquidity and hitting the 61.8 fib line. The volume is show a big move coming as well.
EURGBP Next weeks overview H4This will be my view on EURGBP for the upcoming weeks.
Do I really need to give a detailed description? I will see (lol), but I might actually be publishing more ideas on whatever that I am looking at, and mostly it might be HT ; that's HT for me as a day trader and swing trader. M15 will be for a closer view, I look for my entries on M5. Let's gooo!!!

Ratio Charts in TradingView and IAAbove you can see the Bitcoin to Ethereum ratio chart. Ratio analysis between two or more symbols is a critical method for comparing the strength and weakness of assets relative to each other. TradingView offers basic capabilities for this task, but with the help of artificial intelligence (AI) and custom scripts, much more advanced and creative analyses can be conducted.
Here are some practical ideas:
1. Creating Conditional Ratio Scripts
2. Comparing Relative Averages and Issuing Smart Signals
3. Calculating Composite Ratios of Multiple Assets
4. Smart Alerts Based on Price Pattern Breakouts
For more information, search Google for "How to Use Ratio Charts in TradingView: A Hidden Gem for Traders."

Lack of bullish momentum, gold price waits, slight decrease✍️ NOVA hello everyone, Let's comment on gold price next week from 05/05/2025 - 05/09/2025
🔥 World situation:
Gold (XAU/USD) slipped by more than 0.35% on Friday and is on track to close the week with a decline exceeding 2.5%, as easing trade tensions and upbeat US labor market data boosted investor risk appetite. This shift in sentiment encouraged profit-taking ahead of the weekend, weighing on the safe-haven asset. At last check, XAU/USD was trading around $3,226, pulling back from an intraday peak of $3,269.
Adding to the improved market mood, China’s Commerce Ministry confirmed that the US has shown a willingness to resume discussions on tariffs, while reiterating that Beijing remains open to dialogue.
🔥 Identify:
Gold price continues to adjust down, lacking momentum to increase price. around price range 3200 - 3350
🔥 Technically:
Based on the resistance and support areas of the gold price according to the H4 frame, NOVA identifies the important key areas as follows:
Resistance: $3285, $3316, $3355
Support : $3202, $3155
🔥 NOTE:
Note: Nova wishes traders to manage their capital well
- take the number of lots that match your capital
- Takeprofit equal to 4-6% of capital account
- Stoplose equal to 2-3% of capital account
- The winner is the one who sticks with the market the longest
EURUSD COT and Liquidity AnalysisCOT Report Analysis:
Overall we can see strong bullish sentiment in the COT.
and price will most likely continue higher- in the longterm.
But now We can see longs are not being added also price moved right after the report.
They didn't want us to see shorting. But is visible on the commercials side.
Hey what up traders welcome to the COT data and Liquidity report. This is a big part of my FX Trading. Im always trying to trade with the Big players so knowing their positions is good thing.
Please be aware that institutions report data to the SEC on Tuesdays and data are reported on Fridays - so again we as retail traders have disadvantage, but there is possibility to read between the lines. Remember in the report is what they want you to see, that's why mostly price reverse on Wednesday after the report so their cards are hidden as long as possible. However if the trend is running you can read it and use for your advantage.
I created this simple free indicator which you can find in the my scripts. It's highlighting the day of the real report - Tuesday.
Here is the tip if the level has confluence with the high volume on COT it can be strong support / Resistance.
Analysis done on the Tradenation Charts
Disclosure: I am part of Trade Nation's Influencer program and receive a monthly fee for using their TradingView charts in my analysis.
"Adapt what is useful, reject what is useless, and add what is specifically your own."
— David Perk aka Dave FX Hunter ⚔️
