Each Timeframe gives you crucial information so USE IT!!!All the information you need to find a high probability trade are in front of you on the charts so build your trading decisions on 'the facts' of the chart NOT what you think or what you want to happen or even what you heard will happen. If you have enough facts telling you to trade in a certain direction and therefore enough confluence to take a trade, then this is how you will gain consistency in you trading and build confidence. Check out my trade idea!!
www.tradingview.com
Beyond Technical Analysis

Natural Gas: Watching for a Break Above 3.40 to Re-Enter LongOverall, I remain bullish on natural gas, as I mentioned yesterday, and even entered a position.
However, I didn’t hold through the entire move. There are definitely some issues with overtrading that I need to work on.
At the moment, I’m out of the market and considering a re-entry only if yesterday’s high at 3.39 is broken.
If the price moves above 3.40, I plan to re-enter the position, targeting the 3.60 level.

XAUUSD Bearish Setup: Rising Wedge Breakdown Towards 3,166 Targe Overview
This chart illustrates a high-probability bearish setup for XAUUSD based on the breakdown of a rising wedge pattern. Rising wedges typically signal a potential reversal or correction, especially when they occur near a resistance zone and are followed by lower highs and diminishing bullish momentum.
🔍 Technical Breakdown
📐 Rising Wedge Pattern
The price of gold has been rising within a narrowing wedge, forming higher highs and higher lows but within converging trendlines.
This structure generally suggests weakening bullish momentum, and a breakdown is often followed by sharp bearish movement.
The breakdown from the wedge is already starting to form, as price struggles to make new highs near resistance.
🟥 Resistance Level (~3,280 – 3,300)
This area has historically acted as a supply zone.
Recent candlestick wicks show clear rejection in this area, confirming the presence of strong selling pressure.
Price failed to break above this level convincingly, indicating buyers are losing control.
🟩 Support Level (~3,200 – 3,215)
This zone provided a short-term base before the wedge formation.
If the wedge breaks, price may retest this zone on the way down.
If broken, this support could flip into resistance during a pullback.
🎯 Trade Setup
Bias: Bearish
Pattern: Rising Wedge
Timeframe: Suitable for short-term to swing trades (1H – 4H)
✅ Entry Point
Enter short on confirmation of a wedge breakdown (strong bearish candle close below the lower trendline).
Conservative traders can wait for a retest of the broken trendline for additional confirmation.
📉 Target
Primary Target: 3,166.10 – Measured move from wedge height and also aligns with a previous support area.
This area could act as a profit-taking zone as it represents both technical and psychological support.
🛑 Stop Loss
Place SL above the wedge resistance, around 3,313.69.
This protects against false breakouts or unexpected bullish reversals.
⚠️ Risk Management
Only risk a small percentage of capital (1–2%) per trade.
Ensure confirmation before entry – avoid entering early on low-volume breakdowns.
Consider scaling out partial profits near the support zone before the full target is hit.
🔧 Confluence & Validation
The setup aligns with basic price action principles: lower highs at resistance and exhaustion of bullish momentum.
Volume tends to drop during wedge formation and pick up during breakout – monitor volume for confirmation.
RSI or MACD divergence may further validate the bearish momentum.
🏷️ Conclusion
This rising wedge on XAUUSD presents a textbook short setup with a favorable risk-to-reward ratio. The structure, resistance zone, and loss of momentum indicate a potential shift to the downside. Traders should watch for confirmation before entering and use disciplined stop-loss management.

Week ahead analysis May 4th to 11th**Week Ahead Analysis (May 5 – May 11, 2025)**
### **Baseline: Market Expectations**
- **Tariffs & Fed Policy:** Trump's tariff announcement has heightened concerns about economic slowing, prompting bond markets to price in up to four Federal Reserve rate cuts this year.
- **Trade Talks & Sentiment Shift:** Reports suggest China may restart trade negotiations, boosting risk sentiment. However, China insists the U.S. must first remove all unilateral tariffs, adding uncertainty to the discussions.
- **Market Reaction:** Risk assets—equities and high-beta currencies like AUD, NZD, and CAD—are climbing as volatility cools. Meanwhile, safe havens such as JPY, CHF, and gold are facing selling pressure, though overall risk sentiment remains cautious.
### **Potential Surprise Scenarios**
- **Trade Deal Secured:** A deal would likely send equities higher, strengthen risk-sensitive currencies, and drive safe havens lower.
- **No Deal Reached:** In contrast, safe havens could gain while risk assets retreat.
### **Big Picture Outlook**
Regardless of the immediate outcome, the market's medium-term trajectory hinges on the broader effects of trade policy. If tariffs persist, economic uncertainty may sustain the Fed’s dovish stance. A successful trade deal, however, could restore confidence, shifting expectations back toward growth stabili

Daily Analysis- XAUUSD (Monday, 5th May 2024)Bias: No Bias
USD News(Red Folder):
-ISM Services PMI
Analysis:
-Strong bullish momentum on market open
-Looking for retest 0.5 fib level
-Potential BUY/SELL if there's confirmation on lower timeframe
-Pivot point: 3200,3300
Disclaimer:
This analysis is from a personal point of view, always conduct on your own research before making any trading decisions as the analysis do not guarantee complete accuracy.

XAUUSDthe BEARS are back in control with the bull having tested and resoected the trendline, sweeped the NY high and the M15 closed below the SUPPLY.

Gold is melting downwe are going into corrective wave on Gold on 4H time frame
we finished the first pulse move of this correction wave on 1H TF and most likely the second too
we are now in the third pulse correction move which maybe take gold to 3000
we will sort Gold from this area
sell price around 3,320
stoploss 3,333
Target 3,270
RR 1 : 3

MSTR - Next Wave UpJust made a new high.
That is likely a clue of what happens next with Bitcoin.
It was a running 3 wave 1:0.618 Golden Window correction.
That is a weak ratio and ideal for a continuing uptrend.
But most importantly it was a re-test for support:
That dip buy was there to be gobbled up.
If you didn't see it then this probably goes up and up from here 👍.
Not advice


gold buys quick break down gold buys wanted to go through mindset on lower time frame how I'm managing the trade etc

Breakout trading point: 1861.57
Hello, traders.
If you "Follow", you can always get new information quickly.
Please click "Boost" as well.
Have a nice day today.
-------------------------------------
(ETHUSDT 1D chart)
The 1861.57 point is the HA-Low indicator point on the 1W chart.
The key is whether it can receive support and rise around the A section, that is, 1861.57.
Since the HA-Low indicator on the 1D chart is formed at the 1647.06 point, it is important whether it can receive support and rise in the 1647.06-1861.57 section.
If it shows support in the 1647.06-1861.57 section, it is a time to buy.
-
If it falls from 1647.06, there is a possibility that a stepwise downtrend will continue, so you should also consider a response plan for this.
In the case of a decline, the Fibonacci ratio section of 0 (1190.57) ~ 0.786 (1259.39) is expected to be an important support and resistance section.
-
Since the price is located below the M-Signal indicator on the 1M chart, it is recommended to conduct trading from a day trading or short-term trading perspective.
When it breaks through the 1861.57 point, a breakout trade is possible, but as I mentioned earlier, trading requires a short and quick response.
-
If the StochRSI indicator is above the midpoint, it is recommended to focus on finding a time to sell, and if it is below the midpoint, it is recommended to focus on finding a time to buy.
When creating a trading strategy by referring to the movement of these auxiliary indicators, you must check whether there is support at the support and resistance points drawn on the 1M, 1W, and 1D charts.
-
Thank you for reading to the end.
I hope you have a successful trade.
--------------------------------------------------
- Here is an explanation of the big picture.
I used TradingView's INDEX chart to check the entire range of BTC.
I rewrote the previous chart to update it while touching the Fibonacci ratio range of 1.902 (101875.70) ~ 2 (106275.10).
(Previous BTCUSD 12M chart)
Looking at the big picture, it seems to have been maintaining an upward trend following a pattern since 2015.
In other words, it is a pattern that maintains a 3-year bull market and faces a 1-year bear market.
Accordingly, the upward trend is expected to continue until 2025.
-
(Current BTCUSD 12M chart)
Based on the currently written Fibonacci ratio, it is displayed up to 3.618 (178910.15).
It is expected that it will not fall again below the Fibonacci ratio of 0.618 (44234.54).
(BTCUSDT 12M chart)
Based on the BTCUSDT chart, I think it is around 42283.58.
-
I will explain it again with the BTCUSD chart.
The Fibonacci ratio ranges marked in the green boxes, 1.902 (101875.70) ~ 2 (106275.10) and 3 (151166.97) ~ 3.14 (157451.83), are expected to be important support and resistance ranges.
In other words, it seems likely that they will act as volume profile ranges.
Therefore, in order to break through these ranges upward, I think the point to watch is whether they can receive support and rise near the Fibonacci ratios of 1.618 (89126.41) and 2.618 (134018.28).
Therefore, the maximum rising range in 2025 is expected to be the 3 (151166.97) ~ 3.14 (157451.83) range.
In order to do that, we need to see if it is supported and rises near 2.618 (134018.28).
If it falls after the bull market in 2025, we don't know how far it will fall, but based on the previous decline, we expect it to fall by about -60% to -70%.
Therefore, if it starts to fall near the Fibonacci ratio 3.14 (157451.83), it seems likely that it will fall to around Fibonacci 0.618 (44234.54).
I will explain more details when the bear market starts.
------------------------------------------------------

EURNZD 4HR ENTRY SHORTprice broke trendline + retested the broken trendline, you now wait for lower timeframe confirmation to enter or use your entry model as I've got my confirmation and entry model which I use only for entries after I've established the bias!!

EURNZD MONTHLY TIMEFREAMEKey monthly level spotted but what we liked most was the massive rejection candle close for last month where buyers pushed so much high but couldn't win the sellers as sellers pushed price down that made the past month candle close with little to no body but with long rejection wick candle telling us that sellers took control!

USDCAD Potential Long PlayRetailers are short + bullish structure + Strong Demand zone. Potential Play? only problem, the zone does seem kinda at equillibrium

NASDAQ SELL?This is just a rough idea, I still need to wait and see where the market moves to and rejects from in order for TP and SL placement.
But, there is a Asian high, a London high and a NY high sitting closely together, causing what I call a liquidity pool, and we all know that liquidity moves the market. its like a magnet for the market.
so I'll be waiting and watching to see which session is swept and how the market reacts. But all in all, this is what i personally think Nasdaq will do
what are your thoughts? I would love to hear them.
I hope you all have a fantastic week and you rake in those profits.
God bless
J.D.L

XAUusd Scenario 05/05/2025 This week, Gold presents two potential scenarios based on current price action and key technical levels. While both a bullish and bearish outcome are possible, I’m leaning toward the bearish scenario and awaiting confirmation to capitalize on a potential downside move.

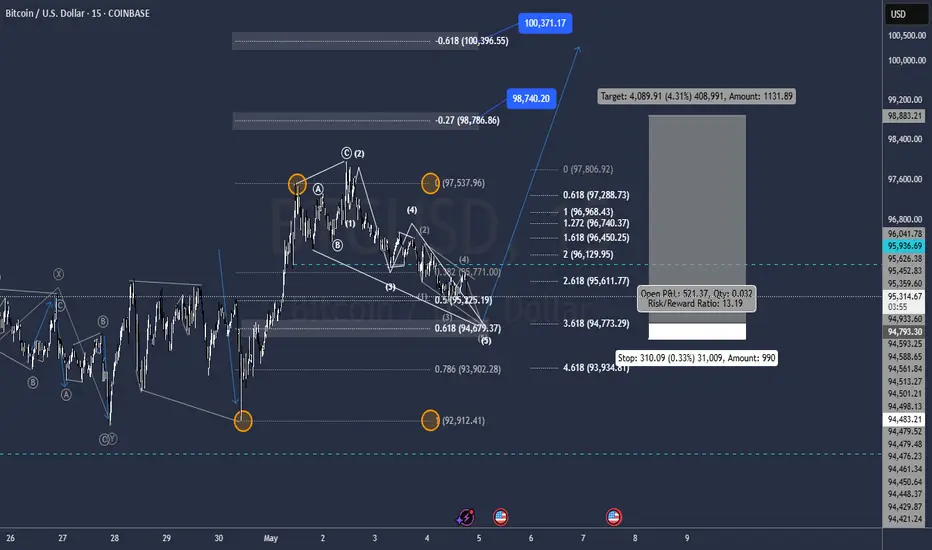
Bircoin correction should End @ 94.800Correction About to Complete Wave 5 for Expnding Flat Correction
Matching .618 Retracement and 3.618 wave 1 of C Expansion to the pip @ 94.800.
Targets @ 98.750/ 100.350 And Further
Bitcoin Buy Opportunity: Last Chance To Buy Below $100,000Bitcoin isn't trading at $78,800 nor $80,000 nor even $85,000 but still, even a small retrace is good to buy; even a small retrace is better to buy and enter a new trade than when prices are moving up.
A strong support range consisting from the lows of December 2024, January and February 2025 can be seen mapped on the chart. The lows on these date produced a support range between $89,250 and $94,250.
Bitcoin is now not trading within this range but if it does go there let me be the one to tell you that this would be an amazing entry zone and buy opportunity. This is marked green on the chart.
The truth is that when Bitcoin goes bullish it never looks back, it grows and grows and grows but, since we are set for the 2025 bull market and several new All-Time Highs, any retraces should be bought strong because there might not be another chance like this available.
Whenever the market goes red, that's the time to buy strong, go LONG and prepare for the continuation of the bullish trend.
Whenever the market turns green, we just let it grow and secure small portions of profits when resistance is hit. Rinse and repeat.
Right now Bitcoin is red but it won't be red for too long. See the trade-idea below to understand how Bitcoin will behave around this resistance zone:
It is the inverse image of the February drop. It will range a few days around this zone and then produce a very strong advance. This is your last chance to accumulate below 100K while Bitcoin is still low.
Once Bitcoin moves above 100K, 90K is gone. Just like $75,000, it is gone for this entire cycle. Just like $80,000, you cannot buy at $80,000 anymore. The same for $85,000 or anything below 90K.
This is the last chance to buy Bitcoin below $100,000 before the continuation of the bullish trend. This opportunity can remain open for a few more hours just as it can last a few days. But it won't be available for too long. Make your decision now, Crypto is going up.
Thanks a lot for your continued support.
Namaste.

GBPUSD BULLSGBPUSD BULLS soon to be activated, we go long at the single tap and trde the long pull back.

PineScript v6: Conditional Expressions from Libraries
I thought it appropriate to make some quick notes on calling conditional expressions from PineScript v6 libraries, seeing as I have recently updated all of my libraries to v6 and most of my function exports output booleans or values that are ultimately derived from other functions that output booleans.
When calling functions in v6 that output booleans or values derived from other functions that output booleans, it is best practice to first declare the function return globally before you use said output as input for anything else.
For example, instead of calling my swing low and uptrend functions (which both return booleans) as part of a broader conditional expression:
//@version=6
indicator('Example Conditional Expression 1')
import theEccentricTrader/PubLibSwing/3 as sw
import theEccentricTrader/PubLibTrend/2 as tr
uptrend = sw.sl() and tr.ut()
plotshape(uptrend)
I would first declare the function returns as global variables and then call the broader conditional expression using said variables:
//@version=6
indicator('Example Conditional Expression 2')
import theEccentricTrader/PubLibSwing/3 as sw
import theEccentricTrader/PubLibTrend/2 as tr
sl = sw.sl()
ut = tr.ut()
uptrend = sl and ut
plotshape(uptrend)
This demonstrates different behaviour from v5, where you could combine functions that output booleans in conditional expressions without error or warning.
The same also applies to functions that output values derived from other functions that output booleans. In the example below, my swing low price and bar index functions output float and integer values, respectively, but these values are derived from the swing low function, which is a function that returns a boolean. So these return values should also be first declared globally for later use, just like the swing low and uptrend functions:
//@version=6
indicator('Example Conditional Expression 3', overlay = true)
import theEccentricTrader/PubLibSwing/3 as sw
import theEccentricTrader/PubLibTrend/2 as tr
sl = sw.sl()
ut = tr.ut()
slp_0 = sw.slp(0)
slpbi_0 = sw.slpbi(0)
slp_1 = sw.slp(1)
slpbi_1 = sw.slpbi(1)
if sl and ut
line.new(slpbi_1, slp_1, slpbi_0, slp_0, color = color.green)

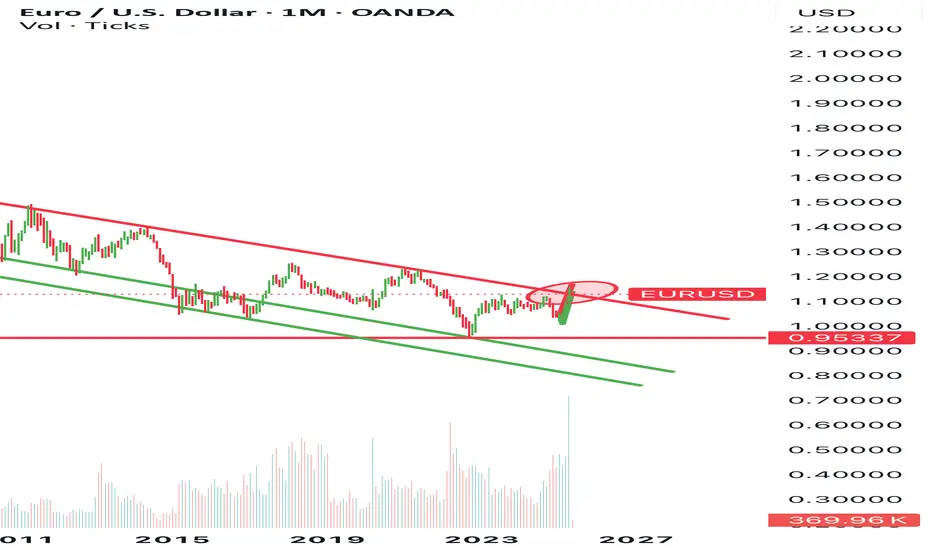
THE EUR/USD IS DROPPING! DONT MISS OUTI believe the EURUSD will drop SIGNIFICANTLY (to around 0.8). Here is why:
Europe’s economy is spiraling out of control. Manufacturing is contracting, with the latest PMI figures showing a disastrous 45.1—FAR FAR BELOW the 50 threshold that indicates growth. Energy prices are skyrocketing, businesses are struggling, and consumer confidence is plummeting. The European Central Bank (ECB) is in a state of desperation, resorting to crazy interest rates to salvage the economy, but its efforts are only making the euro less appealing to investors.
The ECB’s actions are signaling its desperation. Governing Council member Yannis Stournaras has already hinted at aggressive rate cuts throughout 2025, aiming to bring rates down to 2% by the end of the year. This move is a death sentence for the euro. Lower rates mean reduced demand for the currency, and investors are fleeing to safer assets. The ECB is essentially handing victory to the dollar on a silver platter.
While the euro is experiencing a significant decline, the U.S. dollar is experiencing a remarkable surge. The Federal Reserve is adopting a cautious approach to rate cuts, indicating that the U.S. still offers higher returns on investments, making the dollar far more attractive compared to the euro. So, investors are abandoning euros and hoarding dollars, accelerating the downward spiral of the euro’s value. Which would in turn make the EURUSD drop
Furthermore, the recent strength in the euro was merely a mirage, as history suggests that such rallies cannot endure. The underlying fundamentals are fundamentally flawed, with the U.S. economy outperforming Europe in terms of growth, innovation, and resilience. The euro’s rise was unsustainable, and now reality is crashing down upon it. The market is correcting, and the euro is plummeting.
Moreover, the bond markets are in turmoil. The U.S. bond market has been aggressively sold off, but China is ramping up its purchases of 10-year T-bills. This influx of capital into the U.S. is further strengthening the dollar, making it difficult for the euro to compete with the demand for U.S. assets.
Additionally, the uncertainty surrounding the trade war between the U.S. and China has shaken global markets. Investors are panicking and seeking safe havens, but the euro is not one of them. The uncertainty surrounding U.S.-China trade relations is driving capital into the dollar, leaving the euro to deteriorate further.
Lastly, my technical analysis suggests that the EUR/USD is in freefall. The pair began 2023 on a rocky path, dropping 0.8% on the first trading day of the year. It has broken key support levels, and traders are rapidly turning bearish. I am expecting a catastrophic crash for the euro based on trendlines, RSI levels and more from the monthly charts, weekly, daily, and even the 4H. No matter what chart you use they all suggest the same idea. The EURUSD will drop.
So I’m shorting. If I am wrong then what the EURUSD has been doing for the past 17 years is about to somehow change, and the news is wrong, the charts wouldn’t add up etc. in that crazy scenario, sure the EURUSD may rise a bit but let me tell you guys.. I am so sure of this, more sure than any other trade. Do your own research and don’t just blindly believe me, but I will be shorting.
AI ETH Prediction for Next 6–24 Hours!May 4, 2025 4:21 pm. ETH/USD Trading Strategy
Timeframe: Short-Term (Next 6–24 Hours)
Long Scenario
- Entry: Break above 1833.50 (confirmed bullish momentum).
- Confirmation: MACD bullish crossover + RSI > 50.
- Stop-Loss (SL): 1818.00 (below support zone 1820–1825).
- Take-Profit (TP): 1838.00 (below resistance 1840).
- Trailing Stop: Activate at 1835.00, trail by 0.5%.
Short Scenario
- Entry : Drop below 1825.00 (bearish breakdown).
- Confirmation: Supertrend remains short + Stochastic RSI reversal.
- Stop-Loss (SL): 1836.00 (above resistance 1833.50).
- Take-Profit (TP): 1815.00 (above support 1815).
- Trailing Stop: Activate at 1820.00, trail by 0.5%.

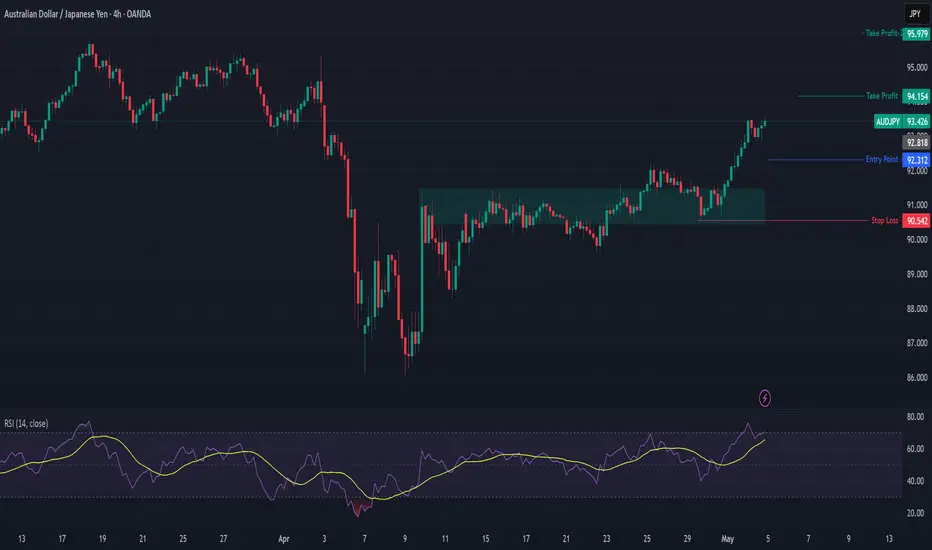
AUDJPY Trade Setup (Bullish Bias)🔥 Setup Summary:
Item Details
Bias: ✅ Bullish
Reasoning:
- Fundamentals strong (expectation no interest rate cuts + CPI bullish)
- JPY weak + overbought COT
- Exogenous: AUD strengthening
- Seasonality bearish short-term BUT medium-term bias bullish
Primary Entry: 🔑 92.30 (Buy Zone)
Dip Buy Zone: 🔄 91.80 – 92.00 (0.5–0.618 Fib retrace)
Stop Loss: 🚫 90.54 (below structure + 0.786 Fib)
Take Profit 1: 🎯 94.15 (below last swing high)
Take Profit 2: 🎯 95.00+ (extended target for trend continuation)
Risk:Reward: ~1:3+ (Entry at 92.3 / TP at 94.15–95.00)