SUSDT - This opportunity might not come around again.!All tokens built on the Ethereum network pumped yesterday as ETH moved up by just 4%, and SONIC (S) stood out as the top performer among them, surging by around 22%.
Currently, the coin has formed a symmetrical triangle pattern, which has been broken to the upside with a massive green candle. It's now retesting the 0.382 Fibonacci level — a key zone to watch for continuation.
This is a massive investment opportunity to buy the token at around $0.55 only.
The long-term targets for S in 2026 are insane — the most conservative target for now is $1.20.
Best regards Cecilion🎯
Beyond Technical Analysis

BTCUSDT BuyHello traders,
I realized I haven’t shared any signals for BTCUSDT before, so I wanted to post a new one.
You can open a **Buy** trade on BTCUSDT.
The TP target is **97,133.71** and the SL level is **96,223.99**.
The trade is currently active on my side.
Wishing everyone lots of profits!
🔔 I post detailed trade ideas and daily market analysis like this every day on my TradingView profile.
👉 Follow me to get notified and read the full breakdowns.

SBIN pattern break SBI bank inverted head and shoulder pattern break and retest done
you can consider current price target of 875 with SL 730

We need to at least close at 353 ... This channel is not providing individualized trading or investment advice, nor is it a banking service, brokerage service, trading service, investment service or money management service.

GOLD POSSIBLE BUY It has been a tough month from the month of April, now this is the month of may , full with different opportunity, let's sure we respect our plan, including risk management

#XAUUDA Short Signal? A "close below 3250 short signal" for #XAUUSD** (Gold Spot/U.S. Dollar) indicates a potential bearish trading opportunity if the price closes below the key level of **3,250** on the 15-minute chart. Here's the breakdown:
### Key Observations:
1. **Current Price**: 3,251.365 (slightly above 3,250).
2. **Critical Level**: 3,250 acts as a psychological and technical #support/#resistance level.
3. **Bid/Ask Spread**:
- **SELL (Bid)**: 3,250.770
- **BUY (Ask)**: 3,251.590
#Signal Interpretation:
- #Short_Signal_Trigger**: A confirmed close **below 3,250** on the 15m chart suggests weakening bullish momentum and potential downward movement.
- **Targets**: The next support levels to watch are **3,248 → 3,244 → 3,240**, with stronger support near **3,215–3,207**.
- **Invalidation**: A rebound above **3,256–3,260** would negate the bearish bias.
### Execution Tips:
- **Confirmation**: Wait for a full 15m candle to close below 3,250 to avoid false breakdowns.
- **Risk Management**: Place a stop-loss just above recent resistance (e.g., 3,256–3,260) to limit downside risk.
- **Context**: Monitor broader market conditions (e.g., USD strength, geopolitical events) that could impact gold prices.
This setup aligns with a classic technical trading strategy, leveraging price action around key levels. Always validate with additional indicators (e.g., RSI, volume) if available.

NO PAIR IN MY WATCHLIST TODAYThere Is No Pair In My Watchlist The Market Is Still Shaping Up! I Always Use This Time To Reflect On My Trading And See How I Perform And What I Can Improve! This Helps Me To Become Profitable And Have A Consistent Winning Rate!

Its just for my future selfThe pattern i made is based on the bitcoin 4 year cycles and support/ressistance areas. I think the top will be at 170-200k, but its not really matters because i will get out at the end of the year from everything and start a short and not comeback until exactly 1 year from the top or wait until the blockware gravity model is equal with the price, then all in bitcoin, after that i will wait 1-1,5 years and hold btc, then re enter into alts.
Its just a post for my future self.

Gbpusd potential sell setup Current market analysis reveals a potential sell zone in the GBPAUD pair. Key factors contributing to this setup include:
- Resistance sell level 1.33100 to 1.33054
- Overbought conditions on the RSI
- Bearish divergence on the MACD
*Sell Zone Details:*
Sell zone: (1.33100-1.33054
Take profit (1) 1.32900
Take profit (2) 1.32669
Stop loss:(1.33231)
Monitor price action and adjust strategies accordingly. Trade with caution.

Gold next possible move Is down"Hello traders, let's analyze the current market conditions. Based on our technical analysis, we've identified a potential sell zone around $3260. The price has reached a key resistance level, and indicators suggest a possible reversal.
Key factors contributing to this sell zone include:
- Resistance at $3260
- Overbought conditions on the RSI
- Bearish divergence on the MACD
If the price fails to break above $3260-$3265, it may signal a downturn, targeting $3245-$3240 as the next support level. Let's monitor the price action closely and adjust our strategies accordingly."
Comments your thoughts traders what you thinks about this setup

Why Has the USD Been Falling?Dollar has lost value against many currencies since January. Why is that?
The Dollar’s decline didn’t start with the recent ‘Liberation Day’ tariffs. In fact, it has been gradually weakening since the 1970s.
U.S. Treasury Futures & Options
Ticker: 6E
Minimum fluctuation:
0.000050 per Euro increment = $6.25
Disclaimer:
• What presented here is not a recommendation, please consult your licensed broker.
• Our mission is to create lateral thinking skills for every investor and trader, knowing when to take a calculated risk with market uncertainty and a bolder risk when opportunity arises.
CME Real-time Market Data help identify trading set-ups in real-time and express my market views. If you have futures in your trading portfolio, you can check out on CME Group data plans available that suit your trading needs www.tradingview.com
Trading the Micro: www.cmegroup.com

Nifty 50 technical analysis of the day Chart Observation:
Price recently swept Buy-side Liquidity (BSL) near 24,320–24,350 zone.
After the liquidity grab, a sharp rejection confirms institutional sell-side activity.
Market structure is turning bearish as price breaks below minor support near 24,250.
Key SMC Levels:
BSL zone (Trap Zone): 24,320–24,350 (Liquidity grab completed)
Break of Structure (BoS): Below 24,250 confirms bearish bias.
Next Target - Sell-side Liquidity (SSL): 24,100 then 23,950–23,900 zone.
Fair Value Gap (FVG): 24,270–24,300 (can be retested as resistance)
---
Trade Setup:
Entry: On pullback to 24,270–24,300 (FVG / bearish OB zone)
Stop Loss: Above 24,360 (above liquidity sweep)
Target 1: 24,100 (nearest SSL)
Target 2: 23,950–23,900 (deeper SSL zone)
---
SMC Logic: After sweeping liquidity from buy-side traders, Smart Money is likely shifting to the sell-side to trap late buyers. The impulsive bearish candle confirms order flow shift.
Bias: Bearish
Strategy: Sell the pullback into premium zone

EUR_CAD BEARISH BREAKOUT|SHORT|
✅EUR_CAD made a bearish
Breakout of the support
Cluster of the rising and
Horizontal support lines
Around 1.5672 and the
Breakout is confirmed so
We are bearish biased and
We will be expecting a
Further bearish move down
SHORT🔥
✅Like and subscribe to never miss a new idea!✅
Disclosure: I am part of Trade Nation's Influencer program and receive a monthly fee for using their TradingView charts in my analysis.

Trade Idea: ASX:ALL (Aristocrat Leisure)ALL has just bounced off its 50-day moving average, showing early signs of a potential uptrend continuation. Momentum is building, backed by strong fundamentals and solid sector positioning.
🎯 Why we like it:
• Holding firm above 50MA — a key level respected in past rallies
• Business quality remains high with strong balance sheet and earnings history
• Gaming sector strength could provide tailwind into May
📉 Stop: 62.84 — tight enough to manage risk if the breakout fails
⚠️ Note: Earnings due May 15 — position size accordingly and manage risk into event
This is a technical momentum play with fundamental support — good spot for partial exposure to see if the move has legs.
DISCLAIMER : The content and materials featured are for your information and education only and are not attended to address your particular personal requirements. The information does not constitute financial advice or recommendation and should not be considered as such. Risk Management is Your Shield! Always prioritise risk management. It’s your best defence against losses.

NVDA Day Trade Plan for 04/29/2025NVDA Day Trade Plan for 04/29/2025
📈 111.90 109.90
📉 105.90 103.90
Thanks to all my followers! Truly appreciate the support!
Please like and share for more ES/NQ levels Tues & Thurs 🤓📈📉🎯💰
*These levels are derived from comprehensive backtesting and research and a quantitative system demonstrating high accuracy. This statistical foundation suggests that price movements are likely to exceed initial estimates.*

TQQQ Day Trade Plan for 04/29/2025TQQQ Day Trade Plan for 04/29/2025
📈 55.10 55.60
📉 52.10 51.60
Thanks to all my followers! Truly appreciate the support!
Please like and share for more ES/NQ levels Tues & Thurs 🤓📈📉🎯💰
*These levels are derived from comprehensive backtesting and research and a quantitative system demonstrating high accuracy. This statistical foundation suggests that price movements are likely to exceed initial estimates.*

TSLA Day Trade Plan for 04/29/2025TSLA Day Trade Plan for 04/29/2025
📈 299 305
📉 274.50 268.50
Thanks to all my followers! Truly appreciate the support!
Please like and share for more ES/NQ levels Tues & Thurs 🤓📈📉🎯💰
*These levels are derived from comprehensive backtesting and research and a quantitative system demonstrating high accuracy. This statistical foundation suggests that price movements are likely to exceed initial estimates.*

SPY Day Trade Plan for 05/01/2025SPY Day Trade Plan for 05/01/2025
📈 562.70 565.60
📉 557 554.30
Thanks to all my followers! Truly appreciate the support!
Please like and share for more ES/NQ levels Tues & Thurs 🤓📈📉🎯💰
*These levels are derived from comprehensive backtesting and research and a quantitative system demonstrating high accuracy. This statistical foundation suggests that price movements are likely to exceed initial estimates.*

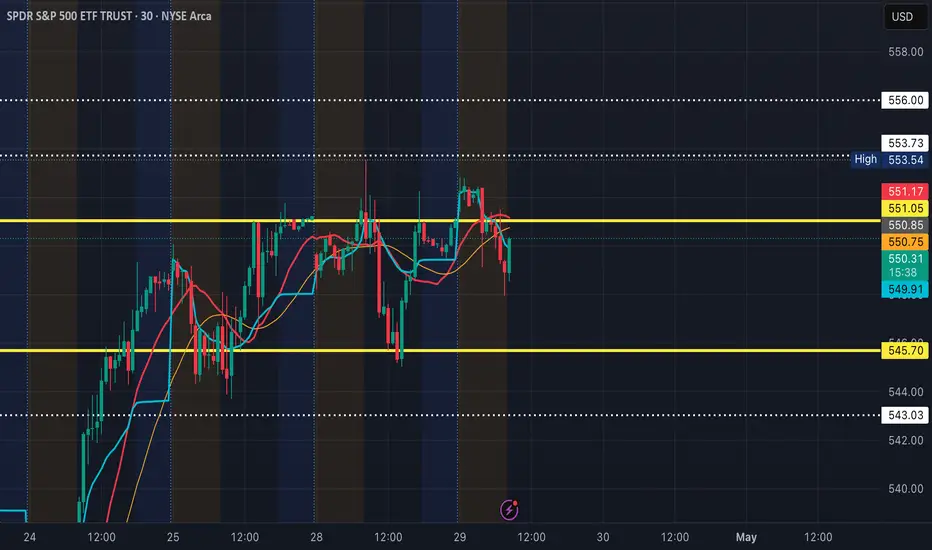
SPY Day Trade Plan for 04/29/2025SPY Day Trade Plan for 04/29/2025
📈 550 553 556
📉 544 543 540.50
Thanks to all my followers! Truly appreciate the support!
Please like and share for more ES/NQ levels Tues & Thurs 🤓📈📉🎯💰
*These levels are derived from comprehensive backtesting and research and a quantitative system demonstrating high accuracy. This statistical foundation suggests that price movements are likely to exceed initial estimates.*
MNQ1!/NQ1! Day Trade Plan for 05/01/2025MNQ1!/NQ1! Day Trade Plan for 05/01/2025
📈 20130 20219
📉 19770 19700
Thanks to all my followers! Truly appreciate the support!
Please like and share for more ES/NQ levels Tues & Thurs 🤓📈📉🎯💰
*These levels are derived from comprehensive backtesting and research and a quantitative system demonstrating high accuracy. This statistical foundation suggests that price movements are likely to exceed initial estimates.*

MNQ1!/NQ1! Day Trade Plan for 04/29/2025MNQ1!/NQ1! Day Trade Plan for 04/29/2025
📈 19560 19685
📉 19185 19060
Thanks to all my followers! Truly appreciate the support!
Please like and share for more ES/NQ levels Tues & Thurs 🤓📈📉🎯💰
*These levels are derived from comprehensive backtesting and research and a quantitative system demonstrating high accuracy. This statistical foundation suggests that price movements are likely to exceed initial estimates.*

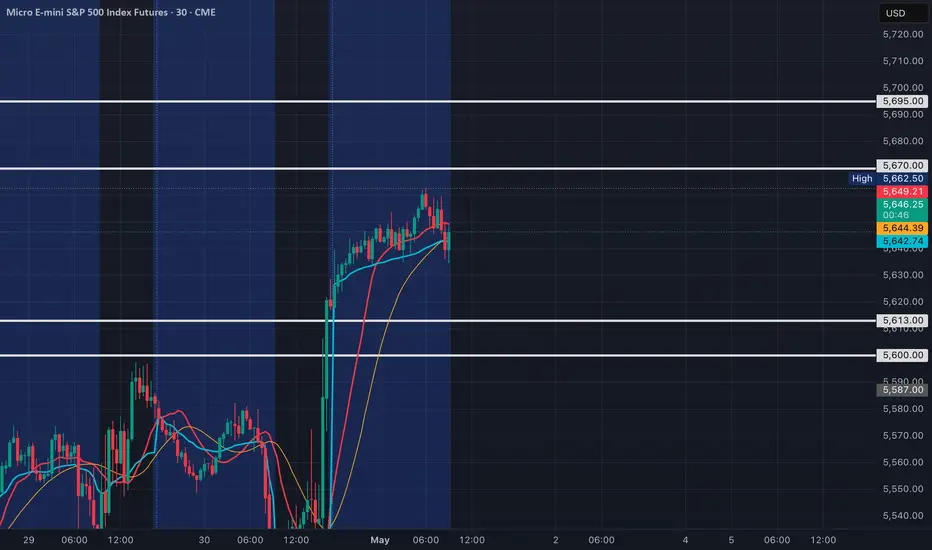
MES1!/ES1! Day Trade Plan for 05/01/2025MES1!/ES1! Day Trade Plan for 05/01/2025
📈 5670 5695
📉 5613 5600
Thanks to all my followers! Truly appreciate the support!
Please like and share for more ES/NQ levels Tues & Thurs 🤓📈📉🎯💰
*These levels are derived from comprehensive backtesting and research and a quantitative system demonstrating high accuracy. This statistical foundation suggests that price movements are likely to exceed initial estimates.*
MES!/ES1! Day Trade Plan for 04/29/2025MES!/ES1! Day Trade Plan for 04/29/2025
📈 5555 5580
📉 5500 5475
Thanks to all my followers! Truly appreciate the support!
Please like and share for more ES/NQ levels Tues & Thurs 🤓📈📉🎯💰
*These levels are derived from comprehensive backtesting and research and a quantitative system demonstrating high accuracy. This statistical foundation suggests that price movements are likely to exceed initial estimates.*
