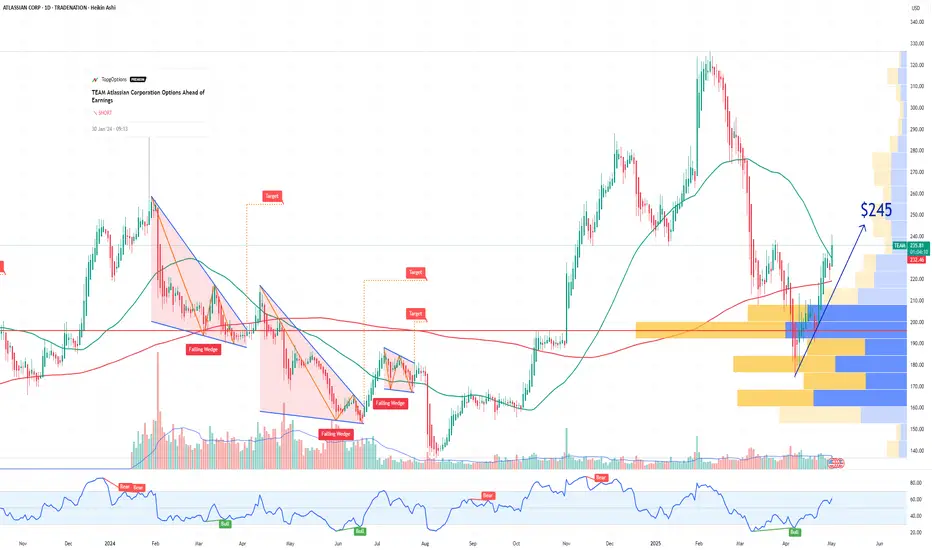
TEAM Atlassian Corporation Options Ahead of EarningsIf you haven`t sold TEAM on this top:
Now analyzing the options chain and the chart patterns of TEAM Atlassian Corporation prior to the earnings report this week,
I would consider purchasing the 245usd strike price Calls with
an expiration date of 2025-5-2,
for a premium of approximately $8.70.
If these options prove to be profitable prior to the earnings release, I would sell at least half of them.
Disclosure: I am part of Trade Nation's Influencer program and receive a monthly fee for using their TradingView charts in my analysis.
Beyond Technical Analysis
WOWDue to another delay in airdrops and feedback from the community, it seems all these reviews have led to coinbase planning to delist. Within 2 minutes! It dropped about 20%. This is a sale of approximately $1.3 million worth of tokens.
This is the definition of rug pulling compliments of your local Centralised exchange.
It is looking like the end for Movement Labz, unless the network can provide some much needed utility and a miracle.
Market sentiment moves markets, and yours is not great!
Target... $1 000 000 000! LMAO 🤣
Will be happy with £1 or any green going forward.
@Dyl_uk

RIOT Platforms Options Ahead of EarningsIf you haven`t bought RIOT before the previous earnings:
Now analyzing the options chain and the chart patterns of RIOT Platforms to the earnings report this week,
I would consider purchasing the 12usd strike price Calls with
an expiration date of 2026-3-20,
for a premium of approximately $1.35.
If these options prove to be profitable prior to the earnings release, I would sell at least half of them.
Disclosure: I am part of Trade Nation's Influencer program and receive a monthly fee for using their TradingView charts in my analysis.

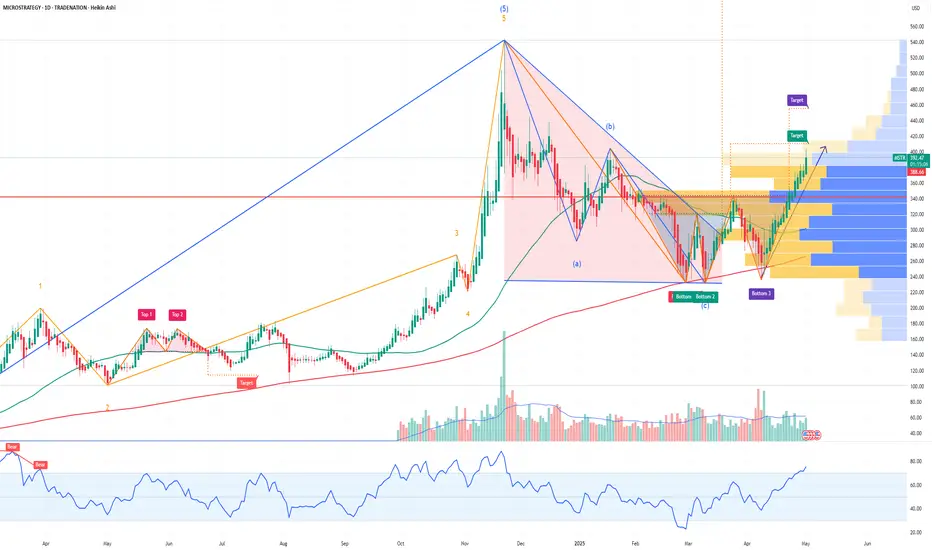
MSTR Strategy Incorporated Options Ahead of EarningsAnalyzing the options chain and the chart patterns of MSTR Strategy Incorporated prior to the earnings report this week,
I would consider purchasing the 390usd strike price Calls with
an expiration date of 2025-9-19,
for a premium of approximately $81.30.
If these options prove to be profitable prior to the earnings release, I would sell at least half of them.
Disclosure: I am part of Trade Nation's Influencer program and receive a monthly fee for using their TradingView charts in my analysis.
Forming Potential Cup and Handle Pattern🚨 $HIFI
Forming Potential Cup and Handle Pattern 🚨
$HIFI
is forming a potential cup and handle pattern. For this bullish pattern to be confirmed, the price needs to break out above the red resistance zone.
📈 Technical Overview:
Pattern: Potential Cup and Handle
Resistance Zone: Red area currently being tested.

ABNB Airbnb Options Ahead of EarningsIf you haven`t sold ABNB before the retracement:
Now analyzing the options chain and the chart patterns of ABNB Airbnb prior to the earnings report this week,
I would consider purchasing the 105usd strike price Puts with
an expiration date of 2026-1-16,
for a premium of approximately $8.10.
If these options prove to be profitable prior to the earnings release, I would sell at least half of them.
Disclosure: I am part of Trade Nation's Influencer program and receive a monthly fee for using their TradingView charts in my analysis.

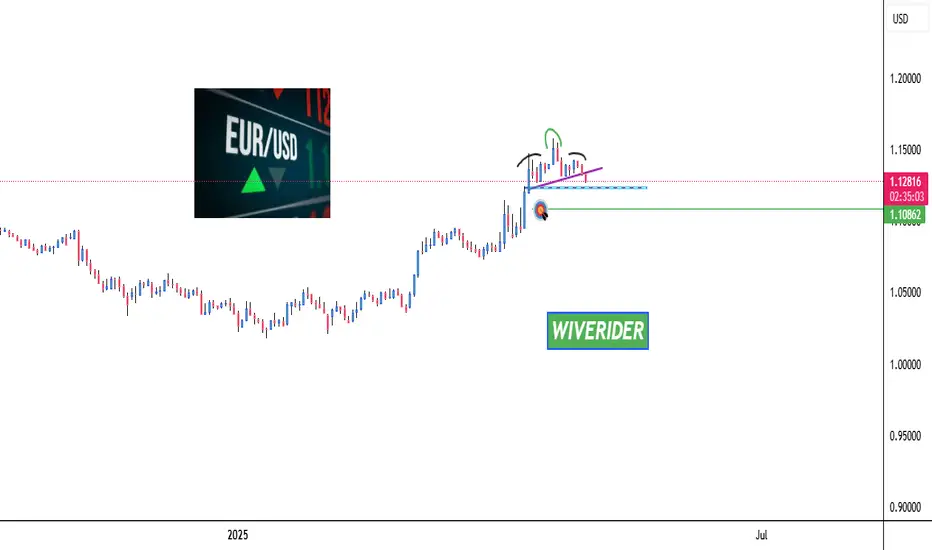
EUR/USD – Technical Outlook & Strategic Projection (May 1–17)
📉 EUR/USD – Technical Outlook & Strategic Projection (May 1–17)**
Since **April 20th**, the euro has shown a consistent decline in strength against the US dollar, reflecting a sustained bearish sentiment. However, the current market structure suggests a potential **short-term bullish retracement** in the coming days — possibly lasting through the end of this week.
This short-lived upside move is likely driven by the market's need to **seek liquidity above recent highs**, particularly near the **Previous Weekly High (PWH)** and the nearby imbalance zone (FVG). From my perspective, this setup may act as a **liquidity sweep** before resuming the broader bearish trend.
📌 **My Outlook:**
- A temporary euro recovery may occur as price revisits the 1.14500–1.15688 zone.
- Around **May 6th onwards**, I expect bearish continuation as liquidity objectives are fulfilled.
- If price confirms rejection from the premium zone, my bearish bias targets the **1.09076** and eventually **1.04172** levels.
🔍 *Conclusion:*
While the euro may show short-term strength, this is likely a setup to trap buyers before a deeper decline. I will be monitoring for confirmations of rejection and signs of trend continuation beyond the liquidity grab.
📍Posted by: *Emerson Massawe*
*Data & Market Analyst | COO of Rodaviva | Xerof Capital*

AMZN Amazon Options Ahead of EarningsIf you haven`t bought AMZN before the previous rally:
Now analyzing the options chain and the chart patterns of AMZN Amazon prior to the earnings report this week,
I would consider purchasing the 210usd strike price Calls with
an expiration date of 2025-6-20,
for a premium of approximately $3.75.
If these options prove to be profitable prior to the earnings release, I would sell at least half of them.
Disclosure: I am part of Trade Nation's Influencer program and receive a monthly fee for using their TradingView charts in my analysis.

How to Place Different Types of Futures Orders on TradingViewThis tutorial video walks you through how to place basic futures orders on tradingview including market, limit, and stop orders.
We also discuss bracket orders, modifying orders, and cancelling orders, as well time of order effect.
There is a substantial risk of loss in futures trading. Past performance is not indicative of future results. Please trade only with risk capital.

NAVX has formed a cup and handle pattern NAVX has formed a cup and handle pattern and is now waiting for a breakout above the red resistance zone. If the price successfully breaks out, the target will be the green line level.
📈 Technical Overview:
Pattern: Cup and Handle
Resistance Zone: Red area currently being tested.
🎯 Breakout Target: Green line level upon confirmation.

head and shoulders pattern EURUSD has formed a head and shoulders pattern and is now approaching the blue support zone. If the price breaks below this support level, it could signal a bearish move with the target set at the green line level.
📈 Technical Overview:
Pattern: Head and Shoulders
Support Zone: Blue area currently being approached.
🎯 Breakdown Target: Green line level upon confirmation of the breakdown
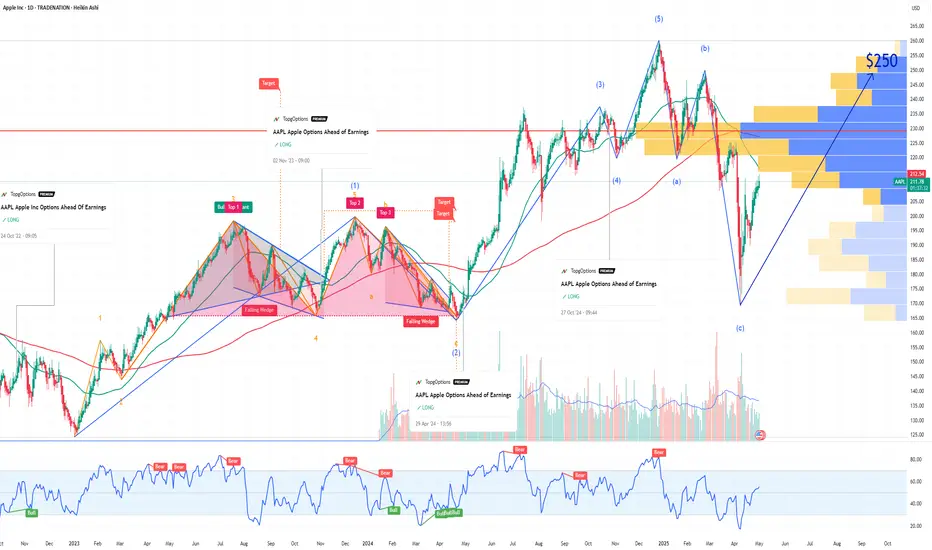
AAPL Apple Options Ahead of EarningsIf you haven`t bought AAPL before the previous rally:
Now analyzing the options chain and the chart patterns of AAPL Apple prior to the earnings report this week,
I would consider purchasing the 255usd strike price Calls with
an expiration date of 2026-1-16,
for a premium of approximately $7.30.
If these options prove to be profitable prior to the earnings release, I would sell at least half of them.
Disclosure: I am part of Trade Nation's Influencer program and receive a monthly fee for using their TradingView charts in my analysis.
MARKETS NOT OVERSOLD CAUTION! UPDATE!This is a monthly chart and TV keeps forcing "Target reached" on my updates. As such i am reposting this chart I first issued back on April 1st, 2025, before our "LIBERATION DAY" FACEPALM!
We are still not oversold on a monthly chart!
WARNING!
Click Boost, follow, subscribe!

USOIL CAUTION! BREAK - TEST - GO!This is my new updated chart of Oil.
Trump's "Drill baby Drill" interfering with the free market is the absolute worst thing he could do. His ridiculous tariffs will put us in an economic depression!
Oil prices are driven by demand! As I have mentioned here on TV so many times before! Increasing supply while heading into a recession is the dumbest thing possible! You never want to consume your own oil when you can consume others first! Simultaneously, F your own nation's oil company's profit margins and gov tax revenue!
This is why we shouldn't put toddlers as POTUS!
Anyway!!! This is a break test go! setup!
If you haven't seen it before, here is an example I recently posted with AAPL.
Click Boost, follow, subscribe! Let's get to 5,000 followers so I can help them navigate these crazy markets too. ))

QQQ Don't Get Honey Dicked!These moves are designed to provoke emotions. Don't get fooled! Nothing has changed! Tariffs are not the problem; they are only a symptom of it.
Click BOOST, Follow, Subscribe!
Let me help you navigate these crazy markets.

JET FUEL & RecessionJet fuel has already pulled back significantly, which would normally be good for airlines. Not this time. Jet fuel pulling back with airlines signals a recession is on the horizon.
Keep an eye on this one.
Click boost, follow, and subscribe for more!

OPUSDT Long | Imbalance + Fib Zone ReactionOPUSDT Long | Imbalance + Fib Zone Reaction
BINANCE:OPUSDT Price tapped into the 0.705–0.716 demand zone with strong confluence:
🔹 Imbalance fill
🔹 0.618–0.79 Fib zone
🔹 Consolidation above support
Entry: 0.734
SL: 0.674
TP1: 0.854
TP2: 0.915
Clean structure. Holding as long as 0.674 holds.
#OPUSDT #Altcoins #LongSetup #CryptoTrading #Fibonacci #PriceAction

Gold Eiffel Tower The GOLD GTFO is still in play.
What saved Gold was the stopping for the market crash when Trumnpchenko manipulated the markets. Had the crash continued Gold would have crashed with it. As it is the last safe haven for money to pile into and people just give up and sell everything in sight.
If you were an early buyer of gold and sold above $3,000 then you have a nice 50% gain.
Take your money and RUN! All the way to the bank! Don't be a dick for a tick. If you are then you will ride it all the way back down.
When will it top no one can know. But what pros do is take their money and RUN! So be a pro! ;)
Click like follow subscribe!

XAU/USD BUY - FOOTPRINT EXTREME BUYING IMBALANCE Trade Sequence:
1. Wait for price to take out the low highlighted
2. Once the low has been taken out look for a 15minute timeframe divergence between the candlestick chart and the CVD (should be a bullish divergence with the CVD going upwards)
3. Once the divergence has occured look for an entry on from a 1 minute shift in market structure.
SL = Below the low of that day.
TP = Indicated by the buy box

This is a 4H chart of XAU/USD with multiple SMC annotations. 1. Chart Analysis Using Smart Money Concepts (SMC)
SMC Structure Identified:
• Major Break of Structure (BoS): Occurred above 3,240 → confirmed bullish intent.
• Major Change of Character (CHoCH): Happened around 3,320 (last demand broken), indicating bearish shift.
• FVG (Fair Value Gap): Marked just below the last day high — partially filled and then rejected.
• Liquidity: Equal highs and lows around 3,327 and 3,200 respectively — potential liquidity targets.
⸻
2. Marked Points in Chart
• Last Day High / Low and Day High / Low are marked.
• 50% Day Range at approx. 3,274 — currently acting as intraday resistance.
• OB Zone around 3,214–3,218 (a critical support zone that may act as re-entry or rejection point).
• FVG Zone near 3,284 — unmitigated imbalance that price could revisit.
⸻
3. Swing High & Low of the Day
• Swing High: ~3,327.72 (day/session high).
• Swing Low: ~3,214.31 (day/session low).
• These define the current internal liquidity pool.
⸻
4. Trade Direction
• 4H Trend: Bearish, post CHoCH and major OB break.
• Bias: Bearish, as price is below FVG and below 50% of the daily range. OB is being respected and lower highs are forming.
• Intra-Day Opportunity: Possible short setups unless price closes strongly above 3,284–3,287 zone.
⸻
5. Best Risk-Reward Setup (Swing/Intraday)
Scenario: Price retests FVG/OB at 3,284–3,287 and rejects.
• Entry: 3,284.00 (inside FVG)
• SL: 3,288.50 (above supply zone & equal highs)
• TP1: 3,214.00 (last day low)
• TP2: 3,200.00 (liquidity sweep & OB retest zone)
• RRR:
• To TP1: ~1:3
• To TP2: ~1:4.5
⸻
6. Trade Setups by Timeframe
5-Minute Setup:
• Look for CHoCH near 3,284.00 zone.
• Entry: On bearish engulfing or internal BOS.
• SL: Above 3,288.00.
• TP: 3,214.00 (previous low).
1-Hour Setup:
• Wait for 1H candle rejection at FVG or last day’s high.
• Entry: 3,284–3,287.
• SL: 3,290.
• TP1: 3,214.00.
• TP2: 3,200.00.
4-Hour Setup:
• Use higher timeframe OB for re-entry.
• Look for price closing below 3,214.00 → opens short continuation toward 3,160 or deeper (OB at 3,100).
• Swing Trade Setup: Short from 3,284.00 → SL 3,290 → TP 3,100–3,080 (RRR: ~1:6).
⸻
7. CRT Model Evaluation
• C – Context: HTF structure shifted bearish after CHoCH; price rejected FVG and supply zones.
* R – Retracement: Price retraced into OB and FVG in premium, providing a sell opportunity.
• T – Trend Continuation: If 3,214 breaks cleanly, expect continuation toward 3,160 and possibly 3,100.
⸻
Summary
• Bias: Bearish under 3,284–3,287 zone.
• Key Levels to Watch:
• Resistance: 3,284–3,287 (FVG + OB).
• Support: 3,214–3,200 (liquidity pool + OB).
• Best Trade: Short from FVG zone on confirmation with TP at day low and deeper OBs.

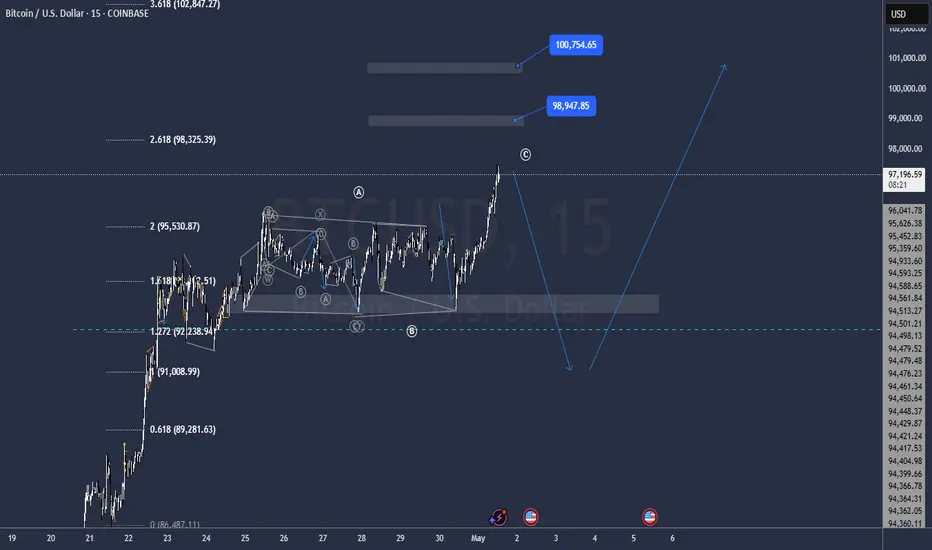
I might be Wrong in my previous ForecastBTC may be still in correction stage and one more fall is very possible, secure your buy poitioms
new buy zone is @ 92.000
1500 before AGM Reliance 2025 I feel superbolish on Reliance not since today but since it was at the 1250 level I feel that Reliance will show us 1500 and above levels not sure about the lifetime high but 1500 levels before AGM which is mostly held in July or August

XAUUSD , Long or Short The provided content appears to be a snapshot of a trading interface for **Gold Spot (XAU/USD)**. Here's a breakdown of key elements and their implications:
### 1. **Price Data**
- **Current Price**: 3,214.715 USD per ounce of gold.
- **Change**: -73.455 (-2.23%), indicating a significant drop in price over the observed period.
- **Bid/Ask Prices**:
- **SELL (Bid)**: 3,214.350 (price at which you can sell gold).
- **BUY (Ask)**: 3,215.050 (price at which you can buy gold).
### 2. **Price Levels**
- Listed prices (3,280.000 to 3,160.000) likely represent recent **support/resistance levels** or historical highs/lows. The cluster around 3,215–3,207 suggests a consolidation zone.
### 3. **Time Stamps**
- **13:32**, **06:00**, **12:00**, etc.: Likely mark key trading hours (e.g., London/New York sessions) or times of volatility.
### 4. **Key Terms**
- **XAUUSD 15m**: The Gold/USD pair analyzed on a **15-minute chart** (short-term trading view).
- **RTCUSD**: Possibly another asset (e.g., a commodity or currency pair) being tracked alongside gold.
- **DREW!**: Could be a custom alert (e.g., a trendline break or price target hit).
### 5. **Trading Context**
- The sharp decline (-2.23%) suggests bearish momentum. Traders might watch for:
- **Support at 3,200 or 3,160**: A break below could signal further downside.
- **Resistance near 3,215–3,231**: A rebound above could indicate a reversal.
### Actionable Insights:
- **Short-term traders**: Monitor the 15m chart for breakout/retest opportunities.
- **Risk Management**: Use stop-loss orders given the volatility.
- **"DREW!" Alert**: Investigate its trigger (e.g., technical pattern or news event).
Always cross-verify with broader market news (e.g., Fed policy, geopolitical events) to contextualize price movements.
