GBPJPY Trade Update: New Month, New Momentum?As we flip the calendar into a new month, our GBPJPY swing trade has shown solid progress—reaching 193.030, just over halfway to our final target at 195.170. Originally entered at 188.813, this move has delivered over 400 pips so far, validating the analysis behind the setup.
In this phase of the trade, it’s less about jumping to adjust and more about staying focused on trade management and letting the market reveal its next intention. Price is approaching a key zone of interest where momentum often stalls or accelerates, and we’re watching closely for signs of strength—or hesitation.
Key insights from this phase of the trade:
The power of planning your exit with as much precision as your entry.
How end-of-month and new-month flows can trigger volatility.
When to lock in partial profits and when to stay patient.
With strong bullish structure still intact, the GBPJPY pair is giving us every reason to stay in the trade, eyes on the 195.170 target.
Would you hold or secure the bag here? Let me know how you’d play it from this point forward.
📺 Full breakdown and next steps now in the video!
Beyond Technical Analysis

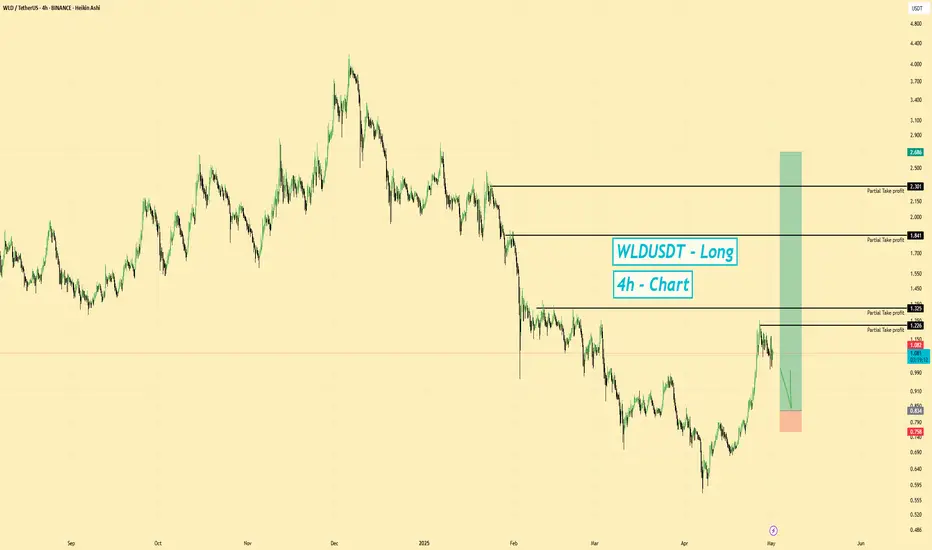
WLDUSD | Long Setup | Potential Correction | (May 2025)WLDUSD | Long Setup | Potential Correction After Downtrend | (May 2025)
1️⃣ Insight Summary
WLD has been showing some strength recently, following Bitcoin's bounce. Although the bigger trend has been bearish since December 2024, we're now seeing signs of a potential short-term correction upward.
2️⃣ Trade Parameters
Bias: Long
Entry Zone: $0.90 – $0.92835 (wait for a reclaim and retest as support)
Stop Loss: $0.765
TP1: $1.22
TP2: $1.32
TP3: $1.84
Final Target (Stretch Goal): $2.50
Partial Exits: TP1 and TP2 will be aggressive exits, while the rest of the position will be managed more passively.
3️⃣ Key Notes
✅ WLD is reacting to Bitcoin's recent strength, which could support this corrective move.
❌ However, the macro trend is still bearish, so it’s essential to wait for confirmation (reclaiming the entry zone as support).
📊 Keep an eye on BTC and broader market sentiment to gauge continuation potential.
4️⃣ Follow-up Note
Will review the setup and update if we break the current entry zone or reject before confirmation.
Please LIKE 👍, FOLLOW ✅, SHARE 🙌 and COMMENT ✍ if you enjoy this idea! Also share your ideas and charts in the comments section below! This is the best way to keep it relevant, support us, keep the content here free and allow the idea to reach as many people as possible.
Disclaimer: This is not financial advice. Always conduct your own research. This content may include enhancements made using AI.
USD/JPY... BUY!!! RETEST ON STRONG BUY AREA Shown multiple times in the past months this area show and still holds as support for USD/JPY.
BUY IN $145-$148. Target price $155-$160+ THIS IS A ALL MONTH HOLD OR UNTIL TARGET PRICE IS REACHED! FOLLOW ME FOR MORE THX AND ENJOY.

CADJPY RALLIED IN THE WAKE OF STEADY RATE BY BOJEarlier today, May 1st, The Bank of Japan (BoJ) maintained its interest rates at 0.5%, with a dovish outlook, including trimmed growth and inflation forecasts.
This stance suggests a lower likelihood of near-term rate hikes, this priced in a weaker Yen and hence the Yen lagged across board.
The Canadian Dollar on the other hand being strengthened by the recent rebounds in oil prices took advantage of that, hence the surge in CADJPY.
TECHNICAL VIEW
From technical perspective, prices were supported at 104.35 after it broke out of a major psychological barrier level of 104. Price rallied to the strong supply zone of 105 and currently hovering around 105.06.
From technical lenses, the oscillators: RSI and Stochastic are over stretched hinting signs of possible pullback as they have gone above over bought levels and created bearish divergence: price is forming Higher High and both indicators are possibly forming Lower High simultaneously.
Other things being equal, analysts likely predict price to drop with potential target around 104.35 and if that is taken out, the next potential targets would be 104 and 103. On the other hand, if the bullish momentum is sustained, a break above 105.39 would usher in 106 psychological level. Breakouts of these levels are not ruled out as per analysts.

Nasdaq-100 Goes Back to 'PRE-PAIN' 20 000 Level. Series IIApril has gone..
Wow.. Duh..!? ..really? ... or still not!?
Briefly a month ago or so, we have examined at our wonderful @PandorraResearch Team what is 'Revenge Trading', watch our recent 'Educational' idea right here (if you missed one), to learn what sort of lessons we should know about it.
Indeed, it was a really bad story, to purchase in late March 2025 most-hyped so-known Mag Seven stock that came flagships of the recent stock market collapse.
First of all, watch how it's been below (late March 2025) 👇👇
What's happened next just in a week or two since our publications has been made?
⚒ Russell 2000 Index TVC:RUT 95% stocks were: DOWN
⚒ S&P500 Index SP:SPX 96% stocks were: DOWN
⚒ Nasdaq-100 NASDAQ:NDX as well as Dow Jones Industrial Averages DJIA indices: 97% stocks were DOWN
⚒ Magnificent Seven: ALL STOCKS WERE DOWN
Since Nasdaq-100 went back to pre-pain 20'000 Level, lets repeat some lessons.
Revenge trading is DANGEROUS AND HARMFUL pracrice where traders, after suffering a loss, attempt to immediately recoup their losses by making impulsive, emotionally-driven trades. This behavior is widely recognized as one of the major reasons traders lose significant amounts of money and often blow up their accounts.
Why Revenge Trading Is Bad
1. Emotional Decision-Making Replaces Strategy
When traders engage in revenge trading, they abandon their carefully crafted trading strategies and risk management rules. Instead, trades are made based on anger, frustration, or the desire to "get back" at the market. This emotional state clouds judgment, leading to irrational decisions such as increasing position sizes recklessly, disregarding stop-loss orders, or chasing trades without proper analysis. As a result, the likelihood of making successful trades plummets.
2. Escalating Losses and Account Blowups
The urge to recover losses quickly often leads traders to double down or over-leverage their positions, exposing a large portion of their capital to additional risk. Statistically, 80% of revenge trading ends disastrously, with only a small fraction experiencing temporary success before ultimately facing larger losses. This cycle of chasing losses can rapidly erode trading capital, making recovery increasingly difficult.
3. Psychological Burnout and Stress
Revenge trading is mentally and emotionally exhausting. The constant cycle of loss and frantic attempts to recover can lead to stress, depression, and burnout. This further impairs decision-making, creating a vicious cycle of poor performance and deteriorating mental health.
4. Long-Term Damage to Trading Habits
Repeatedly succumbing to revenge trading ingrains bad habits, making it difficult for traders to maintain discipline and consistency in the long run. This lack of consistency undermines the potential for sustainable profitability and can end trading careers prematurely.
Recent Real-World Examples
Recent years have seen numerous cautionary tales illustrating the dangers of revenge trading (all links are from r/wallstreetbets subreddit for learing/ educational purposes only):
$40,000 Lost on NVDA Options (2024). A trader repeatedly doubled down on Nvidia (NVDA) put options during its price rally in mid-2024. Despite initial small wins, the trader, driven by the urge to recover losses, continued to increase his position size, ultimately losing over $40,000.
$26,000 Lost in 20 Minutes on SPX. A Reddit user reported losing $26,000 in about 20 minutes trading the S&P 500 index (SPX) after prices dropped sharply. The loss was the result of impulsive trades made in an attempt to quickly recover from earlier setbacks.
From $27,000 to $0 in Three Days. Another trader turned $500 into $27,000 in just a few days, only to lose it all within 48 hours after a market reversal. Instead of taking profits or stepping back, the trader kept chasing losses with increasingly risky trades, ending up with nothing.
$100,000 Loss on a Yen Carry Trade. A trader, influenced by news of geopolitical tensions, made a large leveraged bet on the yen. After an initial loss, he refused to cut his losses and doubled down, ultimately losing $100,000 instead of accepting a smaller $30,000 hit.
More juicy stories are to be collected...
These stories are not isolated incidents. They are echoed across trading forums and social media, serving as stark warnings of how quickly revenge trading can destroy even substantial gains.
Conclusion
Revenge trading is DANGEROUS AND HARMFUL because it replaces rational, strategic decision-making with emotional reactions, leading to escalating financial losses, psychological distress, and long-term damage to trading discipline. The real-world examples from the past year underscore that no trader-regardless of experience-is immune to its risks. The best defense is to recognize the urge, step away, and return only with a clear, objective mindset and a disciplined strategy.
--
Best wishes,
@PandorraResearch Team 😎

US30: Time to Reverse or Push Higher?Hey Traders,
As you can see on the chart, price tapped into a major level around the $37,000 area, where we saw a weekly liquidity grab followed by a 4H change of character — leading to a strong push up to the $40,800 zone.
Now, we’re looking at two possible scenarios:
📌 Scenario 1:
Price pulls back to the $39,100 area and gives a solid 4H confirmation → Targeting the $41,000 zone.
📌 Scenario 2:
Price breaks below the $39,100 area and the trendline, then pulls back into the same level with confirmation → Targeting the $37,000 / $36,000 area.
⚠️ This is not financial advice — just sharing my view on the current setup.
Be safe, be happy, and have a great trading day.
– Mr. Wolf 🐺

Crypto psychology ep4 : Why You Want to Make Money from Crypto ?Crypto isn’t just a market — it’s a dream factory. Every day, millions of people throw their money (and hopes) into the blockchain, all chasing the same thing: " financial freedom ". But why are people so drawn to making money from crypto? Let’s unpack it.
The Dream of Easy Money
Let’s be real: who doesn’t want to make money without breaking their back? Crypto promises that fantasy — you buy a coin, wait, and (hopefully) watch it explode in value. Unlike traditional jobs or businesses, it feels like you can skip the grind. That hope of less effort, more reward keeps pulling people in, even if the reality is much harsher.
Chasing the Jackpot Coin
Everyone’s looking for the next Bitcoin, the next 100x gem that could turn a few hundred bucks into millions. That “ lottery ticket ” mentality fuels the hunt for low-cap coins, meme tokens, or risky projects. It’s not just about profits — it’s about finding that one life-changing win that could rewrite their story forever.
The Escape from the 9-to-5 Job
For many, crypto isn’t just a side hustle — it’s a possible escape route. The idea of quitting that soul-crushing office job , saying goodbye to bosses and deadlines, and living on your own terms? Crypto makes it feel achievable. Even if it’s a long shot, it’s a shot people are willing to take to avoid spending decades in the rat race.
Important : Revenge on the Market
Since the brutal crashes of 2022 , a lot of traders have been left deep in the red. But instead of walking away, many are chasing the market harder than ever. It’s not just about making money anymore — it’s about getting back what they lost, proving they were right, and maybe even outsmarting the system that beat them before. That hunger for revenge can keep people in the game way longer than logic says they should stay.
Crypto isn't just numbers on a screen — it’s a cocktail of hope, desperation, and ambition. And that’s why, no matter how risky it gets, people keep coming back.
BINANCE:BTCUSDT BINANCE:DOGEUSDT BINANCE:XRPUSDT BINANCE:ADAUSDT

GBPJPY LONG SETUP UPDATE: FULL TAKE-PROFIT ARCHIVED Excellent execution! Our 1:2 full take-profit target has been reached. Well done! Enjoy the profits and let's look forward to the next trading opportunity.

XAUUSDHello Traders! 👋
What are your thoughts on Gold?
After a strong upward move, gold entered a corrective phase upon reaching the $3500 resistance zone.
The current pullback is expected to extend toward the identified support area and the ascending trendline, where buying interest may reappear.
As long as gold holds above the support and trendline, the long-term trend remains bullish.
This correction could offer a buy-the-dip opportunity, with potential for a move back toward the recent highs.
Will gold find support and resume its rally? Share your thoughts below!
Don’t forget to like and share your thoughts in the comments! ❤️

XAUUSD Take ProfitThe gold trade I shared a few hours ago has hit Take Profit at the RRR 1:2 level. This was the second TP level.
For those who wish, you can hold the trade until the TP level at 3206.35.
If the price approaches this level, don’t forget to move your SL to the entry point.
Wishing everyone a pleasant end to the day.
🔔 I post detailed trade ideas and daily market analysis like this every day on my TradingView profile.
👉 Follow me to get notified and read the full breakdowns.

XAUUSD SellThere is a good zone for a sell trade on XAUUSD. This is one of our favorite types of setups—small loss zone and wide TP area, making it an ideal trade. You can activate the trade at the 3229.91 level.
The TP target will be 3208.20 and the SL level will be 3234.71.
🔔 I post detailed trade ideas and daily market analysis like this every day on my TradingView profile.
👉 Follow me to get notified and read the full breakdowns.

Natural Gas (Henry Hub) – Intraday Outlook | May 1, 2025The previous idea played out well — price hit the first long target cleanly and came just short of the second target, which was 3.4501
📍 Current outlook:
I've updated the ascending channel based on the new pivot points.
If we see a strong buy reaction from the 3.3575 level, I’ll expect to complete the move to 3.4501, and the next goal will be the upper boundary of the channel.
However, if price closes below 3.3585, we may be seeing the beginning of a range formation, with downside potential toward the 3.2556 support zone.
#TechnicalAnalysis #DayTrading #VSA #NG #HenryHub #NaturalGas #FuturesTrading #VolumeSpreadAnalysis

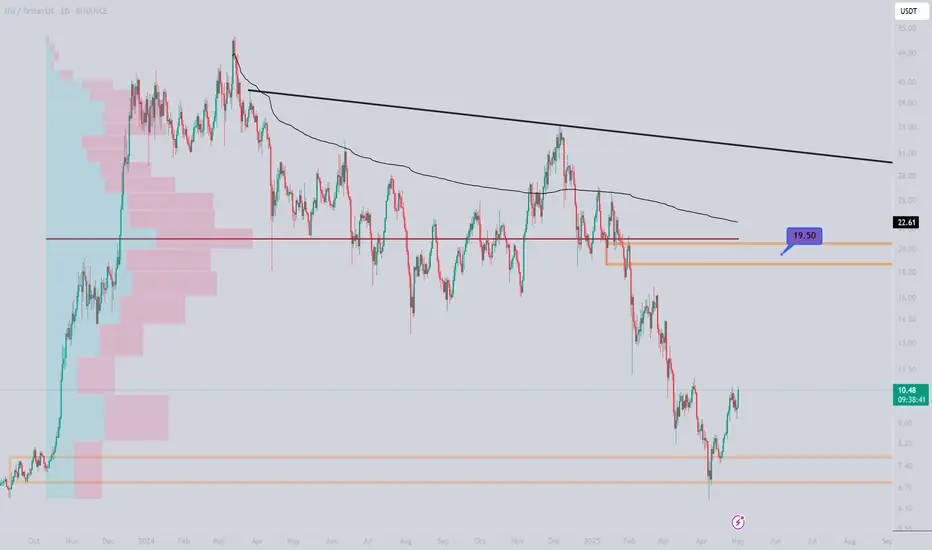
INJUSDTConsidering the monthly candle close
and the important breakeven and montomai range that it has taken
I expect growth to reach the 19 range in the first price step
XAUUSD DAILY PLAN & MARKET UPDATE — APRIL 30, 2025Not predictions. Structure. Logic. Execution.
📍 What Happened:
🔻 3315–3325 SELL → Perfect rejection → Drop of 200+ pips
🔁 Retest at 3314 → Confirmed OB rejection zone
❌ 3284–3288 BUY → Invalidated, BOS clean
✅ 3260–3270 BUY → Real reaction zone. OB + FVG + full discount → Delivered bounce
👁🗨 Eyes On (Into NY Session & May 1):
3315–3325 = Decision zone
→ Break = bullish reversal
→ Rejection = new short trigger
3260–3270 = Key support. If holds = bounce continuation
3252–3244 = Next strong buy zone if 3260 fails
3350 / 3385 = Targets only if bullish breakout occurs post-news
🧠 Current Bias:
🔸 HTF Trend: Consolidation under ATH → bearish-leaning
🔹 LTF Flow: Bearish structure unless 3315 flips
🎯 Bias: Neutral-bearish → shifting bullish only above 3325
📊 KEY LEVELS TO WATCH:
Zone Type Level(s) Commentary
🔻 Resistance 3385 HTF FVG zone / reversal risk
🔻 Resistance 3350 Clean target above breakout
🔻 Resistance 3325 Final barrier before shift
🔻 Flip Zone 3315–3320 Must flip to validate bulls
🔁 Retest 3308–3312 Last OB rejection
⚖️ Mid Zone 3286–3292 Retest structure, weak
✅ Support 3260–3270 Confirmed bounce zone
🟩 Demand 3252–3244 Next high-conviction buy zone
🟢 Discount 3220–3235 Long-term OB zone
🟢 Discount 3192–3205 Extreme discount + FVG
🗓️ MACRO FOR MAY 1:
🗣️ 15:30 Trump Speech
📉 15:30 Unemployment Claims (forecast: 224K)
🏭 15:45 Final Manufacturing PMI
🏭 17:00 ISM Manufacturing PMI + Prices
⚠️ Expect high volatility. Prepare for breakout setups only after structure confirms — not before.
🎯 Final Note:
If 3315–3325 breaks cleanly → we’re heading to 3350 / 3385.
If it holds → we hunt reentry shorts with sniper precision.
This is not a place to guess. It’s where real traders wait.
—
📌 Like plans built on logic, not luck?
Drop a 🧠 if this structure helped you.
🔥 Follow if you're done with signal-chasing and ready to trade like a sniper.

AUDNZD long time berish,- time for changes?
OANDA:AUDNZD we are have fall last 2 months, price is break DESCENDING CHANNEL, based on technicals here expectations are strong bullish.
SUP zone: 1.07300
RES zone: 1.09200, 1.09700

(XAU/USD) Based on key areas where price has reacted beforeThis is a 1-hour chart of Gold (XAU/USD) showing a clear market structure. Price has been falling and is now approaching a strong support zone where it has previously reversed. This area could attract buying interest again, offering a potential upward move. A short-term reaction zone is marked above as the first target, while a higher reaction zone is shown for long-term potential. The chart includes a well-structured setup with a favorable risk-to-reward ratio, showing clear entry, target, and exit levels. Traders should watch for confirmation before reacting.

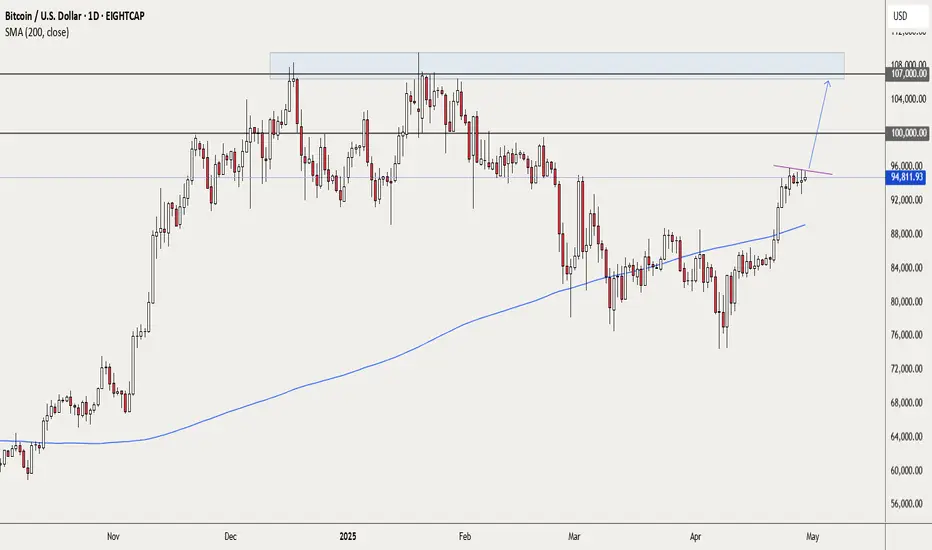
BTCUSD - best to wait a bit for a possible breakoutIf you are not already long on BTC, I would suggest exercising some patience. As my trendline indicates, we have had a few recent attempts to break higher. We have no idea if we will get that breakout or will price decline again. My approach would be to wait for a daily candle that closes above the trendline.
If that happens, I would place a pending long trade above the high of that breakout candle, stop placement below the recent swing low and 1st target at the round number 100,000.
Depending on the price action, a second target around 107,000 also looks possible.
This is not a trade recommendation; it’s merely my own analysis. Trading carries a high level of risk, so only trade with money you can afford to lose and carefully manage your capital and risk. If you like my idea, please give a “boost” and follow me to get even more. Please comment and share your thoughts too!!
It’s not whether you are right or wrong, but how much money you make when you are right and how much you lose when you are wrong – George Soros
Gold 1H Breakdown: Top Confirmed, Trend ReversedJust price, structure, and volume — tracked in real time.
🧠 Chart Breakdown:
✅ Trend Start / Structure Reclaim — Price regained key support and moving averages with momentum. Structure flipped bullish and trend began.
⛔ Top Exhaustion — Price reached new highs but began to stall. Volume dropped, and candles began curling — signaling a loss of momentum.
⚠️ Bounce Setup — After the pullback, buyers attempted to step back in — but structure never confirmed. No follow-through = no entry.
🚨 Breakdown Trigger — Sellers regained full control. Price broke below key levels with conviction. Volume confirmed the shift.
👀 Current Move — Price is pushing into new lows. Breakdown structure remains active until proven otherwise.
Always happy to be helpful.

gold on bearish reverse#XAUUSD price have now dropped below 3203 below, which have now formed a new pattern on sell.
Reverse at 3214 will continue bearish till 3183, stop loss at 3228.
Bullish can reconfirm below 3190 which holds multiple decline there.

Gold: Breakdown in Motion (15m Chart)Just price, structure, and volume — tracked in real time.
🧠 Chart Breakdown:
✅ Momentum Long — Price broke out from a base with clean volume. MA structure aligned, and bulls had control early.
⛔ Top Reversal — Price peaked and printed a clean rejection. Volume faded. Sellers rotated in.
⛔ Lower High Rejection — Attempt to reclaim highs failed fast. Fib and MA structure stacked against continuation.
⚠️ Temporary Recovery Attempt — Brief bounce off support, but no structure regained. No follow-through = no entry.
🚨 Breakdown Confirmed — Price lost all support levels with conviction. Volume backed the flush. Breakdown held and extended.
👀 Current Pressure Point — Price still pressing lows. Watching to see if momentum continues or if we get exhaustion behavior.
Always happy to be helpful.

XRP, MATIC, SHIB XRP projected significantly higher after crossing "the point of no return" hitting the first target. Both MATIC and SHIB are forming patterns resembling that of XRP. I believe like XRP, MATIC and SHIB will cross "the point of no return" and hit their first targets which are their all time high's.

Redeia (REE) blackout and market reactionBy Ion Jauregui – ActivTrades Analyst
Redeia (REE), operator of the Spanish electricity system and a member of the Ibex 35, has returned to the media and regulatory spotlight following the recent blackout that affected much of the southwestern part of the country. Although the government praised Red Eléctrica’s technical management during the event, everything points to a planning error in the electricity mix that left the system without sufficient response capacity during a period of high renewable energy production.
The incident occurred with more than 70% of the energy mix generated by renewable sources, particularly solar and wind, which lack the inertia provided by conventional technologies such as hydro or thermal. The absence of sufficient synchronous capacity and effective storage systems made it difficult to maintain frequency and voltage balance, triggering a preventive disconnection of part of the grid. This has reopened the debate on the urgent need for investment in technologies that can provide system stability, such as batteries and hybrid generation.
Solid fundamentals, but under closer scrutiny
Despite the episode, Redeia’s financial fundamentals remain strong. In its latest quarterly report, covering the end of 2024, the company reported:
• Revenue: €2.17 billion (+3.2% year-on-year)
• EBITDA: €1.65 billion
• Net profit: €680 million (+1.7%)
• Net debt: €4.9 billion, with a stable debt/EBITDA ratio of 3x
The company maintains a stable shareholder remuneration policy, with a dividend of €1 per share expected in 2025, representing a dividend yield of around 5.5% at current prices.
Additionally, Redeia continues with its 2021–2026 strategic plan, which includes a total investment of €4.4 billion, 75% of which is allocated to grid modernization, renewable integration, and storage systems. The company has reinforced its role as a facilitator of the energy transition, but incidents such as the recent blackout highlight that operational planning and technical capabilities must evolve in step with renewable growth.
Market reaction
Following the blackout, Redeia’s share price corrected by 2.3% over two sessions, settling around €18.10, although it still shows positive performance year-to-date. Volatility has slightly increased, reflecting uncertainty about potential regulatory consequences or adjustments to oversight mechanisms. Nonetheless, a moderately positive view of the stock remains, given its defensive profile, low correlation with the economic cycle, and ability to generate stable cash flows.
Technically, the stock has been climbing above the support at €17.61. The gap-down correction on Wednesday does not appear likely to halt the expanding moving average trend that began on February 18. The point of control (POC) is located at €16.80 in the previous accumulation zone, but the current price formation does not seem constrained. A return to the path of recent highs would be reasonable. RSI is slightly oversold at 48.70%. Current delta zones are slightly above the current price, around €18.74, suggesting potential gains if news flow is supportive and avoids negative sentiment dragging the stock down.
In conclusion, the blackout represents a reputational and technical challenge for Redeia, but it does not significantly alter its financial profile. The medium-term key will be its ability to invest in operational resilience and maintain the confidence of both regulators and the market.
*******************************************************************************************
The information provided does not constitute investment research. The material has not been prepared in accordance with the legal requirements designed to promote the independence of investment research and such should be considered a marketing communication.
All information has been prepared by ActivTrades ("AT"). The information does not contain a record of AT's prices, or an offer of or solicitation for a transaction in any financial instrument. No representation or warranty is given as to the accuracy or completeness of this information.
Any material provided does not have regard to the specific investment objective and financial situation of any person who may receive it. Past performance is not reliable indicator of future performance. AT provides an execution-only service. Consequently, any person acting on the information provided does so at their own risk.

Gold Updates - May 1st , ahead of Unemployment Claims & PMI News🔍 Gold Route Map – Updated May 1st | Macro Levels & Bias
📊 Today’s Key News (May 1st):
• 🕒 14:30 – Unemployment Claims (USD) • 🏭 14:45 – Final Manufacturing PMI • 🏭 15:00 – ISM Manufacturing PMI + Prices
Expect high volatility and whipsaws.
Gold continues its ruthless selloff, slicing through level after level with institutional precision. As we enter May, structure is loud and clear: bulls are out cold unless price proves otherwise.
👁🗨 Key Zones to Watch:
🔻 Resistance 3385 – HTF FVG zone / reversal risk
🔻 Resistance 3350 – Clean target above breakout
🔻 Resistance 3325 – Final barrier before shift
⚔️ 3315–3320 = Flip Zone
→ Flip = reclaim structure
→ Rejection = continuation sell
🔁 Retest 3308–3312 – Last OB Rejection
⚖️ 3286–3292 = Retest Range
→ Internal structure test
→ Weak support unless reinforced
🟩 3260–3270 = Reaction Zone
→ Confirmed demand
→ Last week’s sniper buy played from here
🟢 3252–3244 = Fresh Buy Zone
→ Strong OB + inefficiency
→ Eyes on reaction
🟢 3220–3235 = Major Discount Range
→ ⏳ Multi-timeframe OB + weekly FVG
🧊 3190–3205 = Daily Demand Shelf
→ If price nukes, this is where blood meets buyers
🧊 3160–3175 = April’s Demand Base
→ Mid-range accumulation shelf
📉 Current Bias
• HTF Trend: Bearish under ATH, clean lower highs • LTF Flow: Still bearish unless we flip above 3315 • Market Context: News-heavy week + low liquidity zones triggered this meltdown
🧠 Pro Tip: Don’t trade every bounce. Trade the right structure with proper confirmation. Most of the breakout noise is bait — only a few zones are true sniper setups.
Gold plays games. We play levels.
GoldMindsFX 🙏
📌 Important Notice!!!
The above analysis is for educational purposes only and does not constitute financial advice. Always compare with your plan and wait for confirmation before taking action.
🖊️ If these insights help you refine your trading plans, give us a boost and follow GoldMindsFX on TradingView. Let's grow together!
