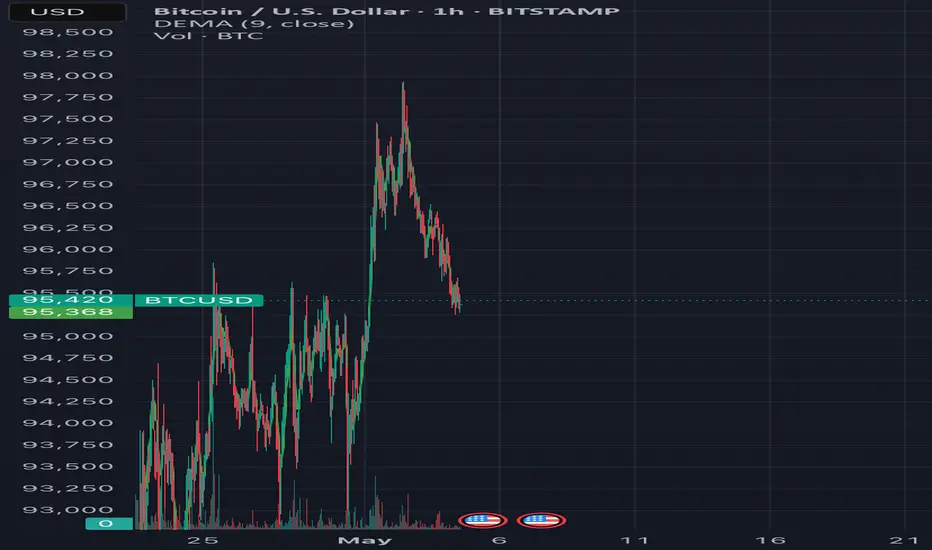
BTCUSDA likely continuation on the buys for BTCUSD...
Simply expect all trap taken out then we expect a push to form a new high.
Beyond Technical Analysis

Btcusd buyThe market is in an uptrend while also taking liquidity and hitting the 61.8 fib line. The volume is show a big move coming as well.
EURGBP Next weeks overview H4This will be my view on EURGBP for the upcoming weeks.
Do I really need to give a detailed description? I will see (lol), but I might actually be publishing more ideas on whatever that I am looking at, and mostly it might be HT ; that's HT for me as a day trader and swing trader. M15 will be for a closer view, I look for my entries on M5. Let's gooo!!!

NAS100USD: Bearish Setup Builds as Price Retests Key Supply ZoneGreetings Traders,
In today’s analysis on NAS100USD, we continue to observe bearish institutional order flow, and as such, our objective is to align our trading opportunities with this directional bias.
Key Observations:
1. Bearish Break of Structure and Retracement:
Following a clear bearish break of structure, price has retraced into a mitigation block. This zone represents an area where institutional buying previously occurred. As price trades back into it, institutions often mitigate those earlier positions and reintroduce sell-side interest—offering us an opportunity to follow their lead.
2. Confluence at the Mitigation Block:
The mitigation block is further reinforced by the presence of a bearish order block, adding strength to the resistance zone. This alignment suggests the area may serve as a high-probability reversal point for bearish continuation.
Liquidity Sweep Scenario:
There remains a possibility that price may take out nearby buy-side liquidity (buy stops) before continuing downward. If this occurs, we will wait for confirmation before entering short positions, maintaining alignment with the overall bearish narrative.
Trading Plan:
Upon confirmation of rejection at the mitigation zone, we will seek to engage in short setups targeting liquidity pools in discount pricing zones.
Remain patient, disciplined, and ensure each trade aligns with your strategy.
Kind Regards,
The Architect

Sideway range, gold price accumulates below 3302⭐️GOLDEN INFORMATION:
Gold price (XAU/USD) kicked off the week on a positive note, rising toward the $3,271 level during Monday’s Asian session as a blend of geopolitical and economic concerns fueled demand for the safe-haven asset. The prolonged Russia-Ukraine conflict, coupled with renewed tensions in the Middle East, continues to elevate global risk sentiment. Meanwhile, lingering uncertainty surrounding US President Donald Trump's tariff agenda has added to investor caution, further supporting the appeal of gold as a hedge in times of instability.
⭐️Personal comments NOVA:
Gold price continues to accumulate, low amplitude at the beginning of the week, waiting for the most important interest rate information this week
⭐️SET UP GOLD PRICE:
🔥SELL GOLD zone : 3302- 3304 SL 3309
TP1: $3290
TP2: $3280
TP3: $3270
🔥BUY GOLD zone: $3204 - $3206 SL $3199
TP1: $3215
TP2: $3224
TP3: $3240
⭐️Technical analysis:
Based on technical indicators EMA 34, EMA89 and support resistance areas to set up a reasonable SELL order.
⭐️NOTE:
Note: Nova wishes traders to manage their capital well
- take the number of lots that match your capital
- Takeprofit equal to 4-6% of capital account
- Stoplose equal to 2-3% of capital account

Mogcoin and the completion of the downward cycle; $0.000000068On the 4-hour chart of Mogcoin, equilibrium levels are marked from two highs of December 2024 and January 2025. As you can see on the chart, the recent reversal of Mogcoin price is due to entering the main zone of the January high and the market has not yet reached the downside of the main high in December... The equilibrium downside target of 0.000000068 will be touched to complete the equilibrium price cycle from the main highs....
In the long term and after completing the downward cycle, Mogcoin will reach the weekly bullish target of 0.0000041$.
Note: Equilibrium analyses look at the market on a large scale and macro scale and the targets may be delayed but will be touched...


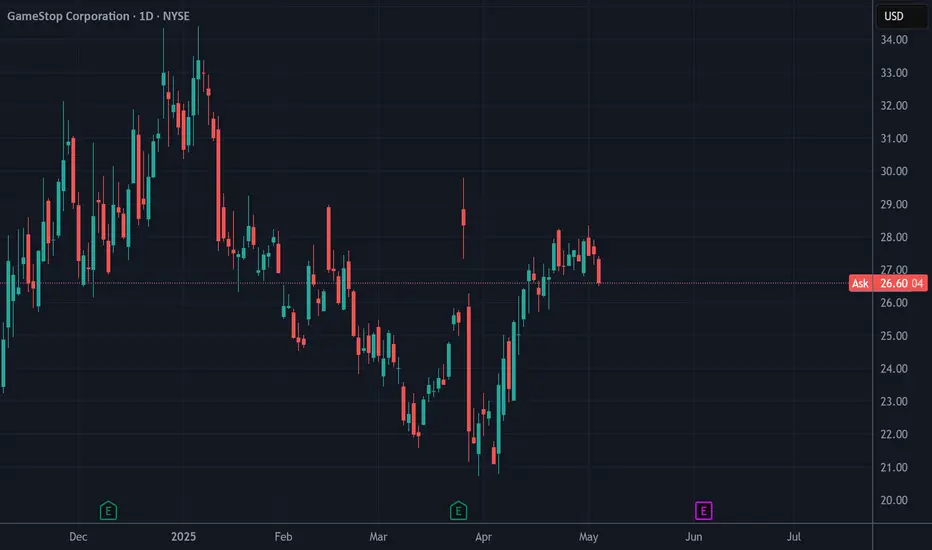
$GME - Late PostingHi guys, sorry i'm a bit late on this post. mMy AI is suggesting that GME will go down from here. Unknown by how much. Just opened a long put position today around this area.
That's all. Thanks.
BTC (Post Weekly Close Update)BTC has seen a weekly close above the 93700 support, suggesting bullish strength and likely continuation if this level holds on the weekly. We remain bullish as long as 93700 is maintained; a drop below it would be the first SOW on the HTF, potentially targeting 89K–90K, and possibly 1D OB at 83K–85K. Technically, this remains a LH until the 99500 SH is convincingly reclaimed, ideally on a weekly close.
On the daily, however, we’ve observed the first SOW, closing below the SH at 95K after a rejection from the 1D supply zone, refined into MTF HOBs, where whales initially sold off aggressively. This isn’t alarming, but it warrants attention. With the SPX at resistance, the DXY at support, USDT.D closing the weekly well above the SL at 5.03, and TOTAL at resistance, these are signs of caution, in my view, despite the series of bullish news we’ve seen. That said, with the HTF remaining bullish, we’ll focus on exploiting LTF and MTF moves. The FOMC meeting on Wednesday could certainly bring volatility in the markets, particularly as BVOL24H and BVOL7D, as mentioned in the last update, are at support.👀
To further examine the weakness, note the contrast between the two horizontal ranges (grey boxes). The first range saw a BO followed by impulsive PA, smashing through the 90K key level. In contrast, the second range produced a BO but encountered an HTF supply, resulting in a notably weaker bounce compared to the first BO from the lower range. This could potentially manifest as a deviation if the price closes below the RL, making the 8D HOB at 89K–90K our next target.
On the LTF/ MTF, we’ve also seen a break below the TL, with the other resistance TL being respected, indicating further weakness. Although we haven’t yet seen HTF weakness, I believe a scalp-sized short from the 11H OB, refined into a 2H HOB at 95500 SH, makes sense with a tight invalidation, or from the MTF level around 97500, if provided. If the daily closes above 95500 again, I might consider a scalp long into the 1D supply for a potential DT or even the 100K psychological level.

KAVA ANALYSIS📊 #KAVA Analysis
✅There is a formation of Descending triangle pattern on daily chart 🧐
Pattern signals potential bullish movement incoming after a breakout.
👀Current Price: $0.4280
🚀 Target Price: $0.5380
⚡️What to do ?
👀Keep an eye on #KAVA price action and volume. We can trade according to the chart and make some profits⚡️⚡️
#KAVA #Cryptocurrency #TechnicalAnalysis #DYOR

Why Palladium Is the Smart Play Right NowGold is hitting record highs, and silver is riding the wave—but smart investors know that diversification is key. While everyone is chasing gold, Palladium and Platinum are quietly setting up for a massive opportunity.
🔹 Palladium’s Market Position
✅ Palladium is rarer than gold—annual production is significantly lower.
✅ Industrial demand is surging, especially in automotive catalytic converters.
✅ Supply constraints due to geopolitical factors and mining limitations.
🔹 Palladium’s Role in the Green Revolution
🌍 Palladium is critical for reducing vehicle emissions—used in catalytic converters to meet stricter environmental regulations.
⚡ Hydrogen fuel cells and clean energy tech are increasing demand for Palladium.
🔋 Electronics & semiconductor industries rely on Palladium for conductivity and durability.
🔹 Gold Is at the Top—Time to Rotate?
📈 Gold is at all-time highs, making it expensive for new investors.
📉 Palladium has corrected from its highs, creating a buying opportunity.
💡 Diversifying into Palladium & Platinum now could be a strategic hedge against gold’s potential pullback.
🔹 Palladium’s Supply Crunch
⛏️ Russia & South Africa control most of the world’s Palladium supply—geopolitical risks could tighten availability.
📉 Mining output is declining, while demand remains strong.
💰 Lower supply + rising demand = price surge potential.
🔹 Platinum: The Underrated Hedge
💎 Platinum is historically undervalued compared to gold & Palladium.
🚗 EV & hydrogen fuel cell adoption could drive Platinum demand higher.
📊 Platinum-to-Gold ratio suggests Platinum is deeply discounted.
🔹 Final Thoughts
Gold is great, but smart investors look ahead. Palladium and Platinum are positioned for growth, with strong industrial demand, supply constraints, and undervaluation compared to gold.
📢 Now is the time to accumulate Palladium & Platinum before the market catches on.
TVC:PALLADIUM TVC:PLATINUM TVC:GOLD TVC:SILVER

Bearing target; 60 percent lower than the current price...In the analysis of the 4-hour FLOKY chart and from the June 2024 ceiling; the candles are moving towards the main zone and the price of 0.000029 after breaking the middle zone in the medium term... That is, something about 60% lower than the current price.... Note: Balanced and balanced Fibonacci analyses are accurate, and because they have a macro and large-scale view of the chart, sometimes we are delayed in reaching the target, but the balanced targets will definitely be touched...

Bitcoin Hype vs. Reality: A Breakdown of Bitcoin DelusionBitcoin enthusiasts often dream of mass adoption, corporate treasuries, and state-backed investments driving its price to astronomical levels. But let’s examine the actual numbers behind these claims.
🔹 The $1M Bitcoin Fantasy
Many believe Bitcoin will reach $300K, $500K, or even $1M. But what does that actually require?
💰 Bitcoin’s current circulating supply is approximately 19.5 million coins.
💰 At $830K per coin, the total market cap would be $16 trillion—which is:
✅ More than China’s entire GDP ($6T)
✅ 5x the market cap of Apple, Microsoft, Amazon, Google & Tesla combined
To put this into perspective, the entire global crypto market cap is currently around $2.99 trillion. Expecting Bitcoin alone to hit $16 trillion is beyond unrealistic.
🔹 Why Government & Corporate Adoption Won’t Skyrocket Price
Bitcoin believers often cite governments and corporations buying Bitcoin as proof it will moon. But here’s the reality:
⚠️ State & corporate purchases are OTC (Over-The-Counter) deals—they do not impact market prices like retail speculation.
⚠️ Governments negotiate strategically, they don’t impulsively buy at public prices to pump the asset.
⚠️ Treasury holdings do not guarantee higher prices—they only serve as reserves, not market drivers.
State adoption might increase legitimacy, but it won’t magically push Bitcoin past gold or global GDP levels.
🔹 Bitcoin’s Volatility vs. Gold’s Stability
Bitcoin is often compared to gold as a store of value, but its history tells a different story:
📉 Bitcoin has crashed over 80% multiple times—far from a stable asset.
📉 Extreme volatility makes it unreliable for wealth preservation.
📉 Liquidity issues create uncertainty, making it impractical for widespread adoption as money.
Gold, by contrast, has proven stability for centuries, with intrinsic value, industrial use, and universal acceptance.
🔹 Bitcoin Will NOT Absorb the Global Economy
Some claim Bitcoin will replace fiat, surpass gold, and absorb trillions in wealth. But the economic reality is:
❌ Bitcoin remains speculative, driven by market sentiment, not intrinsic value.
❌ No nation will abandon fiat for Bitcoin—they will regulate, integrate, but never replace sovereign currency.
❌ Bitcoin lacks industrial utility—gold has actual use in electronics, medicine, and aerospace.
🔹 The Crypto Dream vs. Financial Reality
Crypto thrives on believers, feeding them narratives that sound appealing but don’t match real-world economic fundamentals.
Bitcoin is not overtaking gold.
Bitcoin is not absorbing global wealth.
Bitcoin is not making every holder a millionaire.
Numbers don’t lie, but ignoring them won’t change reality. When the hype fades, speculative investors will face the harsh truth: Bitcoin is not a guaranteed path to riches—it’s a high-risk, volatile asset that operates in an unpredictable market.

EURUSD COT and Liquidity AnalysisCOT Report Analysis:
Overall we can see strong bullish sentiment in the COT.
and price will most likely continue higher- in the longterm.
But now We can see longs are not being added also price moved right after the report.
They didn't want us to see shorting. But is visible on the commercials side.
Hey what up traders welcome to the COT data and Liquidity report. This is a big part of my FX Trading. Im always trying to trade with the Big players so knowing their positions is good thing.
Please be aware that institutions report data to the SEC on Tuesdays and data are reported on Fridays - so again we as retail traders have disadvantage, but there is possibility to read between the lines. Remember in the report is what they want you to see, that's why mostly price reverse on Wednesday after the report so their cards are hidden as long as possible. However if the trend is running you can read it and use for your advantage.
I created this simple free indicator which you can find in the my scripts. It's highlighting the day of the real report - Tuesday.
Here is the tip if the level has confluence with the high volume on COT it can be strong support / Resistance.
Analysis done on the Tradenation Charts
Disclosure: I am part of Trade Nation's Influencer program and receive a monthly fee for using their TradingView charts in my analysis.
"Adapt what is useful, reject what is useless, and add what is specifically your own."
— David Perk aka Dave FX Hunter ⚔️

BTCUSDwhat a long on btcusd 100% correct prediction on my previous analysis. this time i see a strong manipulation unless strong break above 9700 then good pull back to enter long, or strong retest back to 7500 to get the range retest on weekly ( bos ) to enter long, with good confirmation.
as i have draw the line with a,b,c do your own anaylysis for any good decisio. let me know what you all think, leave a comment below. give it a like if you see my work is good.

Each Timeframe gives you crucial information so USE IT!!!All the information you need to find a high probability trade are in front of you on the charts so build your trading decisions on 'the facts' of the chart NOT what you think or what you want to happen or even what you heard will happen. If you have enough facts telling you to trade in a certain direction and therefore enough confluence to take a trade, then this is how you will gain consistency in you trading and build confidence. Check out my trade idea!!
www.tradingview.com

XAUUSD Daily AnalysisGold long-term trend is still bullish. based on ICHIMOKU the Xauusd is in supposed correction. daily support level (3228) was touched. the price is near important support level (3188).
For next weeks:
Support levels:
3188
3166
Resistance levels:
3351
3381
After that waiting for Ichimoku to give us the exact road map.

EUR USD - Short ideaIdea of a short
EURUSD
Entry @ PRICE = 1.13559
Stop @ Price = 1.3698
TP @ Price = 1.12728
Time of Entry to start looking for an Entry around 08:00 to 10:00 N.Y time

PCBLi Observed these Levels based on Price Action and Demand & Supply which is my own Concept "PENDAM CONCEPTS"... Please don't take any trades based on this chart/post... Because this chart is for educational purpose only not for Buy or Sell Recommendation... Thank Q

GBPCAD Trade against TrendWe will try to catch the correction wave on the GBPCAD before the huge move to the down side
Buy around 1.8340
Stoploss 1.8295
Target 1.8480
with RR 1:3

Xrp will outperform btc in the coming months.Xrp/btc has double bottomed vs BTC for many years. At some point it will show and prove what it has lacked for almost a half decade. I myself am a long term investor who has called Xrp from the major lows and expect it to gain over btc in the next 6 months.

XAUusd Scenario 05/05/2025 This week, Gold presents two potential scenarios based on current price action and key technical levels. While both a bullish and bearish outcome are possible, I’m leaning toward the bearish scenario and awaiting confirmation to capitalize on a potential downside move.

CRV Breakout Retest – Eyes on the Next Leg UpLSE:CRV has been trading within a well-defined ascending channel, showing a consistent bullish structure. Recently, the price broke above a key horizontal resistance level and is now retesting it—this is a classic breakout-retest scenario.
As long as CRV holds this support and remains within the channel, the bias stays bullish. A successful bounce from this zone could lead to a strong continuation toward the upper boundary of the channel or higher.
DYOR, NFA
