bearish reversal sign after entering overbought zone🔔🔔🔔 GBP/USD news:
➡️ The British Pound edged lower below 1.3400 against the U.S. Dollar during Tuesday’s European session, retreating from a fresh three-year high of 1.3445 reached earlier in the day. The decline came as traders grew increasingly confident that the Bank of England (BoE) will cut interest rates at its May policy meeting. This dovish shift is largely driven by weakening UK inflation expectations and rising concerns over global economic stress.
Personal opinion:
➡️ The USD is showing good signs of recovery during the day, plus not very positive news from GBP. So GBP/USD will maintain its downward momentum in the coming time
➡️ GBP/USD is showing signs of a recovery after reaching the overbought level
➡️ Analysis based on resistance - support levels combined with EMA and trend lines to come up with a suitable strategy
Personal plan:
🔆Price Zone Setup:
👉sell GBP/USD 1.3410 - 1.3400
❌SL: 1.3460 | ✅TP: 1.3345 - 1.3270
FM wishes you a successful trading day 💰💰💰
Beyond Technical Analysis

EUR/USD Bearish Setup
Recent negative US GDP data and rising inflation risks—partly driven by potential tariff policies—suggest recession fears are growing. Yet, current monetary policy still favors a stronger dollar in the short term.
On the daily timeframe, EUR/USD has hit a key TPO resistance zone and faced a strong rejection. Price is now moving toward the 1.0927 area, which aligns with a significant fair value zone based on volume profile. Bears may take control if this momentum continues.

EURUSD Take ProfitEURUSD moved into profit zone very quickly. Most likely, you won’t be able to catch this trade :( I’ll be sharing new setups throughout the day.

EURUSD SellHello everyone! The first trade of the day will be on EURUSD. On the 5-minute chart, I’ve set the trade with a Risk-Reward Ratio of 1:1.50 and will open a sell position. The TP target is 1.12920 and the SL is 1.13130. It’s better to activate the trade immediately."
Ve sonuna eklememi istediğin mesajla birlikte tam hali şu şekilde olur:
Hello everyone! The first trade of the day will be on EURUSD. On the 5-minute chart, I’ve set the trade with a Risk-Reward Ratio of 1:1.50 and will open a sell position. The TP target is 1.12920 and the SL is 1.13130. It’s better to activate the trade immediately.
🔔 I post detailed trade ideas and daily market analysis like this every day on my TradingView profile.
👉 Follow me to get notified and read the full breakdowns.

GBPJPY LONG SETUP UPDATE: 1:1 PROFIT ACHIEVED With our 1:1 profit target achieved, we'll now aim for a 1:2 ratio. To lock in some gains, let's secure half of the profits and allow the remaining position to run towards the full take-profit level.
Short on EURCAD- 1:2.5 Risk RewardConfluence of weekly EBP (Engulfing Bar Play) and daily FVG inversion for a 1:2.5 risk reward on EURCAD. Trade taken at 50% fib retracement level.

NAS100USD: Bullish Scalping Opportunity from SupportGreetings Traders,
In today’s analysis of NAS100USD, we identify bullish institutional order flow, and as such, we aim to align with this narrative by seeking buying opportunities.
This setup presents a scalping opportunity on the lower timeframes, with price currently reacting to a bullish order block serving as a key institutional support zone. Upon confirmation, we anticipate a move toward the liquidity pool in premium pricing, which will serve as our target zone for profit-taking.
As always, remain disciplined, wait for clear confirmation, and manage risk accordingly.
Kind Regards,
The Architect

TRADING PLAN: GBPJPY LONG TRADE SETUP Given the bullish sentiment in GJ today, and the successfully breaking out of the Asian session high, we'll take a long position. Our initial target is a 1:1 risk-reward ratio, followed by a 1:2 ratio after securing some profits.

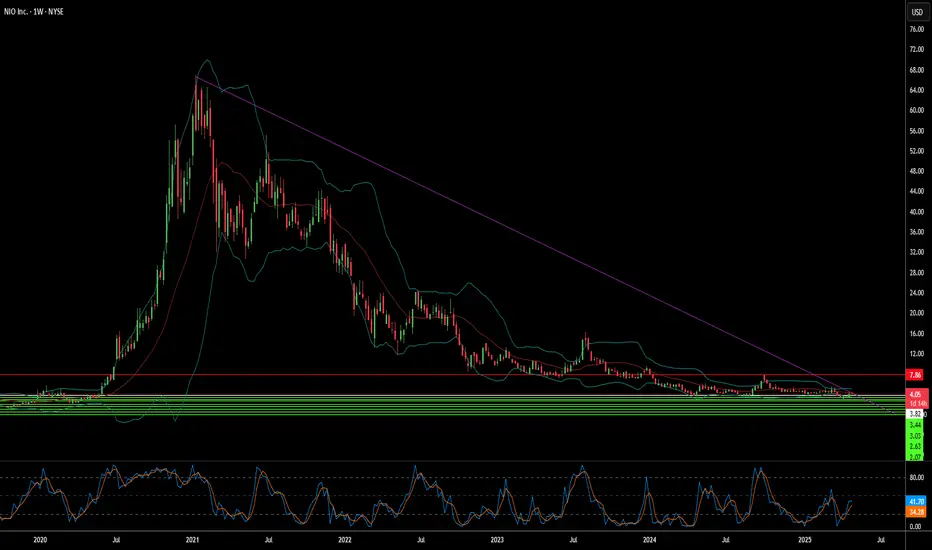
Is Nio’s ambition outpacing reality?Chinese electric vehicle maker Nio faces significant challenges despite strategic efforts like the recent launch of the Firefly brand. A successful and innovative company known for its battery swaps, Nio is now grappling with increasing domestic competition, slowing economic growth, and significant financial losses reflected in its low share price and market cap. The company’s path forward, and particularly its ambitious global expansion, increasingly appears fraught with external pressures and technological hurdles that threaten its long-term viability.
Chief among these challenges is rising geopolitical risks. Rising trade tensions between major global powers, including potential tariffs from the US and Europe, directly threaten Nio’s access to the international market and its growth prospects. More critically, the unresolved situation regarding Taiwan poses a serious risk of conflict (a Chinese invasion of Taiwan) and subsequent international embargoes. Such a scenario could disrupt global supply chains, especially for critical components such as semiconductors essential for electric vehicles, and cripple Nio’s production and sales.
Furthermore, Nio is in an expensive technological arms race, particularly in autonomous driving, competing with global leaders such as Tesla. While Nio uses a multi-sensor approach with LiDAR in its Navigate on Pilot Plus (NOP+) system, Tesla’s vision-only strategy and extensive data collection pose a formidable challenge. Both companies face obstacles, and with the complex task of perfecting autonomous technology in diverse environments, Nio must not only adapt to technological advances but also navigate complex regulatory landscapes and execute flawlessly to compete effectively and justify its significant investments in this space.
Macro Bullish Rates?An over simplification? I hope so.
The narrative fits too close for me. Needless to say, it's worth keeping an eye on.
If we manage to keep interest rates low for a while but inflation creeps in again (not due to high demand but because of monetary inflation) I can see the debt spiral scenario playing out in full force. This is a chilling thought, not something my generation has been exposed to and I believe it could have a very different impact to the population than the previous cycle. The difference being of course, the inflation not being demand driven but monetary debasement driven. To me this practically means a more impoverished population that is already struggling and those holding assets will further increase their portion of the pie.
There are a lot of unknows for me, as I basically know nothing about this. These are just my back of napkin thoughts. Me, trying to make sense of the world we live in because I know you can't look to anyone for the answer. Why? Frankly, I have learned that 98% of us don't know anything.
Ps - I am still not taking the deflationary narrative play off the table. Population decline, low interest rates and using robots to increase GDP etc. But either way all I can see is a exponential increase in debt creation. What other option is there? Both scenarios can't possibly lead to the same outcome, can they?

Why I Hesitate on Long Wick Candles (and How I Trade Through It)In today’s live trading review, I highlight one of the key challenges I face when trading the ES:
I don’t always feel confident executing during long wick days.
So how do I deal with that? Simple: reduce risk and stick to the framework.
Watch as I walk you through this session, break down the setup, and share how you can identify and study your own trading weaknesses — so you can grow stronger, one trade at a time.
#OneCandlestickAtATime #LiveTrading #ESFutures #TradingPsychology

Mastering Stop Losses: How Not to Trigger Them at the Worst TimeThere are few things more humiliating in trading than setting a stop loss… only to have the market tag it by a hair’s breadth before rocketing in the direction you knew it was going to go.
Oftentimes (hopefully not too often), stop losses are the financial equivalent of slipping on a banana peel you placed yourself.
But stop losses aren't the enemy. Their placement, however, could be.
If you’ve ever rage-quit your chart after being wicked out by a fakeout, this one’s for you. Let’s talk about how to master stop losses — without feeling like the market is personally out to get you.
😬 The Necessary Evil: Why Stop Losses Exist
First, let's acknowledge the elephant in the room: stop losses sometimes sting. They're like smoke alarms. Annoying when they chirp over burnt toast, lifesaving when there’s an actual fire.
The purpose of a stop loss isn’t to predict exactly when you’re wrong — it’s to limit how wrong you can be. It's the difference between losing a quick battle and losing the whole war.
Trading without a stop loss is like walking a tightrope without a net — all fine until it’s not.
🤔 The Amateur Mistake: "Where Should I Put My Stop?"
A lot of traders approach stop-loss placement like they're picking lottery numbers: random, emotional, hopeful.
"I’ll just slap it 10 pips below my entry. Seems safe."
But the market doesn’t care about your preferred round numbers. It cares about liquidity, volatility, and structure, regardless if it's the forex market , the crypto space , or the biggest stock gainers out there.
Good stop-loss placement is about logic, not luck. It's about asking:
Where is my trade idea invalidated?
Where does the market prove me wrong?
If you're placing stops based on how much you're "willing to lose" rather than where your setup breaks down, you’re setting yourself up to be triggered — emotionally and financially.
💪 The Art of "Strategic Suffering"
Good stops hurt a little when they’re hit. That’s how you know they were placed properly.
Stops shouldn't be so tight they get hit on routine noise, but they also shouldn't be so far away that you need therapy if it fails. Think of it as strategic suffering: you’re accepting controlled pain now to avoid catastrophic pain later.
Legendary trader Paul Tudor Jones famously said: “The most important rule of trading is to play great defense, not great offense.”
🤓 Where Smart Traders Place Their Stops
Want to know where smart money hides their stops? It's not random. It’s calculated.
Below key swing lows for long trades (how much below depends on the risk-reward ratio they’ve chosen to pursue)
Above key swing highs for shorts (how much above is, again, tied to the risk-reward ratio)
Outside of obvious support/resistance zones (also, risk-reward plays a role)
In other words: start thinking like the market. Where would a big player have to exit because the structure is truly broken? That’s where you want your stop.
👀 Avoiding the Stop-Hunter’s Trap
Is stop-hunting real? Oh yes. And no, it’s not personal. You're just very readable if you park your stops in obvious, lazy places.
The market loves liquidity. Price often pokes below swing lows or above highs because that’s where the money is. Stops create liquidity pockets that big players exploit to enter their trades at better prices.
So how do you avoid becoming easy prey?
Give stops a little breathing room past obvious levels.
Use volatility measures like ATR to set dynamic buffers.
Respect structure, not just random dollar/pip amounts.
A good stop is hidden in plain sight but protected by logic, not hope.
⚖️ Sizing Smarter: Risk per Trade Matters More Than Stop Distance (What’s Risk-Reward Ratio?)
Here’s where many traders mess up: they think tighter stops are always better. Wrong. Your stop distance and your position size are a package deal. If your trade idea requires a wider stop to be valid, your position size should shrink accordingly.
Trying to cram your usual size into a wide stop setup is how small losses turn into account-threatening disasters.
Hedge fund pioneer George Soros once said: “It’s not whether you’re right or wrong that's important, but how much you make when you're right and how much you lose when you're wrong.”
Master your sizing relative to your stop, and you master your survival. In other words, the risk-reward ratio should be playing a key role in placing your stop losses.
🥤 Mental Stops vs Hard Stops: Pick Your Poison
Some traders swear by mental stops: “I'll get out when it hits this level.” Others use hard stops: set-and-forget protective orders baked into the system.
Both have pros and cons:
Mental stops allow flexibility but risk emotional sabotage.
Hard stops guarantee protection but can trigger on sudden, hollow wicks.
Pro tip? Use hard stops if you’re new or undisciplined. You don’t want to be the guy saying “I’ll close it soon...” while watching your unrealized loss grow a second head.
🤯 Stop-Loss Psychology: It’s You, Not the Market
If you find yourself constantly blaming “stop-hunting whales” or “market manipulation” every time you get tagged out... maybe it’s not them. Maybe it's your stop placement.
Discipline in trading isn’t just about clicking buttons at the right time. It’s about planning for the tough times—and sticking to your plan even when it feels bad.
❤️ Final Thought: Love Your Stops (Or at Least Respect Them)
Stop losses aren't your enemy. They're your overprotective friends. Sometimes they’ll throw you out of a trade you "knew" would come back. But more often, they’ll save you from very dangerous outcomes.
Mastering stop losses isn't about never getting stopped out. It’s about getting stopped out properly — with dignity, with minimal damage, and with your account intact.
In trading, pain is inevitable. Wipeouts are optional.
Your move: How do you manage your stops — and have you ever been wicked out so badly you considered quitting trading? Drop your best (or worst) stop-loss stories below.

Bitcoin 30-Min Chart Update (Price Action Strategy) Price is once again reacting around the same key zones as before. The lower area near **93,550** has held as a solid reaction point (marked as L.S and Support), showing strong interest from buyers. After the bounce, price is moving upward toward the **short-term reaction zone** (S-T-R) where it faced pressure previously.
This setup highlights a balanced structure with clean levels:
- **Lower zone (Support + L.S)** showing signs of buyer strength
- **Upper zone (S-T-R)** acting as a short-term ceiling
- A defined plan with a favorable reward-to-risk outline
Watching for momentum near the top zone — if it breaks, we may see continuation. If rejected, price could revisit the lower reaction zone again. Structure remains clear and respected, just like yesterday.

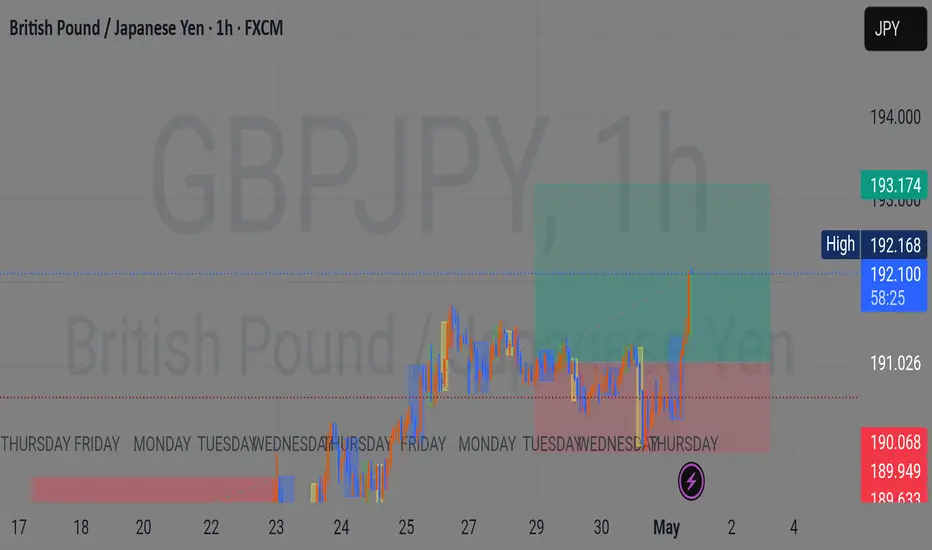
(GBP/USD) Setup based on **Price action and Key Zones** 🧠 Key Observations:
1. **Support Zone (Bottom Highlighted Box)**
- The lower purple box labeled "Support" represents a price area where the market has bounced from before.
- Price is currently approaching this area again, suggesting it may act as a **floor** where buying interest could return.
2. **Reaction Zone (Top Highlighted Box - Labeled R.S)**
- The upper purple box shows a past **reaction area**, where price previously reversed.
- This was a strong sell zone that pushed price downward, indicating supply or heavy selling.
3. **Current Market Behavior**
- Price has moved down from the upper reaction area and is now nearing the support zone.
- This sets up a potential **buying opportunity** if the support zone holds again.
4. **Risk-Reward Setup (Green & Red Boxes)**
- The green shaded area represents your **target zone**—the potential profit.
- The red shaded area shows your **risk zone**—how much you’re willing to allow price to move against you before exiting.
- This setup shows a **favorable risk-to-reward ratio**, meaning the potential gain is larger than the potential loss.
---
### 💡 Simple Ideas for Viewers:
- **Watch the support zone** closely. If price shows strength here (like forming a higher low or strong green candles), it might be a good place for a bounce.
- **Use confirmation**, like a bullish candle or increased volume, before entering any new trade.
- **Plan your exit**: Define your stop (risk) and target (reward) in advance, just like shown in the shaded boxes.

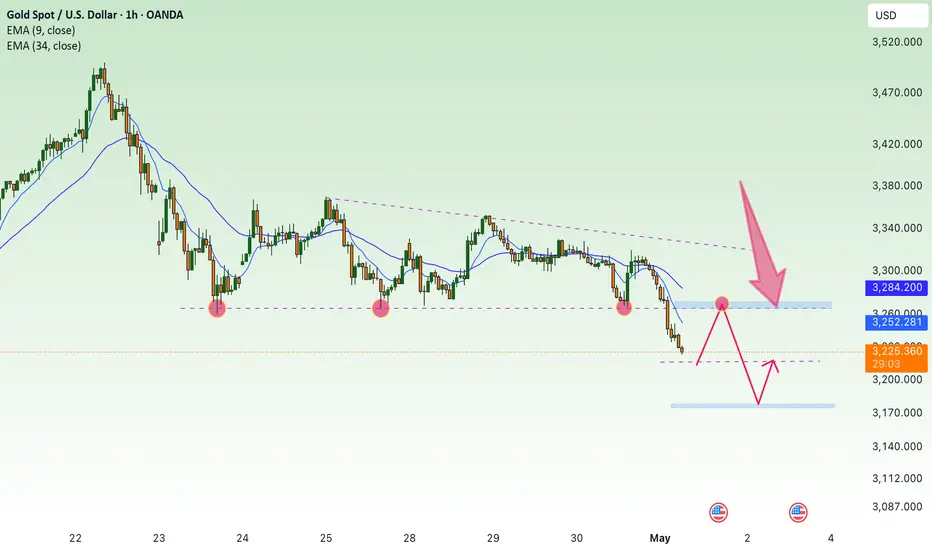
Gold price weakens, correction 3176⭐️GOLDEN INFORMATION:
Gold’s intraday decline appears partly driven by technical selling pressure after decisively breaking below the key $3,265–$3,260 support zone. However, the US Dollar (USD) struggles to sustain any significant recovery as expectations grow for more aggressive Federal Reserve (Fed) rate cuts—fueled by an unexpected contraction in US GDP and signs of softening inflation. These factors may continue to support demand for the non-yielding precious metal, suggesting that traders should remain cautious before anticipating a deeper pullback from the recent all-time high near $3,500.
⭐️Personal comments NOVA:
Crossing the 3264 mark in the sideways price zone, gold prices continue to weaken.
⭐️SET UP GOLD PRICE:
🔥SELL GOLD zone : 3270- 3272 SL 3277
TP1: $3260
TP2: $3250
TP3: $3240
🔥BUY GOLD zone: $3178 - $3176 SL $3171
TP1: $3185
TP2: $3200
TP3: $3210
⭐️Technical analysis:
Based on technical indicators EMA 34, EMA89 and support resistance areas to set up a reasonable SELL order.
⭐️NOTE:
Note: Nova wishes traders to manage their capital well
- take the number of lots that match your capital
- Takeprofit equal to 4-6% of capital account
- Stoplose equal to 2-3% of capital account
Gold has little momentum to continue rising - continues to fall 🔔🔔🔔 Gold news:
➡️ Gold prices reverse course during Monday’s U.S. trading session, recovering strongly from an intraday low of $3,268.03 to hover around $3,330. In the absence of major macroeconomic data, investors remained focused on trade developments. Mixed headlines regarding U.S.-China trade negotiations stirred some concerns after a quiet start to the day, with cautious optimism leading earlier sessions in Asia and Europe, thereby putting pressure on demand for the U.S. Dollar.
➡️ However, gold struggled to maintain its overnight rebound and faced renewed selling pressure during Tuesday's Asian session. Signs of easing U.S.-China trade worries and optimism about potential trade deals from the U.S. continued to support a risk-on sentiment, weighing on the appeal of the safe-haven metal.
Personal opinion:
➡️ Positive information about tariff negotiations is appearing more and more, and the parties are also easing trade tensions. So the gold price decrease is still maintained or at least difficult to increase further, unless there is a strong enough announcement to push the gold price up
➡️ Analysis based on important resistance - support levels and Fibonacci combined with trend lines to come up with a suitable strategy
Plan:
🔆Price Zone Setup:
👉Sell Gold 3357 - 3360
❌SL: 3365 | ✅TP: 3352 - 3346 – 3340
👉Buy Gold 3270 - 3273
❌SL: 3265 | ✅TP: 3278 - 3283 – 3289
FM wishes you a successful trading day 💰💰💰


AUDCHFno description, you can see on chart. if profit it will 100 pips.
“Don't ever make the mistake of believing that market success has to come to you fast. Trade small, stay in the game, persist, and eventually, you'll reach a satisfying level of proficiency.”
― Yvan Byeajee

no clear momentum yet - keep within the trend line🔔🔔🔔 AUD/USD news:
➡️ The Australian Dollar is slightly lower on Tuesday after recording a gain of more than 0.50% against the US Dollar in the previous session. The AUD/USD pair lost ground as the US Dollar gained amid easing global trade tensions.
➡️ However, the newly released US JOLTS Job Openings data is negative for the USD and could limit the decline of AUD/USD
Personal opinion:
➡️ USD/CAD will remain within the trend line and wait for strong enough news to break out of the safe zone in the coming time
➡️ Analysis based on resistance - support levels and trend lines combined with EMA to come up with a suitable strategy
Personal plan:
🔆Price Zone Setup:
👉 Buy AUD/USD 0.6385 - 0.6395
❌SL: 0.6340 | ✅TP: 0.6430
FM wishes you a successful trading day 💰💰💰

GOLD - Created 3 channel.Team,
buy gold now at 3236-3226
soft target at 3250-3256 - take 30%
medium at 3262-68 - take 50% volume
ABOVE 3280-3295 - all YOUR
STOP LOSS at 3205

SPY Eyeing Breakout — Trump Buzz & Options Walls Fuel Fire I'm breaking down SPY here the way I process it while flipping between daily and 1-hour charts.
Daily Timeframe:
The price action is flirting right at the top of this falling wedge pattern. What catches my attention is the strength in MACD and Stoch RSI—they're both pushing hard to the upside. This isn't a weak bounce. Momentum looks real, and we're sitting just under the 555–560 resistance range, which also happens to line up with a key structure break. If we can close above this upper wedge line, bulls might get the weekly breakout confirmation.
1-Hour Chart + GEX:
Now on the hourly, SPY already broke through the 550 level and hovered at 559 into the close. There’s some strong intraday buying volume confirming that breakout. But what's even more important to me is what GEX is showing—there’s a massive cluster of call walls stacked at 555 and 560. Today, the gamma flipped from neutral to green, and GEX data confirmed there's strong call exposure at 560. Meanwhile, the highest negative NETGEX put support sits deep at 545. This creates a strong upward magnet as long as we stay above 547.
Also, there’s buzz from today’s Trump investor roundtable. Headlines from that are already driving bullish sentiment, especially with tech and AI names in the mix. That political tailwind could be the final push that launches SPY through the wedge ceiling.
My Trade Plan:
* If price holds above 552, I’m watching 560+ as the upside magnet.
* Break and retest 555, I’ll consider a long scalp or debit spread targeting 560–563.
* If 547 breaks, that would be a red flag—puts might activate again and drag us toward 540.
Option Bias:
With IV low and GEX sentiment flipping bullish, I prefer buying calls or verticals over selling premium. But the 560 call wall is heavy, so I’m not chasing—wait for confirmation.
This analysis is for educational purposes only and does not constitute financial advice. Always do your own research and manage risk accordingly.

QQQ Rallying Into ResistanceQQQ Rallying Into Resistance — What’s Next After the Trump Roundtable?
I’ve been going through QQQ charts tonight and comparing the Daily and 1H timeframes side by side to map out what might come next — especially after the afternoon rally that aligned with headlines from Trump’s investor roundtable. It definitely caught attention.
Daily Chart Thoughts:
QQQ has been trending upward within a falling wedge since early April, and today’s candle closed just under the wedge resistance zone around 475–476. That level lines up with previous support-turned-resistance from March. The MACD is still pushing bullish momentum, and the Stoch RSI is cruising near overbought — signaling strength but caution at this zone. If we break above and hold, the next level I’m eyeing is the 493.50 zone. That would officially flip structure bullish.
1H + GEX Layer:
On the intraday side, today’s session really ramped after 2PM — notably when headlines about Trump’s meeting with tech and AI executives hit the wires. That sharp spike landed QQQ right into the GEX7 and GEX9 clusters, just under the 482.50 high. The Options GEX chart shows the 482 area also has 80%+ call resistance and clustering near key Gamma Walls.
Also worth noting: the options positioning is still heavy on puts (64.2%), which tells me this could be a squeeze if bulls defend the breakout above 473–475. If bulls can flip that gamma resistance at 482, we may start working toward 493 or even 500 this week — especially if the macro or political narrative continues to drive risk-on.
How I'm Thinking About the Trade:
I’m personally watching for a pullback retest of 475 or even 472. If we hold VWAP and start climbing back into the GEX zone, I’ll look to enter calls with tight stops. If this stalls under 482 and IV spikes, I’d consider selling premium or waiting for a deeper dip to reload.
Big Picture Forecast:
The Trump meeting gave bulls a jolt today, but whether that sticks will depend on follow-through volume tomorrow. If this is more than a headline pop, the Daily breakout could legitimize a broader tech rally — especially with Apple and NVDA also pushing.
Disclaimer: This is not financial advice. Just my personal market notes and trade planning shared for educational purposes.

NVDA Rallying After Trump Roundtable – Will the Momentum Hold? 💥Today’s rally in NASDAQ:NVDA got a little extra fuel after CEO Jensen Huang spoke at Trump’s investor roundtable. From what I’m seeing on the chart, the market liked it—at least in the short term.
Let me walk you through what I’m thinking as I line up the Daily vs. 1H timeframes and weigh that against options sentiment from the GEX chart.
🕰 Daily Chart View:
Price is trying to recover inside a downtrend channel, and today’s candle is testing the breakdown zone around $110–113. Momentum is definitely building, with MACD ticking higher and Stoch RSI pushing into bullish territory. But... we’re still technically below a key breakdown trendline (starting from the $150+ level), so bulls need continuation soon or it risks another fade.
⏱ 1H Chart Analysis:
The 1-hour chart looks a lot more bullish than the daily. After breaking through $107, NVDA exploded through key levels and is now pressing against $113.96 (GEX Gamma Wall) below. That’s also the highest net positive GEX level, so we could be entering a zone of dealer hedging that resists more upside unless flows get really aggressive.
You’ll also notice IVX is elevated (58.2), IVR is low (34.8), and GEX is neutral to slightly green. There’s a CALL-heavy structure forming up to $115, with the market currently coiling beneath it.
🔁 My Thought Process:
I think the CEO's participation in the Trump investor meeting gave institutions some reassurance, and that may explain the sharp bounce from $107. However, unless we can hold above $114 and squeeze into $115–$117, I see this as more of a trader’s move than a longer-term breakout just yet.
🎯 Trade Setup Idea:
* For Calls: Wait for a clean break above $114 → potential target zone: $117–120. Stops below $110.
* For Puts: If price fails again near $113.50–114 and we see weakness into the afternoon, watch for $110 → $107 retrace.
* Neutral: If we chop under the Gamma Wall and IV remains high, premiums may decay fast — sit out unless a clean direction emerges.
🧠 Final Thoughts:
I’ll stay flexible. GEX shows us $113.96 is the tug-of-war zone right now, and if bulls can reclaim and hold above it with volume, we could shift toward a gamma squeeze. But I’m also aware it might be a fade if the momentum stalls now that the Trump headline is digested.
Disclaimer: This post is for educational purposes only and not financial advice. Always do your own research and manage your risk.
