Dollar Doomsayers Are Dead Wrong: Why USD Will Crush It in 2025.Road To a Million fam! It’s your boy, back from the wilderness after a hiatus that felt longer than a bear market in a crypto crash. I’m pumped to be here, ready to drop some truth bombs, dissect the markets, and—most importantly—help us all make some serious bank. Buckle up, because there’s a ton to unpack, and we’re diving headfirst into the biggest elephant in the room: the U.S. dollar (USD). Spoiler alert: it’s not dead, it’s not even close to dead, and anyone saying otherwise is probably shorting it while crying into their latte. Let’s get into it!
The Dollar Drama: What’s the Deal?
If you’ve been anywhere near a financial newsfeed in 2025, you’ve heard the doomsday choir singing, “The dollar is done! Kaput! Finito!” The Dollar Index (DXY) is down 8% this year, and the Twitter (sorry, X) finance bros are out here proclaiming the end of the greenback’s reign as the world’s reserve currency. They’re screaming about de-dollarization, BRICS taking over, and gold mooning like it’s 1971. Meanwhile, I’m over here sipping my coffee, looking at the charts, and laughing. Why? Because the dollar’s obituary is the most exaggerated piece of fan fiction since Twilight.
Let’s cut through the noise and get to the meat. The USD has taken a beating, sure, but an 8% drop in a year doesn’t mean it’s packing its bags and moving to the Bahamas. The dollar is still the king of global trade, the backbone of international commerce, and the currency you need if you’re, say, India buying oil from Saudi Arabia. No one’s trading rupees for barrels, folks. They’re selling rupees, buying dollars, and getting that black gold. That’s the reality, and it’s not changing anytime soon.
So, why the panic? Why is everyone acting like the dollar’s about to be replaced by Dogecoin or a shiny new BRICS coin? Let’s break it down, roast the naysayers, and then talk about how we’re gonna make money off this drama. Because, let’s be real, that’s why you’re here.
Why the Dollar’s Down (But Not Out)
First, let’s address why the DXY is down 8% in 2025. The Dollar Index, for those new to the game, measures the USD against a basket of major currencies—56% euros, plus some GBP, JPY, CHF, CAD, AUD, and a sprinkle of others. It’s like a currency Thunderdome: one dollar enters, a bunch of others try to take it down. When the DXY drops, it means the USD is weakening relative to these currencies. But why?
Interest Rate Shenanigans: Central banks are the puppet masters of forex markets, and their interest rate moves are like plot twists in a soap opera. The U.S. Federal Reserve cut rates by 25 basis points to 4.25–4.5% on December 18, 2024, signaling a slightly dovish stance. Meanwhile, the Eurozone slashed its rate to 2.25% on April 17, 2025. That’s a 2% differential in favor of the U.S., which is huge in forex land. But the market’s been spooked by the Fed’s cut, thinking it’s the start of a softening cycle, while other central banks (like the ECB) are also cutting, creating a weird global rate limbo.
Inflation Tug-of-War: Inflation in the U.S. is at 2.4%, while the Eurozone’s at 2.2%. That means U.S. investors are getting a real return of about 2% (4.25% interest minus 2.4% inflation), while Eurozone investors are basically breaking even (2.25% minus 2.2% inflation). Money flows where it’s treated best, and right now, the U.S. is the VIP lounge. But short-term traders are freaking out over inflation fears and potential rate cuts, which has pressured the USD.
Trump’s Tariff Tantrums: Oh, Donald. The man’s back in the White House, tweeting (X-ing?) up a storm about “Making America Great Again” with tariffs left, right, and center. His trade war threats—10–20% tariffs on imports, 60% on Chinese goods—have markets jittery. A stronger dollar could make U.S. exports pricier, so some traders are betting on a weaker USD to balance things out. Spoiler: I think they’re wrong, and I’ll explain why later.
De-Dollarization Hype: The BRICS bloc (Brazil, Russia, India, China, South Africa, and friends) has been pushing for a non-USD trade system, with talks of a new currency or gold-backed system. This has fueled the “dollar is doomed” narrative. But let’s be real: a BRICS coin? Good luck getting China and India to agree on anything, let alone a unified currency. And gold? It’s ripping higher (more on that later), but it’s not replacing the USD for global trade anytime soon.
So, yeah, the dollar’s been punched in the face a few times this year. But it’s like Rocky Balboa—it’s taken worse beatings and still comes out swinging. The question is: Is this the end of the dollar’s dominance, or is it just warming up for a comeback? Let’s look at the big picture.
The Dollar Ain’t Going Anywhere (Here’s Why)
Listen up, because this is where I get on my soapbox and preach. The dollar is not dead. It’s not even on life support. If anything, it’s doing push-ups in the gym, getting ready to flex on the haters. Here’s why I’m so bullish on the USD, and why you should be too.
1. The Reserve Currency Superpower
The USD is the world’s reserve currency, and that’s not just a fancy title—it’s a superpower. Over 88% of global transactions (SWIFT data, 2024) are settled in USD. When Russia wants to sell gas to China, they often price it in dollars. When Brazil buys soybeans from Argentina, guess what? Dollars. Even countries with beef against the U.S. (looking at you, Iran) hold USD reserves because it’s the only currency universally accepted for trade.
Why does this matter? Because every country needs USD to play in the global sandbox. India’s not paying Canada for oil in rupees. They’re converting to USD or dipping into their dollar reserves. This creates constant demand for the greenback, and that demand isn’t vanishing overnight. Could it fade in a decade? Maybe. But in 2025? No chance.
And let’s talk alternatives. Bitcoin? Ha! It’s a speculative asset, not a stable currency for trade. Gold? It’s mooning (up 25% in 2025, per Bloomberg), but you’re not paying for a tanker of crude with gold bars. A BRICS currency? Good luck getting 10+ countries with conflicting agendas to agree on a logo, let alone a monetary policy. The USD’s reserve status is a fortress, and it’s not crumbling anytime soon.
2. Interest Rate Domination
Let’s talk money—specifically, where it flows. The U.S. has a Fed funds rate of 4.25–4.5%, while the Eurozone’s at 2.25%. That’s a 2% gap, which is like the Grand Canyon in forex terms. If you’re an investor, where are you parking your cash? In the U.S., where you’re earning a 2% real return (4.25% minus 2.4% inflation), or in the Eurozone, where you’re getting a big fat zero (2.25% minus 2.2% inflation)?
This is why the Eurozone’s in trouble. The ECB’s stuck in a trap—low rates to prop up struggling economies like Spain and Italy, but that makes the euro less attractive. Meanwhile, the U.S. is the cool kid at the party, attracting capital like moths to a flame. And don’t forget: the Eurozone’s a mess of 20 countries with one monetary policy but wildly different fiscal policies. Spain’s productivity isn’t Germany’s, no matter what the ECB pretends. The euro’s gonna weaken against the USD, mark my words.
3. Trump’s Dollar Rocket Fuel
Love him or hate him, Trump’s policies are about to light a fire under the USD. His “America First” agenda includes bringing manufacturing back to the U.S., which means building factories from scratch. Those factories need raw materials—steel, copper, you name it. And guess what currency they’ll use to buy that stuff? Ding, ding, ding—USD!
Plus, Trump’s tariffs (10–20% on imports, 60% on China, per Reuters) will reduce U.S. imports, meaning fewer dollars flowing out of the country. But foreign countries still need USD to repay their dollar-denominated debts (global USD debt is $13 trillion, per the BIS). Less USD supply, same demand? That’s a recipe for a stronger dollar. Trump’s shaking markets like a toddler with a snow globe, but in this case, it’s bullish for the USD.
4. Contrarian Goldmine
Here’s a little trading wisdom: when everyone’s screaming the same thing, they’re usually wrong. Right now, 99% of the finance world (or at least the loud ones on X) is saying the dollar’s toast. That kind of extreme sentiment is a red flag. Markets love to screw over the crowd, and when everyone’s shorting the USD, it means the bottom is either in or damn close.
I’m calling it: the DXY’s either bottomed already or will soon, probably around 97. When sentiment’s this bearish, it’s like the market’s handing you a gift-wrapped opportunity. And I’m not about to let it pass.
The Charts Don’t Lie: DXY Technical Breakdown
Alright, enough macro talk—let’s get to the fun stuff: charts. I’ve been staring at these squiggly lines for 20+ years, and they’re telling me the USD’s about to go on a tear. Let’s break it down, from the big picture to the nitty-gritty.
Long-Term View: The 20-Year Monthly Chart
Zoom out, fam. When in doubt, zoom out. I’m looking at the DXY on a monthly chart, going back to 2005. Each candle is one month, and the trend is crystal clear: up. The DXY’s been cruising in an ascending channel for two decades, like a train chugging along at 200 miles an hour. Sure, it’s hit some bumps—2008, 2011, 2020—but the direction’s undeniable.
Right now, the DXY’s sitting around 100, down from its 2024 highs. But it’s still within that bullish channel. I’m drawing trendlines here: a lower trendline connecting the lows (around 97–98) and an upper trendline around 120–125. The price is hugging the lower end, which screams “buying opportunity” to me.
My big-picture call? The DXY’s heading to 115–117 by late 2026 or early 2027, maybe even sooner (Jan 2026, anyone?). Why? Because a 20-year trend doesn’t reverse overnight. The dollar’s not dying—it’s just taking a breather before the next leg up. If you disagree, hit the comments. Let’s duke it out.
Short-Term View: The 4-Hour Chart
Now, let’s zoom in to the 4-hour chart for the past couple of months. The short-term trend’s been down, no question—DXY’s been sliding like a kid on a waterslide. But here’s where it gets juicy: I’m seeing a textbook inverse head-and-shoulders pattern. For the newbies, that’s a bullish reversal pattern, and it’s already played out like a charm.
Pattern Breakdown: The left shoulder formed in early April, the head hit a low around April 10, and the right shoulder wrapped up by April 21. The neckline (resistance) was around 99.8–100, and guess what? The DXY broke it like a champ.
Trendline Break: On top of that, the DXY smashed through a short-term downtrend line, confirming the bullish vibes.
RSI Divergence: Check the Relative Strength Index (RSI). From April 10 to April 21, the price made lower lows, but the RSI was making higher lows. That’s a classic bullish divergence, screaming, “The momentum’s shifting!” We jumped in when the trendline broke, and boom—profits are rolling in.
Price Targets and Trading Plan
Here’s the game plan, fam. The DXY’s already broken the neckline, so we’re in. Now, we’re watching these levels:
Immediate Target: 100.28
The DXY needs to close above 100.28 by the weekend (May 2–3, 2025). If it does, it’s go time. I’m telling you, go all in (responsibly, of course). This level’s key because it’s a minor resistance from prior price action. A close above it confirms the breakout.
Next Target: 103–103.5
This is the big one. The 103 zone is a major inflection point—tons of price action and clutter from earlier this year. If the DXY breaks 100.28, it’s got a clear path to 103. Expect some resistance around 100.27 (a support-turned-resistance level), but once it clears that, it’s smooth sailing to 103.
Probability: I’m giving this an 80% chance of heading higher, 20% chance of a pullback. Those are odds I’ll take any day.
Long-Term Goal: If the DXY follows its 20-year channel, we’re looking at 115–117 by 2026–2027. That’s not a pipe dream—that’s history repeating itself.
Trading Tip: We’re already positioned from the trendline break. If 100.28 breaks, scale up. If it pulls back to 97 (the lower trendline), that’s a dream buy zone. But don’t get caught in the daily noise—Trump’s tweets, CPI reports, whatever. Focus on the big picture.
Gold, Tariffs, and Trump: The Side Characters
I know you’re itching to talk gold, tariffs, and Trump’s wild ride. I’m saving the deep dive for another post (stay tuned!), but here’s the quick and dirty.
Gold: Gold’s up 25% in 2025 (Bloomberg), and everyone’s like, “See? Dollar’s dead!” Nah, fam. Gold’s ripping because of tariff fears, geopolitical chaos, and central banks hoarding it like Smaug. It’s not a dollar killer—it’s just doing its own thing. We’ll break it down soon.
Tariffs: Trump’s tariff plans (10–20% on imports, 60% on China) are shaking markets. They’ll make imports pricier, reduce USD outflows, and boost domestic demand for dollars. Bullish for USD, bearish for emerging markets. More on this later.
Trump: The man’s a market wrecking ball. He’s out here calling for lower rates one day, tariffs the next, and probably tweeting about aliens by Friday. But his manufacturing push and tariff policies are USD rocket fuel. Ignore the noise—focus on the policy.
Why You Should Care (And How to Profit)
Look, I get it. You’re not here for a PhD in economics—you’re here to make money. So, why should you care about the USD? Because it’s the backbone of the forex market, and where the DXY goes, opportunities follow. A stronger dollar means:
Forex Trades: Go long USD/EUR, USD/JPY, or even USD/CAD. The euro’s toast with that 2.25% rate, and the yen’s stuck in Japan’s low-rate purgatory (0.25%, per BOJ).
Stock Market Impact: A stronger USD could pressure U.S. multinationals (exports get pricier) but boost domestic firms. Think Walmart, not Apple.
Commodities: Oil and metals (priced in USD) could dip as the dollar rises. Short crude if you’re feeling spicy.
Emerging Markets: Countries with USD debt (like Turkey or Argentina) are gonna feel the heat. Avoid their currencies like the plague.
Here’s how we’re playing it at Edge-Forex:
Long DXY: We’re in at the trendline break, scaling up if 100.28 breaks. Target 103, then 115 long-term.
Risk Management: Keep stops tight below 99.5 (short-term) or 97 (long-term). Don’t bet the farm—markets love surprises.
Stay Nimble: Watch for Fed signals, ECB moves, or Trump’s next X rant. We’ll adjust as needed.
The Big Picture: Don’t Get Lost in the Noise
I know it’s tempting to get sucked into the daily drama—Trump’s latest outburst, a hot CPI print, or some X influencer shilling a “dollar crash” thesis. But trading’s about cutting through the noise. Zoom out. Look at the 20-year DXY chart. Look at the interest rate gap. Look at the USD’s reserve status. The dollar’s not going anywhere, and it’s about to remind everyone why it’s the boss.
My advice? Get out of the short-term clutter. Stop refreshing X every five minutes. Focus on the trends that matter: central bank rates, capital flows, and technical setups. The DXY’s setting up for a monster move, and we’re gonna ride it like surfers on a tsunami.
Wrapping It Up: Let’s Make Some Freaking Money
Alright, Edge-Forex fam, that’s the deal. The dollar’s not dead—it’s just been napping, and it’s about to wake up with a vengeance. The DXY’s forming a bottom, the charts are screaming “buy,” and the macro setup (rates, Trump, reserve status) is a bullish trifecta. We’re already positioned, and if 100.28 breaks, we’re going big.
I’m back, baby, and I’m here to drop regular updates, roast the haters, and help us all stack some serious profits. Got questions? Drop ‘em in the comments. Disagree with my DXY call? Bring it on—let’s debate. Just don’t be that guy shorting the dollar while the rest of us are cashing checks.
Stay tuned for the next post (gold’s getting its moment soon), and let’s make some freaking money together. Out!
Beyond Technical Analysis

BTC updateAs seen here BTC broke 96K up.
But, the Level 96400 has not. 96400, like it was said in previous chart is very significant!
Let's is IF we still above (on closing basis) that Level!
Notice:
Total Crypto - the Levell of 3-3.03T has not been broken (yet).
Will keep you posted!

H4 Gold Bearish Trend for todayGold has seen a structural change in the 4-hour timeframe and has broken the support level of $3260. A downward trend can be expected for gold to the $3150 price range.

The Day Ahead Macroeconomic Data Releases (Market-Moving Potential):
US Data
ISM Manufacturing Index (April): A key indicator of manufacturing health; impacts USD, equities, and bond yields.
Total Vehicle Sales: Reflects consumer demand and manufacturing strength.
Construction Spending (March): Signals strength in real estate and infrastructure sectors.
Initial Jobless Claims: Weekly indicator of labor market health; influences Fed policy expectations.
UK Data
Net Consumer Credit & M4 (March): Provides insight into consumer borrowing and money supply growth; can affect GBP and BoE policy outlook.
Japan
Consumer Confidence Index (April): Influences sentiment on domestic consumption; impacts JPY and Nikkei index.
Canada
Manufacturing PMI (April): Indicator of economic activity; affects CAD and TSX.
Central Bank Activity:
Bank of Japan (BoJ) Policy Decision:
Key focus on any adjustments to yield curve control or forward guidance. High impact on JPY, Japanese equities, and global bond markets.
Corporate Earnings (High-impact, broad sector exposure):
Mega-cap Tech & Consumer:
Apple, Amazon, Airbnb, Roku, Wayfair, Reddit: Major influence on Nasdaq and sentiment in growth/tech stocks.
Financials & Payments:
Mastercard, Block, Blue Owl Capital, KKR: Insight into consumer spending and credit trends.
Healthcare:
Eli Lilly, CVS Health, Moderna, Stryker, Amgen: Updates on drug pipelines and healthcare services; influences biotech sentiment.
Industrials & Energy:
McDonald's, Linde, Harley-Davidson, Dominion Energy, United States Steel, Targa Resources, Howmet Aerospace: Read-throughs for global demand, input costs, and supply chains.
Other Key Sectors:
Estee Lauder (Luxury/Consumer), Duolingo & Twilio (Tech/EdTech), Live Nation (Services), Maplebear (Instacart), Cameco (Uranium/Nuclear): Diverse sector insights.
Other Notable Events:
UK Local Elections:
Though local, outcomes may indicate broader political sentiment, especially ahead of a potential general election. Moves in GBP, UK equities, and gilts possible if results hint at political instability or changes in economic policy outlook.
Trading Implications:
Equities: Expect high volatility due to major earnings releases and macro data. Sectors like tech, healthcare, and consumer discretionary could see significant moves.
FX: USD, JPY, and GBP in focus due to data and central bank developments.
Bonds: ISM, jobless claims, and BoJ decision may affect global yield curves.
Commodities: Vehicle sales and construction data may influence oil/metals demand expectations.
This communication is for informational purposes only and should not be viewed as any form of recommendation as to a particular course of action or as investment advice. It is not intended as an offer or solicitation for the purchase or sale of any financial instrument or as an official confirmation of any transaction. Opinions, estimates and assumptions expressed herein are made as of the date of this communication and are subject to change without notice. This communication has been prepared based upon information, including market prices, data and other information, believed to be reliable; however, Trade Nation does not warrant its completeness or accuracy. All market prices and market data contained in or attached to this communication are indicative and subject to change without notice.

WLDUSDTConsidering the positive news about this currency, which has started operating in six American cities and is attracting attention and focus, and from the technical perspective that you can see, I think it is worth the risk and with proper risk and capital management, we can have it in our portfolio.

EURCAD TOP DOWN ANALYSIS 4HR TIMEFRAMEOn the 4hr timeframe, we noted the key zone + breakout of the rising wedge and the trendline + confirmation candles for the breakout candle that formed afterwards hence we take a quick entry short in this short term retracement and our stoploss above the trendline etc. May the gains be with us all!!

SILVER H4 IdeaPotential for a bearish pullback on the XAGUSD H4 which could lead to a price movement towards the support level at 30.600. SELL levels from 33.600

EURCAD TOP DOWN ANALYSIS BEARISH BIASON THE WEEKLY, we established the major key monthly and weekly zone + momentum loss of candles and appearance of bearish candles followed by multiple candle rejection on the weekly right at the key zone + wide weekly divergence right at the key zone which is very rare!! a week all signaling bearish hence we move to the daily timeframe!!

Bitcoin is about to got Parabolic!Good Day, traders and investors,
You read that right, bitcoin is about to go parabolic!
How can I say this? I'm strictly basing it on cycle analysis.
This is a 2 week chart of Bitcoins Entire History.
I have broken down into phases 1 & 2 and cycles. Both phases are very distinct and have their very different characteristics. The RSI also helps distinguish the differences between the two phases.
So, first off the picture in black is the genesis fractal overlayed the latest bull run since 2023. It does rhyme fairly well with this bull run and points to a parabolic top into June 2025.
The RSI in phase 1 Shows bearish divergence the entire cycle as the price rises over the bull run with lower highs. At the same time the lows get higher and contracts then explodes into the final parabola and a blow off top, that leads into a higher high in price and RSI. This is the phase that is quickly approaching us. In the genesis cycle this parabola lasted for 5 2 week bars which is up to 10 weeks. In the phase 1 of the 2nd cycle it lasted for 6 2 week bars that converts up to 12 weeks. This could lead to the parabolic top into mid to late June. This is the phase is circled in the chart.
If June seems like an unlikely place to top for you, I say that it has once previously before, June of 2011.
The second phase although highlighted, I am not focusing on at the moment as it's irrelevant. The focus is Phase 1 and the RSI. Phase 2 is just there to show the difference and create some order in the chaos of the markets.
If you like this information and feel as it has helped you, please give me a like and follow on TV and my other listed socials, share the information with friends and others.
Also, Please feel free to let me know what you think in the comments down below. I would love to hear from you.
Kind regards,
WeAreSat0shi

BITCOIN Monthly Candle close patterns since 2011 - APRIL CLOSE
Again, we got the expected Monthly Close, This time GREEN
April is traditionally a Strong Green Month, now with 9 Green Closes to 5 RED - Nearly twice as many Green to Red.
MAY is a different story, Nearly 50 / 50 previous closes with GREEN having an advantage of 1.
BUT, With April closing Green after the previous months closes, things do look positive.
On only 2 occasions have we had a GREEN JAN, RED FEB, RED MARCH, GREEN APRIL
And Both of them were on the way to ATH. ( Arrows )
On both those occasions we had a GREEN MAY, though the gains weer minimal and one was followed by a Green June and the other by a Red June.
We have had 4 occasions with a MARCH RED, APRIL GREEN, MAY GREEN
Of the previous 9 GREEN April Closes, 5 were followed by a Green June
And of those 5, 2 were followed by consecutive Green candles closes for the following Months.
Though in 2020 sequence ( 2nd Arrow) after a GREEN May close, you can see the candles were not big and we had Red Green Green Red for 4 months then went Green consecutively.
Of the previous 7 Green MAY candles, 4 were Bigger than the previous month candle.
I am more inclined to look at the 2020 sequence in this for now and yet, at the same time, as posted in another chart, I am also still looking at the lead up to the 2017 ATH and for this to continue, we need a Bigger GREEN MAY close this month.
There is a very strong line of resistance just over head.
Currently, at time of writing, The opening MAY candle is GREEN but only just
This month is CRUCIAL

Gold will Begin fall in short TermGold begin will fall in short term according this analysis from Mr Martin Date 01 May 2025,
Gold will reached in cervical moment if the price will break from current zone then we could see Gold will push to down side Gold price will manipulated for long time it will be difficult for traders when the big bearish will starts.
Key Levels
Resistance 3240 3250
Support 3200 / 3185
you maty find more details in the chart Ps Support with like and comments for more analysis Thanks Traders.

Geospatial Technology: A Catalyst for Modern InnovationBeyond Earth-based uses, geospatial tools are now integral to advancements in autonomous vehicles, drone technology, and even space exploration. As data becomes increasingly abundant, the ability to tie that data to a physical location adds powerful context that static information cannot provide.
Geospatial technology enhances safety, efficiency, and scalability. It enables vehicles and systems to operate with spatial awareness, supports AI-driven decision-making, and ultimately helps automate logistics in a reliable and responsive way.
FedEx has recently emphasized its commitment to integrating autonomous technologies to enhance logistics efficiency and resilience. These initiatives aim to streamline operations and reduce costs, contributing to a $6 billion reduction in the company's cost base over three years. XYO happens to be a partner at the FedEx institute of tech.
XYO is also rumored to be integrated with Tesla vehicles -- just like with Bitcoin mining. The hope is to use the XYO blockchain to address location spoofing issues where validity of data and safety is paramount. This goes in hand with Tesla's goals to make your care work for you. In fact, the goal for XYO is to pay users for creating and validating data.
Key Developments in the Past 12 Months:
1. Launch of XYO Layer One and Dual-Token Economy
2. Expansion to Solana
3. Introduction of the XYO Platform Node
4. Gamification and User Engagement
5. Developer Resources and Community Building
XYO launched the "Build the Future" initiative, aimed at fostering a robust developer community. This program provides resources, documentation, and incentives for developers to build applications and tools on the XYO network.
Looking ahead, XYO plans to continue enhancing its Layer-1 blockchain capabilities, expanding interoperability with other blockchain networks, and introducing more user-centric applications. The focus remains on building a decentralized, user-owned geospatial data network that empowers individuals and developers alike. A network-effect-like-potential for this technology is worth paying attention to.
From a military standpoint, geospatial technology is critical because it provides the foundation for situational awareness, precision, and operational dominance in modern warfare:
GPS and satellite imagery
Real-time geospatial intelligence (GEOINT) ensures that moving or hidden targets can be tracked and re-verified before engagement.
Terrain analysis
Topographic and environmental data
Autonomous surveillance drones need GPS and HD geospatial mapping to patrol borders or conflict zones.
Logistics bots and unmanned vehicles rely on route optimization for resupply missions under fire or in denied environments.
Geospatial analytics can identify unusual patterns (e.g., IED placements, enemy camps) from satellite data.
Geofencing can alert personnel when enemies or drones breach a protected area.
Before any mission, simulations and war games based on real-world geospatial data improve planning and reduce risks.

GOLD Once more fall what will next?According this analysis a next Gold movement ,
Forest from Mr Martin Date 29 April Tuesday 2025
Gold has been in under pressure amid tariff war and head if US Data.
on Monday Gold is testing the last week 3260 remining under pressure from strengthening dollar and easing trade risks between the US and china. Gold will a new zone will formed I will see the market price once more fall and catch the strong Support.
Resistance Zone 3330 / 32340
Support Levels 3285 / 3275
You may find more details in the chart Ps Support with like and comments for more analysis.

Arshitecture / 30 Min Short Position SP500After the price reaches TP1, hold the current short position and consider adding to it on valid signals to ride the move toward TP2. Apply the same strategy for TP3, scaling in cautiously at key resistance zones.
I’ll share the key confirmations on the chart as they appear.
Goodluck BLUEBERRY:SP500

GBPUSD – Short-Term Upside RetestGBPUSD – Short-Term Upside Retest
📈 Long Bias | 🎯 Target: 1.33181 | ⏳ Deadline: May 1
After extended downside pressure, price is showing signs of curling back toward the prior breakdown area near 1.33181. Watching this level closely as a short-term magnet on the lower timeframes. I am in.
💡 All trades can be replayed on TradingView for learning and review.
#GBPUSD #Forex #PriceAction #MarketSetup #TradingView #GlobalHorns

NIO - Clear Skies AheadFor those looking to invest in Nio or already invested and praying on a better sky - the bullish way is predicated on price following the road i have outlined on the chart. We are at an area of price where we can start to see institutional players step in now after accumulating very cheap positions in what is in my opinion one of the outstanding EV companies in the world.

Positive US talks are supporting the USD🔔🔔🔔 USD/JPY news:
➡️ USD/JPY recovered to around 142.70 during the Asian session on Tuesday as positive risk sentiment undermined safe-haven assets such as the Japanese Yen while boosting the US Dollar. However, further gains appear limited amid weak trading conditions due to a holiday in Japan.
Personal opinion:
➡️ Positive news on tariff negotiations is emerging more and more, and the parties are also easing trade tensions. This is supportive for the USD and could cause USD/JPY to rise slightly in the coming time
➡️Analysis based on important resistance - support and Fibonacci levels combined with trend lines to come up with a suitable strategy
Personal plan:
🔆Price Zone Setup:
👉Sell USD/JPY 143.20 - 143.30
❌SL: 143.70 | ✅TP: 142.70 - 142.20
FM wishes you a successful trading day 💰💰💰

Everyone I am shorting DOW/US30Team I am shorting DOW, - MUST have stop loss the price could hit 40912-16 - but short slowly now, with STOP loss at 40960-65
Target 1 at 40750-40735 - reduce 30% volume
Target 2 at 40650-40600 - reduce 50% volume
Target 3 at 40550-740483 - remaining
Once the price reaches the first target, bring STOP LOSS TO BE
NEXT week, I will be releasing a video on how I made 1000% profit in 4 weeks. I would love to share my strategy with the world.

bearish reversal sign after entering overbought zone🔔🔔🔔 GBP/USD news:
➡️ The British Pound edged lower below 1.3400 against the U.S. Dollar during Tuesday’s European session, retreating from a fresh three-year high of 1.3445 reached earlier in the day. The decline came as traders grew increasingly confident that the Bank of England (BoE) will cut interest rates at its May policy meeting. This dovish shift is largely driven by weakening UK inflation expectations and rising concerns over global economic stress.
Personal opinion:
➡️ The USD is showing good signs of recovery during the day, plus not very positive news from GBP. So GBP/USD will maintain its downward momentum in the coming time
➡️ GBP/USD is showing signs of a recovery after reaching the overbought level
➡️ Analysis based on resistance - support levels combined with EMA and trend lines to come up with a suitable strategy
Personal plan:
🔆Price Zone Setup:
👉sell GBP/USD 1.3410 - 1.3400
❌SL: 1.3460 | ✅TP: 1.3345 - 1.3270
FM wishes you a successful trading day 💰💰💰

EUR/USD Bearish Setup
Recent negative US GDP data and rising inflation risks—partly driven by potential tariff policies—suggest recession fears are growing. Yet, current monetary policy still favors a stronger dollar in the short term.
On the daily timeframe, EUR/USD has hit a key TPO resistance zone and faced a strong rejection. Price is now moving toward the 1.0927 area, which aligns with a significant fair value zone based on volume profile. Bears may take control if this momentum continues.

EURUSD Take ProfitEURUSD moved into profit zone very quickly. Most likely, you won’t be able to catch this trade :( I’ll be sharing new setups throughout the day.

EURUSD SellHello everyone! The first trade of the day will be on EURUSD. On the 5-minute chart, I’ve set the trade with a Risk-Reward Ratio of 1:1.50 and will open a sell position. The TP target is 1.12920 and the SL is 1.13130. It’s better to activate the trade immediately."
Ve sonuna eklememi istediğin mesajla birlikte tam hali şu şekilde olur:
Hello everyone! The first trade of the day will be on EURUSD. On the 5-minute chart, I’ve set the trade with a Risk-Reward Ratio of 1:1.50 and will open a sell position. The TP target is 1.12920 and the SL is 1.13130. It’s better to activate the trade immediately.
🔔 I post detailed trade ideas and daily market analysis like this every day on my TradingView profile.
👉 Follow me to get notified and read the full breakdowns.

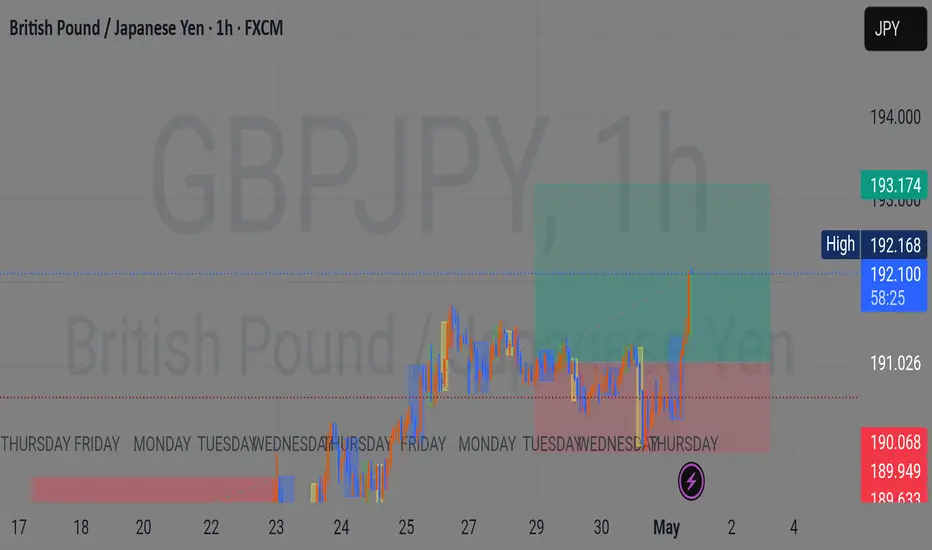
GBPJPY LONG SETUP UPDATE: 1:1 PROFIT ACHIEVED With our 1:1 profit target achieved, we'll now aim for a 1:2 ratio. To lock in some gains, let's secure half of the profits and allow the remaining position to run towards the full take-profit level.