XTZ Forming Ascending Pattern🚨 SEED_DONKEYDAN_MARKET_CAP:XTZ Forming Ascending Pattern 🚨
SEED_DONKEYDAN_MARKET_CAP:XTZ is forming an ascending pattern and is approaching a key red resistance zone. A breakout above this level could signal a strong bullish move.
📈 Technical Overview:
Pattern: Ascending
Resistance Zone: Red area currently being tested.
Beyond Technical Analysis

Range Bound or Ready to Break? Analyzing the Compression Zone in
Timeframe: 1H
Tool: Target Trend , AlgoAlpha Order Flow
Price at Analysis: $94,216.41
🔍 Key Observations:
We’re currently witnessing a tight range-bound movement on the 1H chart, with price oscillating between two key levels:
Support Zone: ~$94,244
Resistance Zone: ~$95,449
This range has held for several candles now, with multiple rejection wicks near the top (indicated by red arrows) and consistent buying pressure at the bottom (blue arrows), indicating accumulation at support and distribution at resistance.
🔼 Net Buy Pressure is rising, as seen by the clustering of blue arrows at higher lows — a classic sign of bullish compression.
🔽 However, the red arrows at the top suggest whales or institutions are unloading positions at resistance, which could stall a breakout.
📌 Trade Ideas:
1. Breakout Play (Bullish Bias):
Wait for a confirmed breakout above $95,449–$95,666
Target: $96,247 – $97,000
Stop-loss: Below $95,200
2. Range Scalping:
Buy near support ($94,250), sell near resistance ($95,400)
Keep tight stop-losses as this range is maturing.
3. Breakdown Risk:
If price fails to hold above $94,244, we could see a swift move to $93,361 or lower, where next demand lies.
🔮 Final Thoughts:
We are in a classic compression phase, with buyers stepping in aggressively but sellers still defending resistance. A breakout is imminent — the question is: which side will blink first?
Until then, this is a range trader’s paradise — just keep an eye on volume spikes and momentum divergence.
🧠 Tip: Use alerts around $95,666 and $94,244 to avoid missing the move.
📌 Follow me for more real-time crypto breakdowns and TradingView setups!

AUDUSD Potential DownsidesHey Traders, in tomorrow's trading session we are monitoring AUDUSD for a selling opportunity around 0.64100 zone, AUDUSD is trading in a downtrend and currently is in a correction phase in which it is approaching the trend at 0.64100 support and resistance area.
Trade safe, Joe.

WLD Bearish Head and Shoulders Pattern ConfirmedWLD Bearish Head and Shoulders Pattern Confirmed 🚨
WLD has formed a bearish head and shoulders pattern and is currently breaking below the red neckline. The target for this bearish move is the green line level.
📈 Technical Overview:
Pattern: Bearish Head and Shoulders
Neckline: Red level, currently being broken.
🎯 Target: Green line level.
.

SPX - LONGprice is moving well with trade talks easing and agreements potentially coming into place. I believe price will continue this bullish momentum

Bearish Head and Shoulders Pattern Confirmed 🚨 NYSE:SUN
Bearish Head and Shoulders Pattern Confirmed 🚨
NYSE:SUN
has formed a bearish head and shoulders pattern and has been rejected from the neckline. The target for this bearish move is the green line level.
📈 Technical Overview:
Pattern: Bearish Head and Shoulders
Neckline: Rejection confirmation
🎯 Target: Green line level.

XAUUSDThis appears to be a trading interface for **XAU/USD (Gold vs. U.S. Dollar)**. Here's a breakdown of the key elements:
1. **Current Price**:
- **3,315.620 USD** per ounce of gold.
- **Change**: -28.175 points (-0.84%) from the previous period.
2. **Buy/Sell Options**:
- **SELL** at **3,315.150** (bid price).
- **BUY** at **3,316.060** (ask price).
- The difference between these prices reflects the **bid-ask spread** (≈1 point).
3. **Price Levels (Support/Resistance?)**:
- Listed prices from **3,360.000** (high) to **3,270.000** (low) likely represent recent price action or order book depth.
- The current price (**3,315.620**) is near the lower end of this range, suggesting potential downward momentum.
4. **Timeframe**:
- **15-minute chart (15m)** – Short-term trading view.
- Time stamp: **10:56** (likely when the data was captured).
5. **Additional Notes**:
- **91.0**: Possibly an indicator value (e.g., RSI, volume, or volatility metric).
- Tabs at the bottom (**Watchlist, Chart, Explore**) indicate this is a trading platform interface (e.g., MetaTrader, TradingView).
### Key Takeaway:
The price is in a short-term downtrend (-0.84%), with immediate resistance around **3,320–3,325** and support near **3,310–3,300**. Traders might consider the **SELL** price if anticipating further declines or **BUY** if expecting a reversal. Always confirm with additional analysis

The support and resistance idea behind GBPJPYThe price formed a resistance zone at 189.880-189.427 which was broken and become the new support zone.
The price has continued and broke a new resistance zone 190.960-190.580 and fails to project upwards and starts to fall.
#Their is a possible chance of the price reaching its previous support zone(189.88-189.427)

VIX Bullish Watch OutBased on Chart current at P. High (Previous High) Act as strong support I strongly believe VIX will go Up and market will go Down from here.
Significant Resistance are P. High and Take Profit Lines.
Once Resistance reached Watch out for VIX going down.
Once VIX Down Market Is Up and Vice Versa Watch out.
Take Care.

ETH/USD Coinbase Trading Plan. AI Prediction Apr 29, 2025 ETH/USD Trading Plan
Short-Term (24-48 Hours)
Long Entry : 1825 (Confirmed if price breaks 1830 with volume >6000).
SL : 1795 (10 points below support). TP: 1845 (just above resistance). Trailing Stop: 1.5% after TP1 (1845).
Short Entry : 1795 (Confirmed if price closes below 1800 with volume >5000).
SL : 1815 (10 points above entry). TP: 1760 (above 1750 support). Trailing Stop: 1.5% after TP1 (1760).
Long-Term (3-7 Days)
Long Entry : 1850 (Confirmed with daily close above 1840 + rising volume).
SL : 1820 (30 points below breakout). TP: 1900. Trailing Stop: 2% after price reaches 1900.
Short Entry : 1740 (Confirmed with daily close below 1750).
SL : 1765 (15 points above entry). TP: 1700. Trailing Stop: 2% after price hits 1700.
Re-Evaluate Forecasts If:
- Price stalls at key levels (1840 or 1750) for >6 hours without momentum.
- Volume drops sharply during a breakout/breakdown.
- External catalysts (news, macros) emerge.
Confirmation Tools:
Volume spikes (>6000 for longs, >5000 for shorts), candlestick reversals (hammer/shooting star), and consolidation breaks.
Disclaimer: This is not financial advice. Crypto markets are highly volatile and speculative. Always do your own research and consult a qualified financial advisor before investing. You could lose your entire investment.

ORCL - Weekly - The PlayClick Here🖱️ and scroll down👇 for the technicals, and more behind this analysis!!!
________________________________________________________
________________________________________________________
..........✋NFA👍..........
📈Technical/Fundamental/Target Standpoint⬅️
1.) The most recent two earnings reports came in slightly below expectations, but not enough to warrant a significant sell-off reaction.
2.) Annually, the company has shown consistent revenue growth since 2019 and net income growth since 2020.
3.) Its financial health has been in good standing and has remained so since 2019.
4.) Market manipulation has been apparent since March 24, 2025, which leads me to believe that Oracle's true value is closer to $148.
5.) My analysis suggests that the earnings report on June 17, 2025, will be a positive surprise, potentially resulting in a short squeeze if there isn't a significant run-up in price before the announcement.
==============================
...🎉🎉🎉Before You Go🎉🎉🎉…
==============================
Leave a like👍 and/or comment💬.
We appreciate and value everyone's feedback!
- RoninAITrader

NQ1! High Resistance Liquidity Run Market ProfileCME_MINI:NQ1!
Wanted to short NQ for daily FVG . Unable to get the draw after the displacement. Took two stops and stayed side lines for the rest of the day

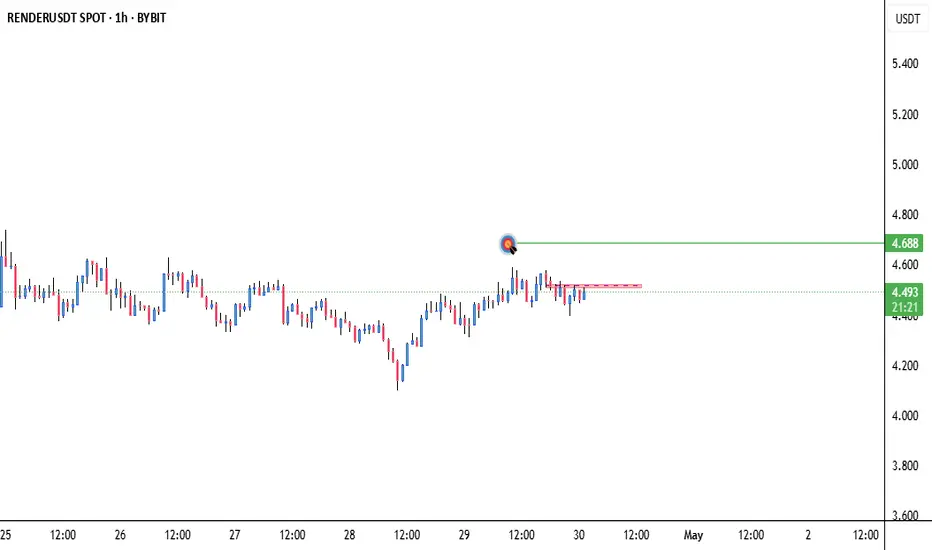
RENDER Testing Red Resistance Zone🚨 RENDER Testing Red Resistance Zone 🚨
RENDER is currently testing a significant red resistance zone. A breakout above this level could signal a bullish move, with the target set at the green line level.
📈 Technical Overview:
Resistance Zone: Red area currently being tested.
🎯 Breakout Target: Green line level upon confirmation.
What is gold waiting for? Stuck in the 3300 area⭐️GOLDEN INFORMATION:
Gold price (XAU/USD) fails to build on Monday’s rebound from the key $3,265–$3,260 support zone, encountering renewed selling pressure during the Asian session on Tuesday. Although signals from the US and China remain mixed, investor sentiment remains buoyed by hopes of a potential easing in trade tensions between the world’s two largest economies. Additionally, signs of advancement in tariff negotiations have further bolstered optimism, dampening the appeal of the safe-haven metal.
⭐️Personal comments NOVA:
Gold price needs to be boosted by economic news to break out of the sideways price range around 3300, continue to wait today around 3300
⭐️SET UP GOLD PRICE:
🔥SELL GOLD zone : 3366- 3368 SL 3373
TP1: $3350
TP2: $3340
TP3: $3330
🔥BUY GOLD zone: $3267 - $3265 SL $3260
TP1: $3280
TP2: $3300
TP3: $3318
🔥BUY GOLD zone: $3301 - $3299 SL $3296 scalping
TP1: $3305
TP2: $3310
TP3: $3320
⭐️Technical analysis:
Based on technical indicators EMA 34, EMA89 and support resistance areas to set up a reasonable SELL order.
⭐️NOTE:
Note: Nova wishes traders to manage their capital well
- take the number of lots that match your capital
- Takeprofit equal to 4-6% of capital account
- Stoplose equal to 2-3% of capital account

Trade talks improve and confidence returns🔔🔔🔔 Gold news:
➡️ Gold prices declined as improved risk sentiment weakened demand for safe-haven assets. Optimistic U.S. macroeconomic data released on Thursday supported the USD, limiting gains for the precious metal.
➡️ On Friday, the U.S. dollar showed signs of recovery as market sentiment remained upbeat due to positive developments in trade negotiations. According to Reuters, the Trump administration appeared to be making progress in preliminary trade talks with Asian allies South Korea and Japan.
Personal opinion:
➡️ The sellers are gaining the upper hand thanks to optimistic news, and the buyers are resting due to little news affecting the upward momentum of gold prices.
The analysis is based on resistance - support levels and Pivot points combined with EMA to come up with a suitable strategy.
Personal plan:
🔆Price Zone Setup:
👉Buy Gold 3281 - 3284
❌SL: 3277 | ✅TP: 3289 - 3294 – 3300
👉Sell Gold 3369 - 3372
❌SL: 3377 | ✅TP: 3365 - 3360 – 3355
FM wishes you a successful trading day 💰💰💰

Testing Purple Resistance Zone 🚨 CRYPTOCAP:XRP Testing Purple Resistance Zone 🚨
CRYPTOCAP:XRP is currently testing a significant purple resistance zone. A breakout above this level could signal a bullish move, with the first target at the green line level. Keep an eye on the price action for confirmation.
📈 Technical Overview:
Resistance Zone: Purple area currently being tested.
🎯 Breakout Target: Green line level upon confirmation.

Bullish Price Delivery on MESIn this week's analysis of the ES futures contract, it still looks reasonable to expect bullish price action.
Given the price delivery over the past few weeks, it appears that large institutions are continuing to push the market higher — a strong signal to maintain a bullish bias!
Key levels I'm watching:
Bullish target: 5,590 (with potential for even higher moves)
Support zones:
First support around 5,497
Stronger support around 5,447 in a worst-case scenario
While it's important to recognize that we may be approaching a "high" within the larger downtrend, from a short-term perspective (this week), I expect these support levels to hold and for bullish momentum to continue.
Of course, as with all speculation, we’ll monitor closely and react accordingly — always studying price action one candlestick at a time!

$USD Breaks Down – “Mission Accomplished” or Just Getting📉 The US Dollar Index ( AMEX:USD / TVC:DXY / $USINDEX) has officially broken beneath the multi-year support zone from 2020, right as Trump prepares to declare "Mission Accomplished".
From Inauguration to Liberation Day, and now the final stage: Meltdown.
🧭 Key Events Marked:
🟥 Inauguration
🟥 Trade War
🟥 Liberation Day
🟩 Mission Accomplished
🔻 Meltdown incoming?
📊 The breakdown aligns with a sharp spike in Nasdaq down volume (see chart). This isn't just a currency move — it's a market-wide stress signal.
Watch closely:
TVC:DXY below 99 = structural weakness.
Risk-on assets may melt up temporarily, but volatility could snap back fast.
Global currency pairs ( FX:EURUSD , FX:USDJPY , FX:GBPUSD ) are all on alert.

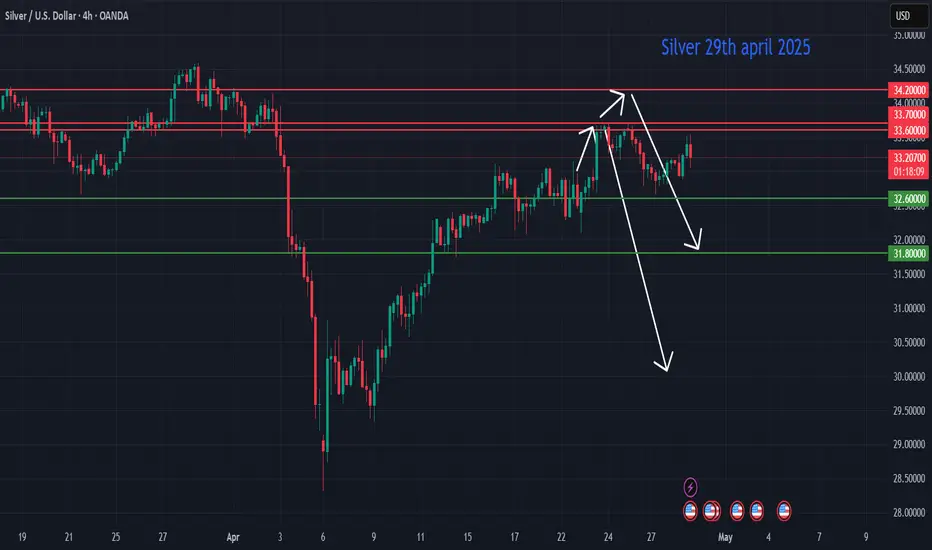
Silver Price Forecast Update (April 29, 2025): Eyeing Fresh SellSilver Price Forecast Update (April 29, 2025): Eyeing Fresh Sell Opportunities Near $34.20
Following our earlier forecast on April 22, 2025 — where we highlighted a retest and potential reversal at the $33.60 level, which was successfully fulfilled — we now turn our attention to the next critical price region. As price action unfolds, I will be closely monitoring the $34.20 area for potential short (sell) setups, contingent on price behavior and broader market confirmation.
🔍 Technical Outlook
Resistance Zone at $34.00–$34.20: This area has previously acted as a strong resistance zone, marking a significant swing high from March 2024. A confluence of Fibonacci extensions (specifically the 127.2% extension from the January–March leg) also aligns here.
Bearish Divergence on RSI (4H and Daily): As silver approaches $34.20, momentum indicators are beginning to show early signs of bearish divergence, suggesting that upside strength may be waning.
Rising Channel Breakdown in Sight: Price remains within an ascending channel since mid-March, but a test and failure near $34.20 could trigger a breakdown, targeting support at $32.60 and potentially $31.80 in extension.
🏦 Fundamental Drivers to Watch
Fed Policy Outlook: Recent Fed commentary continues to lean hawkish, with inflation data remaining sticky. The possibility of delayed rate cuts is strengthening the U.S. dollar and raising real yields — both traditionally bearish factors for silver.
Geopolitical Uncertainty & Safe Haven Flows: On the flip side, ongoing geopolitical tensions in Eastern Europe and the Middle East are contributing to periodic safe haven bids for precious metals. However, these flows have largely benefited gold more than silver in recent sessions.
Industrial Demand Concerns: Slowing global manufacturing PMI readings — especially from China and Germany — are raising concerns about silver’s industrial demand side. This could weigh on the metal in the coming weeks if macroeconomic softness persists.
📈 Trade Plan
I will be closely watching for bearish confirmation patterns near the $34.00–$34.20 resistance zone, such as:
Rejection wicks on the 4H/daily timeframe
Bearish engulfing or pin bar formations
Breakdown below local support levels near $33.50
If confirmed, I will consider initiating short positions, with targets around:
First Target: $32.60
Second Target: $31.80
Stop-Loss: Above $34.50 (structure-based)
📝 Conclusion: While silver continues to enjoy broad bullish momentum, technical resistance at $34.20 could serve as a turning point. Combined with shifting macroeconomic narratives, this level offers a high-reward zone to look for potential reversal and short opportunities, provided the right confirmation signals develop.
Stay tuned — I’ll provide further updates as price action evolves.
Clear Lower range to higher rangeNo real resistance for ETH till Golden pocket. Monthly close around corner.

Last Struggle before ATHWith price hovering around Yearly open, next draw on Liquidity is around 140000

AUDUSD Is Showing Bullish PotentialA break above 0.6403 opens the door for a potential long entry, with a target above 0.6439. This setup becomes invalid if price drops below 0.6375.

Palladium Strengthens: Technical and Fundamental Support UpsidePalladium is currently trading above the key global support level at 900. Yesterday saw a decent rally followed by a pullback. The overall price action remains constructive, with higher lows forming consistently.
From a fundamental standpoint, palladium and platinum should ideally trade at parity. At present, palladium is undervalued by approximately 4% relative to platinum and considering various factors — including how the DXY is trading and the overall market sentiment — I believe palladium is likely to catch up.
I’m bullish on palladium and believe the odds of further upside are high.
