Russell 2000: Looking Past the Short-term VolatilityCME: Micro E-Mini Russell 2000 Index Futures ( CME_MINI:M2K1! )
On Saturday, May 3rd, Warren Buffett took the center stage of the Berkshire Hathaway annual shareholder meeting. “What has happened in the last 30, 45 days … is really nothing,” declared the “Oracle of Omaha”.
Buffett brushed off recent stock market volatility that has rattled investors over the past weeks. “This has not been a dramatic bear market or anything of the sort,” he said.
In April, U.S. stock market took a deep dive after the start of Reciprocal Tariff against all U.S. trading partners. A few days later, we witnessed spectacular rally with a record daily gain, as a 90-day tariff pause was announced. On May 2nd, the S&P 500 completed a 9-day winning streak, the longest in 20 years.
After a month-long rollercoaster ride, the U.S. stock market is back to where it started. If an investor bought stocks in the beginning of April and then slept for the whole month, he wakes up today and may not even notice any changes in his portfolio.
Sunny Days ahead after the Storm
I concur with Buffet’s assessment that the U.S. economy is fundamentally strong. The supply chain disruptions are painful and will lead to product shortage, higher prices and layoffs in affected industries. However, trade conflicts will be resolved in a few months. The U.S. will be in a strengthening position, making its economy more sustainable.
The U.S. economy contracted 0.3% in Q1 2025, the first negative reading since 2022, according to the Commerce Department. However, the underlying data is much better if you look past the headline.
The formula: GDP = C + I + G + (X - M), where:
• C is consumer spending; I is investment by private business
• G is government spending; (X-M) is the net of exports minus imports
The key driver of the negative GDP is Imports. US buyers front-run the tariffs with massive orders, resulting in a 41.3% increase in imports. We also see a 21.9% gain in investment, primarily the result of US businesses building up inventory with imported goods.
• Imports and Investment contribute -4.83% and +3.6% to Q1 GDP, respectively. Both are one-time events and should not be taken as a long-term trend.
• Consumer spending grew 1.8% in Q1, contributing to 1.21% of GDP. Government spending contracted 1.4% in Q1, contributing to -0.25% of GDP.
Real Story: Q1 constant dollar GDP is +3.5%. By using a price deflator of 3.7%, the government reports a -0.3% “Real GDP at seasonally adjusted annual rates.”
Separately, the Bureau of Labor Statistics (“BLS”) reported that total nonfarm payroll employment increased by 177,000 in April, beating market expectations. The April unemployment rate was 4.2%, in line with expectations.
The above data supports my assessment of a solid U.S. economy. Once we walk past the tariff fear, the stock market will likely resume its growth.
Small Firms May Benefit More from New Trade Policies
A global supply chain helps corporate giants source from the most efficient and lowest cost suppliers. Small businesses may not be so lucky. Take the US textile industry as an example, the BLS data shows that 80% of domestic jobs have been lost since 2000.
The "de minimis" exemption is an import loophole that allows overseas packages under $800 to come into the U.S. duty-free. According to BLS data, e-commerce giants like Amazon, Shein and Temu source 80-90% of their products from overseas.
Closing the "de minimis" loophole and enacting fairer trade deals will help domestic manufacturers. By shielding from low-cost import dumping, a revitalized US manufacturing industry may not be far fetching.
Of the four major US market index, Russell 2000 performed the worst, flat in the last twelve months. Based on my analysis above, the Small Cap Russell index may have a better growth outlook compared to blue-chip indices.
Trade Setup with CME Micro E-Mini Russell 2000 Index Futures
Traders who take a bullish view in Small Cap could buy the Micro Russell Futures (M2K).
M2K contracts have a notional value of $5 times the index value. With Friday settlement price of $2042.70, each September contract (M2KU5) has a notional value of $10,213.5. Buying or selling one contract requires an initial margin of $932 at the time of writing.
The reason for selecting the September contract rather than the more liquid June contract is the time it takes to negotiate trade deals. While some trading partners may reach agreement within the 90-day window, others may not.
Micro Russell futures (M2K, $5) contracts tap into the deep liquidity of E-Mini Russell futures contracts (RTY, $50). As of last Friday, RTY has an open interest (OI) of 457,283 contracts, while the OI for M2K is 41,563, according to data from CME Group.
The risk of long Russell futures is a decline in the index. To hedge against the downside risk, a trader could set up a stop-loss in his buy order.
Hypothetically, a trader enters a buy order of M2KU5 at $2050 with a stoploss at $1950.
• If the Russell goes up 10% to 2,255, the trade will gain $1,025 (= (2255-2050) * 5). The theoretical return is 110% (= 1025/932). This is 10 times bigger than the gain in the underlying index, thanks to the leverage built into the futures contracts
• If the Russell falls 10% to 1,845, the maximum loss with be $500 (= (2050-1950) * 5). This is less than the initial margin of $932 and the trader will not face a margin call. The loss is limited even if your view is incorrect, thanks to the stoploss feature
Happy Trading.
Disclaimers
*Trade ideas cited above are for illustration only, as an integral part of a case study to demonstrate the fundamental concepts in risk management under the market scenarios being discussed. They shall not be construed as investment recommendations or advice. Nor are they used to promote any specific products, or services.
CME Real-time Market Data help identify trading set-ups and express my market views. If you have futures in your trading portfolio, you can check out on CME Group data plans available that suit your trading needs www.tradingview.com
Beyond Technical Analysis

Gold Daily Sniper Plan - XAUUSD May 5th 💥 May 5 XAUUSD Sniper Plan – "Bulls Bounce, Bears Breathe – Who Takes the Next Shot?" 🎯📉
Gold is caught in a battlefield. After a textbook bounce from 3204, price is pushing into premium zones — but momentum is limping, and ISM Services PMI (4:00pm) could trigger the next major move.
Forget guessing. This is where levels speak louder than noise.
🧭 Market Overview
HTF Bias (D1–H4): Bullish macro trend, but pullback in play after rejection from 3500 ATH
LTF Flow (H1–M15): Bullish relief structure, but losing steam below key supply at 3315+
EMA Confluence (H1): EMA5 climbing above EMA21, but flat near 3260 — indecision zone
Liquidity: Sell-side liquidity rests below 3200. Buy stops are stacking above 3300.
🔥 Monday News Catalyst
🕔 4:00pm ISM Services PMI (USD)
Volatility expected. Strong data = dollar strength = possible Gold drop. Weak data = relief rally toward premium.
🎯 Sniper Entry Zones (With Logic)
🔻 Sell #1 – 3315–3325
📍 H1–H4 OB + FVG + equal highs above
🧠 Ideal for post-ISM spike rejection setup
🔻 Sell #2 – 3345–3355
📍 Final OB before last lower high + clean imbalance
🎯 SL: 3360 | TP1: 3315 | TP2: 3292 | TP3: 3268
🧠 Swing rejection setup if bulls overextend
🟢 Buy #1 – 3210–3220
📍 M15 OB + EQ + May 2 internal HL
🎯 SL: 3190 | TP1: 3244 | TP2: 3265 | TP3: 3290
🧠 Structure-based bounce zone with clean PA reaction
🟢 Buy #2 – 3175–3185
📍 LTF demand + FVG + RSI oversold sweep
🎯 SL: 3155 | TP1: 3210 | TP2: 3240 | TP3: 3268
🧠 Reactive area if NY flushes price before recovery
🗺 Key Levels to Watch
Level Meaning
3268–3275 Internal resistance + imbalance zone
3292–3300 Liquidity magnet pre-sell zone
3315–3325 Major rejection area
3345–3355 HTF supply & final trap
3210–3220 Primary bounce zone
3175–3185 Trap setup + liquidity sweep zone
3050–3075 HTF OB → swing buy only
👁🗨 Eyes On:
Rejection from 3315 = sniper short entry zone
Rejection from 3275 = continuation risk
Break below 3210 → 3175–3185 becomes critical
Weak ISM = gold spike toward 3300+ (fade setup)
💬 Final Thought:
This isn’t “buy now, sell now” nonsense. It’s about structure, timing, and logic.
The cleanest setups come to those who wait — not those who chase.
🙏 Like this breakdown? Boost and follow us for sniper setups all week.
📌 Important Notice!!!
The above analysis is for educational purposes only and does not constitute financial advice. Always compare with your plan and wait for confirmation before taking action.

EUR/USD Outlook: Sweep, FVG, and Breakdown — 1.0800 Next?EUR/USD Weekly Forecast
After a major and minor sweep near 1.1150, EUR/USD closed two consecutive bearish weeks, signaling a clear shift in momentum. Last week also confirmed a change of character, creating liquidity around 1.1270 and forming a daily Fair Value Gap at 1.1370, which has now been filled.
We expect the week to open bearish, targeting:
• 1.0900 (first liquidity zone)
• 1.0800 (main demand/discount area)
• Possibly even 1.0600 (extreme swing level) if momentum continues
Bias: Bearish
Key Zones:
• Resistance / FVG: 1.1370
• Target 1: 1.0900
• Target 2: 1.0800
• Extreme: 1.0600
Momentum is with the dollar, and EUR/USD still has room to drop toward the deeper demand areas.
—
Weekly forecast by Sphinx Trading
What’s your bias this week?
#EURUSD #ForexForecast #SmartMoney #LiquiditySweep #FVG #TechnicalAnalysis #SphinxWeekly #PriceAction

Crude Oil Outlook and Trading Tips for Next WeekThe expected production increase by OPEC+, trade concerns triggered by Trump, and the risk aversion sentiment in the global economy dominate the price trend of crude oil. On Saturday, OPEC+ confirmed a production increase of 411,000 barrels per day in June, intensifying concerns about oversupply. Technically, the bearish trend dominates the crude oil market. Due to the low liquidity in the Asian market caused by holidays next Monday, the oil price is likely to fluctuate significantly.
Last week, crude oil continued to decline and closed with a large bearish candlestick on the weekly chart. Next week, the focus is on whether the oil price will break below the previous double-bottom support. In the short term, the oil price has been fluctuating within a range. Currently, it is under pressure and adjusting around $64.88 per barrel, and there are signs of it encountering resistance for the second time around the $60.2 resistance level.
In conclusion, it is highly probable that crude oil will continue to be under pressure. On Monday, it is advisable to mainly consider shorting on rebounds and supplement with going long at low levels. Pay attention to the resistance levels of $59.3 - $60.3 per barrel on the upside and the support levels of $57.7 - $56.3 per barrel on the downside.
USOIL
sell@59.5-59.20
tp:58.00-57.50
Investment itself is not risky; it is only when investment is out of control that risks occur. When trading, always remember not to act on impulse. I will share trading signals every day. All the signals have been accurate without any mistakes for a whole month. No matter what gains or losses you've had in the past, with my help, you have the hope of achieving a breakthrough in your investment.

SPY Holding the Channel – Can It Bounce or Fade Today?Market Summary
SPY is currently trading around $563, showing early weakness after stalling below key resistance at 566–567 last week. Futures were flat overnight with mixed macro sentiment and low volatility. We're starting today near the lower trendline of the rising channel visible on the 15-minute chart.
Technical Structure
* Trend: Price is still holding the lower boundary of the upward channel from May 1–2.
* Support: ORL at 564.29 and lower trendline ~563.20–563.40.
* Resistance: ORH at 565.47, PMH at 565.95, and GEX resistance at 567.
* Indicators:
* MACD: Flattening with bearish cross on shorter timeframes.
* Stoch RSI: Reset to lower range, watching for potential curl up.
Options & Gamma Insight (GEX)
* Current Price: $563
* PUT Pressure Dominant: GEX sentiment is 🔴🔴🔴 Bearish, with:
* PUT$ flow = 115.6% (significantly overweighted)
* IVR 26.1, IVx avg 20.4 = Still room to expand in volatility.
* Key Gamma Levels:
* Resistance Walls:
* 567 → 2nd CALL Wall (major resistance)
* 568–570 → CALL resistance zone
* Support Zones:
* 562–561 → Heavy GEX support
* 560 → Highest negative net GEX = strong PUT wall
Potential Scenarios for Today
🟢 Bullish Case:
* Price reclaims ORH 565.47 and breaks above 566, triggering momentum to test 567.
* If momentum continues, squeeze toward 568 or even 570 is possible, but less likely unless volume spikes.
🔴 Bearish Case:
* Break below 562.68 Ask, triggering fast move to 561.70 and possibly flush into 560 PUT wall.
* Below 560 opens the door to 557 or even 554–555 if panic selling or negative macro.
Actionable Levels
* Long above: 565.50 with target 566.80–567 | Stop < 563.80
* Short below: 562.80 with target 561 → 560 zone | Stop > 564.50
* Scalp Range Zone: Between 563.50–565.50 = chop risk
Final Take
SPY is pinned between heavy PUT support at 560 and CALL resistance at 567. With PUTs outweighing CALLs, a flush toward 561–560 could be favored unless bulls reclaim 566+. Watch for sharp directional trigger around 10:00–10:30 AM ET.
📌 This preview is for educational purposes only. Always use proper risk management and confirm with your own system before trading.

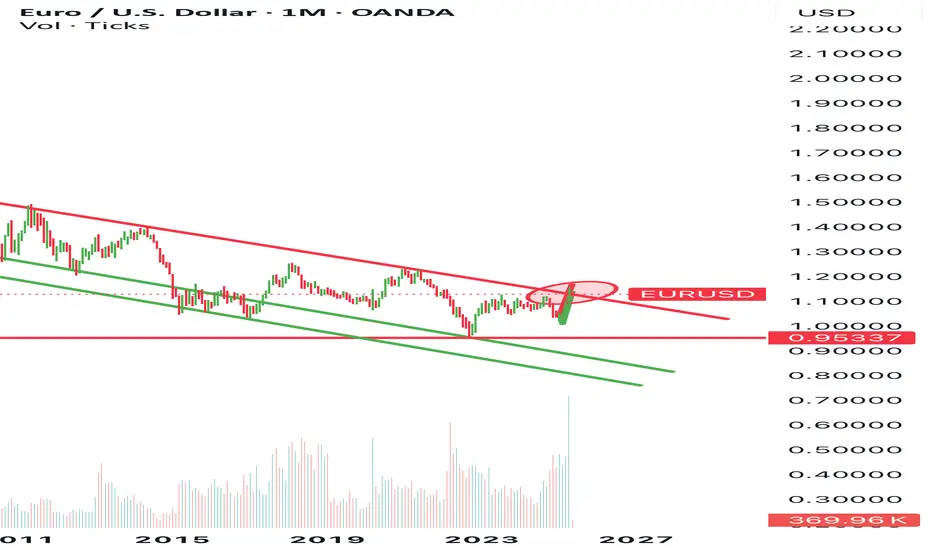
THE EUR/USD IS DROPPING! DONT MISS OUTI believe the EURUSD will drop SIGNIFICANTLY (to around 0.8). Here is why:
Europe’s economy is spiraling out of control. Manufacturing is contracting, with the latest PMI figures showing a disastrous 45.1—FAR FAR BELOW the 50 threshold that indicates growth. Energy prices are skyrocketing, businesses are struggling, and consumer confidence is plummeting. The European Central Bank (ECB) is in a state of desperation, resorting to crazy interest rates to salvage the economy, but its efforts are only making the euro less appealing to investors.
The ECB’s actions are signaling its desperation. Governing Council member Yannis Stournaras has already hinted at aggressive rate cuts throughout 2025, aiming to bring rates down to 2% by the end of the year. This move is a death sentence for the euro. Lower rates mean reduced demand for the currency, and investors are fleeing to safer assets. The ECB is essentially handing victory to the dollar on a silver platter.
While the euro is experiencing a significant decline, the U.S. dollar is experiencing a remarkable surge. The Federal Reserve is adopting a cautious approach to rate cuts, indicating that the U.S. still offers higher returns on investments, making the dollar far more attractive compared to the euro. So, investors are abandoning euros and hoarding dollars, accelerating the downward spiral of the euro’s value. Which would in turn make the EURUSD drop
Furthermore, the recent strength in the euro was merely a mirage, as history suggests that such rallies cannot endure. The underlying fundamentals are fundamentally flawed, with the U.S. economy outperforming Europe in terms of growth, innovation, and resilience. The euro’s rise was unsustainable, and now reality is crashing down upon it. The market is correcting, and the euro is plummeting.
Moreover, the bond markets are in turmoil. The U.S. bond market has been aggressively sold off, but China is ramping up its purchases of 10-year T-bills. This influx of capital into the U.S. is further strengthening the dollar, making it difficult for the euro to compete with the demand for U.S. assets.
Additionally, the uncertainty surrounding the trade war between the U.S. and China has shaken global markets. Investors are panicking and seeking safe havens, but the euro is not one of them. The uncertainty surrounding U.S.-China trade relations is driving capital into the dollar, leaving the euro to deteriorate further.
Lastly, my technical analysis suggests that the EUR/USD is in freefall. The pair began 2023 on a rocky path, dropping 0.8% on the first trading day of the year. It has broken key support levels, and traders are rapidly turning bearish. I am expecting a catastrophic crash for the euro based on trendlines, RSI levels and more from the monthly charts, weekly, daily, and even the 4H. No matter what chart you use they all suggest the same idea. The EURUSD will drop.
So I’m shorting. If I am wrong then what the EURUSD has been doing for the past 17 years is about to somehow change, and the news is wrong, the charts wouldn’t add up etc. in that crazy scenario, sure the EURUSD may rise a bit but let me tell you guys.. I am so sure of this, more sure than any other trade. Do your own research and don’t just blindly believe me, but I will be shorting.
Dollar Decline Against All Major CurrenciesThe Dollar’s decline didn’t start with the recent ‘Liberation Day’ tariffs. In fact, it has been gradually weakening since the 1970s.
More recently, however, the Dollar has lost value against many currencies since January. Why is that?
Why have the USD/CHF and USD/SGD strengthened against the US Dollar over the past few decades? One reason is that both countries have managed their money supply with discipline. For example, as of end-2024, Switzerland’s net federal debt stood at 141 billion Swiss franc, their debt to GDP ratio at 17.2%.
In contrast, the United States has expanded its national debt at an alarming rate. Some might point out that Japan’s debt-to-GDP ratio is even higher—around 230%. That is why the Japanese Yen has also been in decline for decades.
Why does printing more money through QE and increasing the money supply weaken a currency?
Just imagine in a close economy with 10 people and 1 central bank. If the central bank printed $100 and distributed equally to the 10, each of them will receive $10 to buy 10 available cheesecakes.
But now the central bank decided to print $1,000 and each person will have $100 to buy 10 available cheesecakes.
The global economy is not a close, but an open system.
When the US and other major economies printed massive amounts of money, they didn’t just inflate their own economies—they exported inflation worldwide. This contributes to rising cost of living not all around the world.
In my view, Gold is also a currency pair against the US at the start of 1971. The moment dollar unpeg itself from gold, gold appreciates. With each QE, we can see how the currencies have diluted with gold and inflation appreciating over these years.
Why different currencies have started to appreciate against the USD since January this year?
We can see all the currencies have either reached its bottomed in January and started moving higher or it formed a reversal pattern like the Aussie dollar and the Dollar Yuan, in this case with this inverted hammer, it is indicating Dollar Yuan to reverse downward, meaning dollar coming off and yuan to appreciate.
January was President Trump inauguration and February was when he rolled out tariffs against Canada, Mexico and China, and the market do not like that and has been selling the USD against the rest of the currencies?
If US has printed the so much money, but why other than Swiss franc and Singapore Dollar, many other currencies have been depreciating against dollars over the past decades?
I’d like to hear your thoughts on this.
Euro FX Futures & Options
Ticker: 6E
Minimum fluctuation:
0.000050 per Euro increment = $6.25
Disclaimer:
• What presented here is not a recommendation, please consult your licensed broker.
• Our mission is to create lateral thinking skills for every investor and trader, knowing when to take a calculated risk with market uncertainty and a bolder risk when opportunity arises.
CME Real-time Market Data help identify trading set-ups in real-time and express my market views. If you have futures in your trading portfolio, you can check out on CME Group data plans available that suit your trading needs www.tradingview.com
Trading the Micro: www.cmegroup.com

sell,buy,sell!Hello all. 2 LOZs are waiting for their reactions, but which one is first? I think market will go down and then break the high and at the end will collapse. Lets see what will happen.
The second Scenario is to go down straightly. be happy (wink)

Breakout trading point: 1861.57
Hello, traders.
If you "Follow", you can always get new information quickly.
Please click "Boost" as well.
Have a nice day today.
-------------------------------------
(ETHUSDT 1D chart)
The 1861.57 point is the HA-Low indicator point on the 1W chart.
The key is whether it can receive support and rise around the A section, that is, 1861.57.
Since the HA-Low indicator on the 1D chart is formed at the 1647.06 point, it is important whether it can receive support and rise in the 1647.06-1861.57 section.
If it shows support in the 1647.06-1861.57 section, it is a time to buy.
-
If it falls from 1647.06, there is a possibility that a stepwise downtrend will continue, so you should also consider a response plan for this.
In the case of a decline, the Fibonacci ratio section of 0 (1190.57) ~ 0.786 (1259.39) is expected to be an important support and resistance section.
-
Since the price is located below the M-Signal indicator on the 1M chart, it is recommended to conduct trading from a day trading or short-term trading perspective.
When it breaks through the 1861.57 point, a breakout trade is possible, but as I mentioned earlier, trading requires a short and quick response.
-
If the StochRSI indicator is above the midpoint, it is recommended to focus on finding a time to sell, and if it is below the midpoint, it is recommended to focus on finding a time to buy.
When creating a trading strategy by referring to the movement of these auxiliary indicators, you must check whether there is support at the support and resistance points drawn on the 1M, 1W, and 1D charts.
-
Thank you for reading to the end.
I hope you have a successful trade.
--------------------------------------------------
- Here is an explanation of the big picture.
I used TradingView's INDEX chart to check the entire range of BTC.
I rewrote the previous chart to update it while touching the Fibonacci ratio range of 1.902 (101875.70) ~ 2 (106275.10).
(Previous BTCUSD 12M chart)
Looking at the big picture, it seems to have been maintaining an upward trend following a pattern since 2015.
In other words, it is a pattern that maintains a 3-year bull market and faces a 1-year bear market.
Accordingly, the upward trend is expected to continue until 2025.
-
(Current BTCUSD 12M chart)
Based on the currently written Fibonacci ratio, it is displayed up to 3.618 (178910.15).
It is expected that it will not fall again below the Fibonacci ratio of 0.618 (44234.54).
(BTCUSDT 12M chart)
Based on the BTCUSDT chart, I think it is around 42283.58.
-
I will explain it again with the BTCUSD chart.
The Fibonacci ratio ranges marked in the green boxes, 1.902 (101875.70) ~ 2 (106275.10) and 3 (151166.97) ~ 3.14 (157451.83), are expected to be important support and resistance ranges.
In other words, it seems likely that they will act as volume profile ranges.
Therefore, in order to break through these ranges upward, I think the point to watch is whether they can receive support and rise near the Fibonacci ratios of 1.618 (89126.41) and 2.618 (134018.28).
Therefore, the maximum rising range in 2025 is expected to be the 3 (151166.97) ~ 3.14 (157451.83) range.
In order to do that, we need to see if it is supported and rises near 2.618 (134018.28).
If it falls after the bull market in 2025, we don't know how far it will fall, but based on the previous decline, we expect it to fall by about -60% to -70%.
Therefore, if it starts to fall near the Fibonacci ratio 3.14 (157451.83), it seems likely that it will fall to around Fibonacci 0.618 (44234.54).
I will explain more details when the bear market starts.
------------------------------------------------------

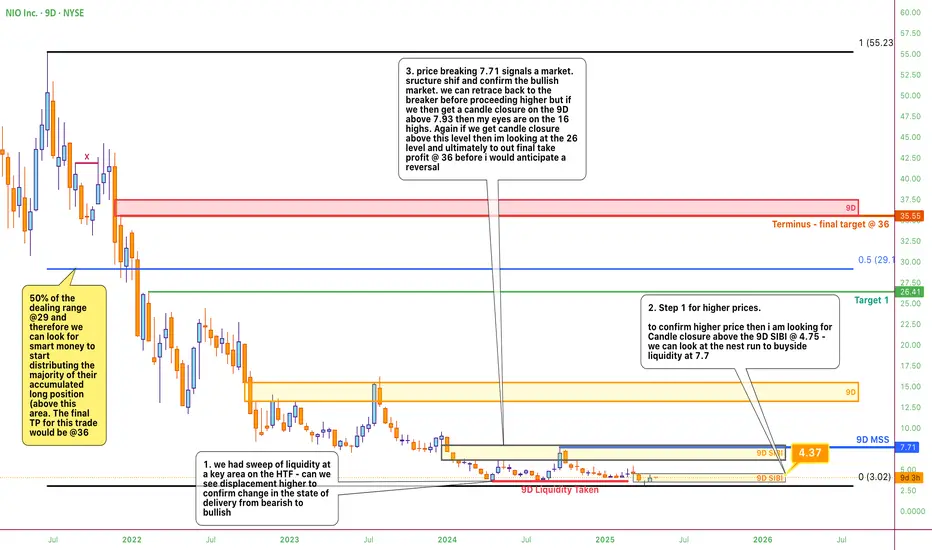
NIO - Beyond the confusion, the road to success is clear this simple charts aims to simplify what to look for in higher NIO prices.
NFLX: Bearish Reversal Setup - Macro Pressure & Volume Gap Risk🕒 15 min & Daily Charts | 📅 May 5, 2025
Ticker: NASDAQ:NFLX
Netflix (NFLX) is flashing warning signs after a steep rally from the April lows. Price action has now rejected the $1,150–$1,155 zone, confirming a local top with divergence and bearish engulfing on the daily. On the 15-minute chart, we see clear Fibonacci levels being respected with a break below 0.382 followed by a rejection of the 0.236 zone.
🧠 Confluence of Bearish Factors:
Macro Headwind: Trump's proposed 100% tariff on foreign film production hits Netflix's cost model hard. This geopolitical risk could reduce margins (source: The Guardian, May 2025).
Volume Profile Analysis: Price is above a thin volume node with little support until the $1,000–$1,030 zone, increasing vulnerability to sharp drops.
Fibonacci Targets: Measured move from $1,151.68 → $1,107.08 gives downside Fibonacci extensions to:
🔻 1.236 – $1,094.76
🔻 1.382 – $1,087.13
🔻 1.786 – $1,066.04
🔻 2.0 – $1,054.85
Daily Rejection Candle: Today's -1.74% bearish candle completes a rising wedge breakdown.
🎯 30-Day Probabilistic Outlook:
🟢 Bull Case: $1,290 (20% probability, if tariffs fail or are watered down)
🟡 Base Case: $1,066.58 (50% probability – Fib target + volume support)
🔴 Bear Case: $979.59 or lower (30% probability – volume gap fill and macro fear)
💡 Playbook:
Intraday scalpers can short retests of $1,143–$1,146 (golden pocket).
Swing traders can target $1,066 and trail with 3-bar structure.
Add-on confirmation with VIX > 18 and Fed staying hawkish on May 7th.
📌 Not financial advice. For institutional and strategic educational use under the Wavervanir DSS framework.
#NFLX #ShortSetup #Fibonacci #MacroTrading #VolumeProfile #BearishReversal #WavervanirDSS #TradingView #AITrading

Nifty Outlook for next weekNSE:NIFTY1!
Expecting a meltdown on Nifty for the next week, then a rapid push up towards the Buyside

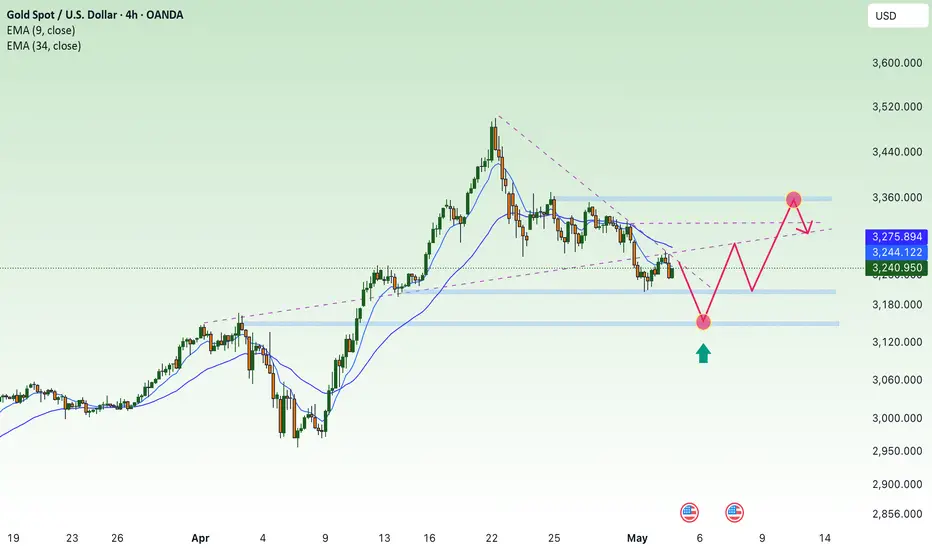
Lack of bullish momentum, gold price waits, slight decrease✍️ NOVA hello everyone, Let's comment on gold price next week from 05/05/2025 - 05/09/2025
🔥 World situation:
Gold (XAU/USD) slipped by more than 0.35% on Friday and is on track to close the week with a decline exceeding 2.5%, as easing trade tensions and upbeat US labor market data boosted investor risk appetite. This shift in sentiment encouraged profit-taking ahead of the weekend, weighing on the safe-haven asset. At last check, XAU/USD was trading around $3,226, pulling back from an intraday peak of $3,269.
Adding to the improved market mood, China’s Commerce Ministry confirmed that the US has shown a willingness to resume discussions on tariffs, while reiterating that Beijing remains open to dialogue.
🔥 Identify:
Gold price continues to adjust down, lacking momentum to increase price. around price range 3200 - 3350
🔥 Technically:
Based on the resistance and support areas of the gold price according to the H4 frame, NOVA identifies the important key areas as follows:
Resistance: $3285, $3316, $3355
Support : $3202, $3155
🔥 NOTE:
Note: Nova wishes traders to manage their capital well
- take the number of lots that match your capital
- Takeprofit equal to 4-6% of capital account
- Stoplose equal to 2-3% of capital account
- The winner is the one who sticks with the market the longest
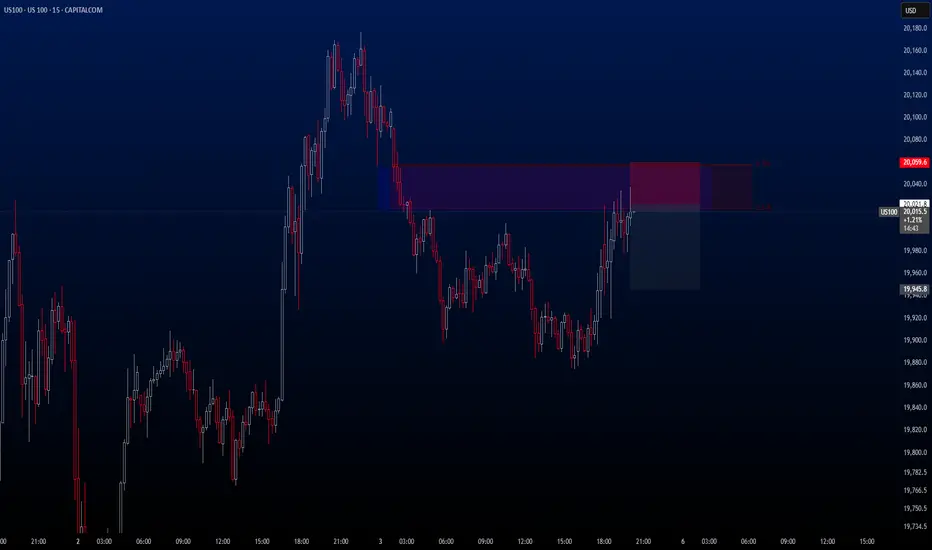
US100There’s a **Sell opportunity** forming on **US100**, but this one carries a bit more risk compared to the others.
That’s why I recommend opening the trade with a **smaller lot size** just for this setup.
🔍 **Criteria:**
✔️ Timeframe: 15M
✔️ Risk-to-Reward Ratio: 1:2
✔️ Trade Direction: Sell
✔️ Entry Price: 20021.8
✔️ Take Profit: 19945.8
✔️ Stop Loss: 20059.6
🔔 **Disclaimer:** This is not financial advice. It's a trade I’m taking based on my own system, shared purely for educational purposes.
📌 If you're also interested in systematic and data-driven trading strategies:
💡 Don’t forget to follow the page and subscribe to stay updated on future analyses.
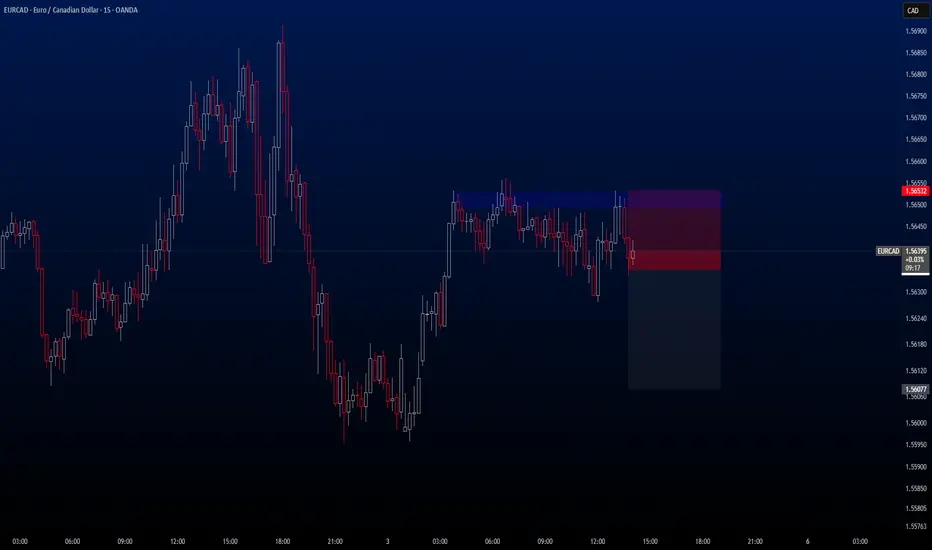
EURCADThere’s a solid opportunity for a sell trade on EURCAD. Although it's a relatively volatile pair, I'm planning to take the trade.
🔍 Criteria:
✔️ Timeframe: 15M
✔️ Risk-to-Reward Ratio: 1:1.50
✔️ Trade Direction: Sell
✔️ Entry Price: 1.56350
✔️ Take Profit: 1.56077
✔️ Stop Loss: 1.56532
🔔 Disclaimer: This is not financial advice. It's a trade I’m taking based on my own system, shared purely for educational purposes.
📌 If you're also interested in systematic and data-driven trading strategies:
💡 Don’t forget to follow the page and subscribe to stay updated on future analyses.
BTCUSDTHello everyone! The downtrend in BTCUSDT continues with strong volume. Since May 3rd, the bearish trend has remained intact, and the current delta rate stands at -45%.
This indicates that the downward momentum is likely to continue for a while.
Therefore, I’m planning to open a short position on BTCUSDT.
You can find the entry, exit, and TP levels below.
🔍 Criteria:
✔️ Timeframe: 15M
✔️ Risk-to-Reward Ratio: 1:1.50
✔️ Trade Direction: Sell
✔️ Entry Price: 94586.48
✔️ Take Profit: 94113.32
✔️ Stop Loss: 94902.08
🔔 Disclaimer: This is not financial advice. It's a trade I’m taking based on my own system, shared purely for educational purposes.
📌 If you're also interested in systematic and data-driven trading strategies:
💡 Don’t forget to follow the page and subscribe to stay updated on future analyses.

GBPJPY - 05.05.2025 - 09.05.2025GBPJPY - 05.05.2025 - 09.05.2025
Looking for short on GBPJPY this week

Ethereum Rebounds from Key Confluence Zone$ETH/USDT Weekly Chart Analysis
Ethereum is holding a major long-term uptrend as the price bounces off the ascending trendline support. This level also aligns with a strong historical resistance-turned-support zone, adding more confluence to the current bounce.
As long as ETH stays above this structure, it suggests a potential macro bullish continuation, with eyes on the upper resistance line near $3,200–$3,500.
A strong defense at this zone reinforces long-term bullish sentiment.

NAS100USD: SMT Divergence Hints at Potential ReversalGreetings Traders,
In today’s analysis of NAS100USD, although the current market structure reflects bearish institutional order flow, there are growing signs that a potential reversal may be forming.
Key Observations:
1. Smart Money Technique (SMT) Divergence:
We are currently observing SMT divergence—a strategy where the underlying asset (NAS100) is compared against its benchmark (US500). These indices typically maintain a 90–100% correlation. However, when this correlation breaks down, it often signals that a reversal may be imminent. In this case, while NAS100 continues to show bearish momentum, the divergence from US500 suggests the possibility of bullish interest building.
2. Institutional Support at the Rejection Block:
Further confluence for a potential reversal lies in the presence of a rejection block acting as a strong institutional support level. This is a zone where smart money previously defended price, and if confirmed, it could provide an optimal entry for long positions.
Trading Plan:
We will monitor the rejection block for confirmation of bullish intent before entering any trades. If confirmed, the idea is to target the buy-side liquidity residing in premium pricing zones.
Invalidation Level : This reversal idea will be invalidated if NAS500 breaks below its most recent swing low.
Stay alert for confirmation, and always ensure the idea fits within your broader trading framework.
Kind regards,
The Architect

BTCUSDTLooks like BTCUSDT wants to make us smile again 🙂 A new opportunity for a Sell signal has emerged, and I’ll be taking advantage of it. However, don’t forget that in 35 minutes**, the *U.S. Services Purchasing Managers' Index (PMI)* data will be released — and that could cause some market volatility. I’m opening the trade with that in mind, so make sure you adjust your risk accordingly.
🔍 Criteria:
✔️ Timeframe: 15M
✔️ Risk-to-Reward Ratio: 1:1.60
✔️ Trade Direction: Sell
✔️ Entry Price: 94333.33
✔️ Take Profit: 93908.54
✔️ Stop Loss: 94598.39
🔔 Disclaimer: This is not financial advice. It's a trade I’m taking based on my own system, shared purely for educational purposes.
📌 If you're also interested in systematic and data-driven trading strategies:
💡 Don’t forget to follow the page and subscribe to stay updated on future analyses."

XAUUSDthe BEARS are back in control with the bull having tested and resoected the trendline, sweeped the NY high and the M15 closed below the SUPPLY.

XAUUSD Bearish Setup: Rising Wedge Breakdown Towards 3,166 Targe Overview
This chart illustrates a high-probability bearish setup for XAUUSD based on the breakdown of a rising wedge pattern. Rising wedges typically signal a potential reversal or correction, especially when they occur near a resistance zone and are followed by lower highs and diminishing bullish momentum.
🔍 Technical Breakdown
📐 Rising Wedge Pattern
The price of gold has been rising within a narrowing wedge, forming higher highs and higher lows but within converging trendlines.
This structure generally suggests weakening bullish momentum, and a breakdown is often followed by sharp bearish movement.
The breakdown from the wedge is already starting to form, as price struggles to make new highs near resistance.
🟥 Resistance Level (~3,280 – 3,300)
This area has historically acted as a supply zone.
Recent candlestick wicks show clear rejection in this area, confirming the presence of strong selling pressure.
Price failed to break above this level convincingly, indicating buyers are losing control.
🟩 Support Level (~3,200 – 3,215)
This zone provided a short-term base before the wedge formation.
If the wedge breaks, price may retest this zone on the way down.
If broken, this support could flip into resistance during a pullback.
🎯 Trade Setup
Bias: Bearish
Pattern: Rising Wedge
Timeframe: Suitable for short-term to swing trades (1H – 4H)
✅ Entry Point
Enter short on confirmation of a wedge breakdown (strong bearish candle close below the lower trendline).
Conservative traders can wait for a retest of the broken trendline for additional confirmation.
📉 Target
Primary Target: 3,166.10 – Measured move from wedge height and also aligns with a previous support area.
This area could act as a profit-taking zone as it represents both technical and psychological support.
🛑 Stop Loss
Place SL above the wedge resistance, around 3,313.69.
This protects against false breakouts or unexpected bullish reversals.
⚠️ Risk Management
Only risk a small percentage of capital (1–2%) per trade.
Ensure confirmation before entry – avoid entering early on low-volume breakdowns.
Consider scaling out partial profits near the support zone before the full target is hit.
🔧 Confluence & Validation
The setup aligns with basic price action principles: lower highs at resistance and exhaustion of bullish momentum.
Volume tends to drop during wedge formation and pick up during breakout – monitor volume for confirmation.
RSI or MACD divergence may further validate the bearish momentum.
🏷️ Conclusion
This rising wedge on XAUUSD presents a textbook short setup with a favorable risk-to-reward ratio. The structure, resistance zone, and loss of momentum indicate a potential shift to the downside. Traders should watch for confirmation before entering and use disciplined stop-loss management.

ALT COIN SEASON IS JUST WEEKS AWAY, HOPE YOU HAVE YOUR BAGS FULLHey Traders,
We’ve been watching this Bitcoin Dominance (BTC.D) chart closely — and it’s heating up again!
For those unfamiliar, BTC Dominance tracks the percentage of total crypto market cap that belongs to Bitcoin. When BTC.D rises, it typically means altcoins are underperforming compared to BTC — either due to their market caps falling, or BTC’s increasing. When it drops, altcoins are gaining ground.
While this chart won’t tell you whether markets go up or down, it’s critical for spotting where to diversify and when. It’s a must-have tool in your crypto trading utility belt.
⸻
Why This Chart Matters Now:
We’re nearing the top resistance trendline of a long-term triangle formation that dates all the way back to 2017. This line has rejected BTC.D multiple times in the past — and we’re back to test it again, hovering between 63% and 66% dominance.
Each of these rejections previously led to a drop in BTC Dominance — which triggered powerful altcoin seasons.
⸻
Key Bearish Signals:
• Bearish Divergence on the MACD
• MAJOR Bearish Divergence on the RSI
(Just like before previous alt seasons!)
• TOTAL2 (the white line representing all altcoins) looks poised to spike if history repeats.
Altseason Clue: When BTC.D forms bearish divergences on these indicators, it’s often followed by a surge in altcoin market cap — a key early signal we may be close to another one.
⸻
BUT… This Isn’t 2021 Anymore:
Let’s be real — the market has changed. Solana-based launchpads like Pump.fun and Jupiter DEX have revolutionized how easily tokens are created and traded. That’s new capital flow and speculative behavior we didn’t see last cycle.
Plus, the geopolitical landscape is shifting fast. With President Donald J. Trump calling for crypto regulation frameworks within 180 days, we may soon see an influx of institutional money — but it could come with strings attached.
⸻
Final Thoughts:
A breakdown in BTC.D could mean a major rotation into alts — but don’t bet the farm.
Markets could still dump. We may even skip altseason altogether this cycle.
However, this chart gives you a crucial edge — so use it wisely. Know your tools. Zoom out. Plan ahead.
As always — stay sharp, stay safe, and stay profitable out there.
— Savvy
