EURCAD update and new view on EC
OANDA:EURCAD in first view (attached) we are have at end break of zone and also break of trend line, price is start pushing bearish.
Now RAISING WEDGE pattern is visible, looks like strong momentum is gathered and from here expecting one more fall.
SUP zone: 1.57100
RES zone: 1.54600, 1.54000
Beyond Technical Analysis

XAUUSD- 1H UpdateChart Description – XAUUSD 1H (Gold Spot vs. USD)
This is a multi-scenario Smart Money Concept (SMC)-based projection chart for Gold (XAUUSD), focusing on potential bullish retracements and major bearish continuations, incorporating Buy Zones, Sell Zones, and Change of Character (CHOCH) areas.
🔍 Key Components:
🟣 Sell Zones
Two sell zones are identified, with the highest near the All-Time High (ATH) around the $3,500 mark.
These are areas of expected bearish reaction if price retraces upward after a low.
🟢 Buy Zones
Located between $3,200 – $3,160 and another deeper one near $2,960, where potential bullish reactions may occur.
🔵 CHOCH - 4H
Marked in red around $3,260 area, indicating a 4-hour Change of Character, suggesting a potential shift from bullish to bearish sentiment.
🔸 Key Price Levels
$3,120: Historical support/resistance.
$2,956.20: Major swing low and key demand zone.
📊 Projected Market Path (Colored Waves)
🔹 Blue Path (Bullish Retracement Scenario)
Price is expected to retrace into a sell zone around $3,400–$3,460 after testing the current demand.
From there, a major sell-off is anticipated.
🔷 Cyan Path (Bearish Continuation)
Following the retracement, the market is projected to break below the recent low and head toward lower buy zones, potentially near the $3,120 and $2,960 regions.
Shows lower-high and lower-low formation, consistent with a bearish trend.
🧠 Market Sentiment
This chart suggests a bearish outlook for Gold unless a structural shift invalidates the CHOCH zone and supply levels. The chart highlights the importance of:
Waiting for confirmation in the supply zones before shorting.
Considering buy opportunities only in valid buy zones with bullish reaction confirmation.

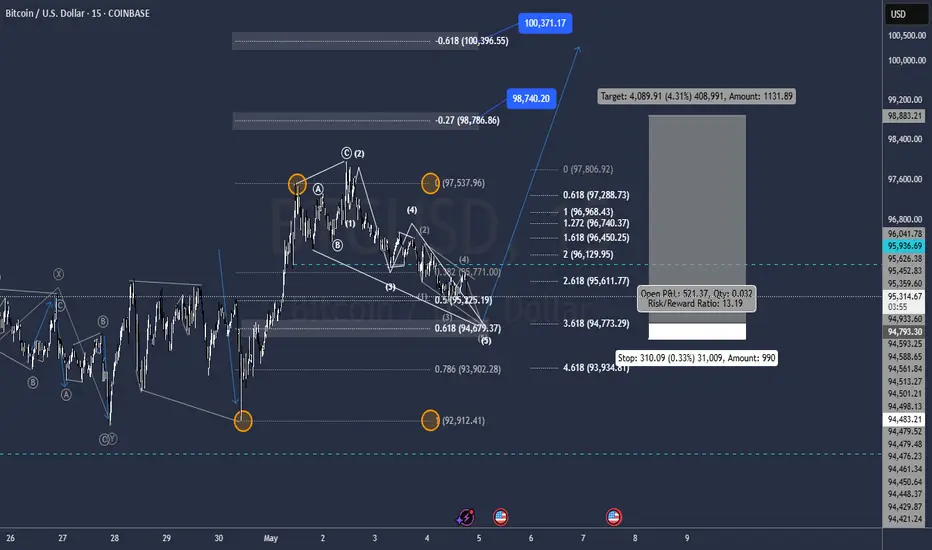
Bircoin correction should End @ 94.800Correction About to Complete Wave 5 for Expnding Flat Correction
Matching .618 Retracement and 3.618 wave 1 of C Expansion to the pip @ 94.800.
Targets @ 98.750/ 100.350 And Further
AUDUSD Sell IdeaMarket Become Lazy and It's Seems that they Will Retrace to Down Side Cuz The Trend was the Up But We Can Catuch A Scalp Or Daytrade there. Look.

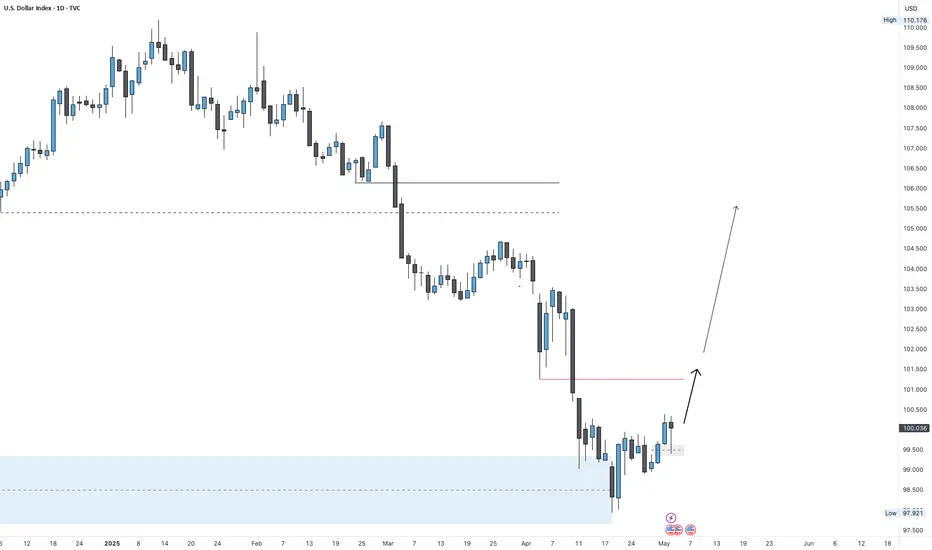
DXY Outlook: FVG Retest Complete — Is 105 the Next Sweep?DXY Weekly Forecast
In recent weeks, DXY dropped to the extreme demand zone, sweeping the lows around 98–99, before launching a bullish reversal and breaking through multiple minor highs.
Last Friday, price retested a daily Fair Value Gap — perfectly aligned with the NFP release — and held. Now, we may see some sideways consolidation at this level before continuation higher toward the 105.000 zone, where key liquidity sits above prior highs.
Bias: Bullish
Key Zones:
• Support: 102.000 (FVG / demand area)
• Resistance: 105.000 (liquidity target)
The structure is clean: bulls in control, as long as the FVG zone holds.
—
Weekly forecast by Sphinx Trading
Drop your thoughts in the comments.
#DXY #DollarIndex #USD #ForexAnalysis #LiquiditySweep #SphinxWeekly #FairValueGap #NFP #SmartMoney
Crude Oil's Bearish Trend Continues: Intraday Trading StrategiesDuring the US trading session on Monday, crude oil recovered part of the losses from the sharp decline at the opening of this week. Previously, OPEC+ unexpectedly increased production again, causing crude oil to continue the bearish trend that has been gradually taking shape since March.
Today, the price of crude oil first rose and then fell. After hitting a new low, the upward trend continued, but when it reached around $57.7, it encountered significant resistance. Looking ahead, it is expected that crude oil will experience an oscillation phase first, and then continue its downward trend.
Currently, crude oil is still in a bear - dominated trend. For intraday trading strategies, it is recommended to focus on short - selling on rallies and use buying on dips as a secondary approach. Pay close attention to the resistance range of $57.7 - $58.5 on the upside and the support range of $55.5 - $54.0 on the downside.
USOIL
sell@57.30-57.50
tp:56.50-56.00
Investment itself is not risky; it is only when investment is out of control that risks occur. When trading, always remember not to act on impulse. I will share trading signals every day. All the signals have been accurate without any mistakes for a whole month. No matter what gains or losses you've had in the past, with my help, you have the hope of achieving a breakthrough in your investment.

Waaree can easily give 16% return in short time.Block buster result. The stock pop up the next day and now it is down. It can easily go to that level which is 16% return in short time.


PineScript v6: Conditional Expressions from Libraries
I thought it appropriate to make some quick notes on calling conditional expressions from PineScript v6 libraries, seeing as I have recently updated all of my libraries to v6 and most of my function exports output booleans or values that are ultimately derived from other functions that output booleans.
When calling functions in v6 that output booleans or values derived from other functions that output booleans, it is best practice to first declare the function return globally before you use said output as input for anything else.
For example, instead of calling my swing low and uptrend functions (which both return booleans) as part of a broader conditional expression:
//@version=6
indicator('Example Conditional Expression 1')
import theEccentricTrader/PubLibSwing/3 as sw
import theEccentricTrader/PubLibTrend/2 as tr
uptrend = sw.sl() and tr.ut()
plotshape(uptrend)
I would first declare the function returns as global variables and then call the broader conditional expression using said variables:
//@version=6
indicator('Example Conditional Expression 2')
import theEccentricTrader/PubLibSwing/3 as sw
import theEccentricTrader/PubLibTrend/2 as tr
sl = sw.sl()
ut = tr.ut()
uptrend = sl and ut
plotshape(uptrend)
This demonstrates different behaviour from v5, where you could combine functions that output booleans in conditional expressions without error or warning.
The same also applies to functions that output values derived from other functions that output booleans. In the example below, my swing low price and bar index functions output float and integer values, respectively, but these values are derived from the swing low function, which is a function that returns a boolean. So these return values should also be first declared globally for later use, just like the swing low and uptrend functions:
//@version=6
indicator('Example Conditional Expression 3', overlay = true)
import theEccentricTrader/PubLibSwing/3 as sw
import theEccentricTrader/PubLibTrend/2 as tr
sl = sw.sl()
ut = tr.ut()
slp_0 = sw.slp(0)
slpbi_0 = sw.slpbi(0)
slp_1 = sw.slp(1)
slpbi_1 = sw.slpbi(1)
if sl and ut
line.new(slpbi_1, slp_1, slpbi_0, slp_0, color = color.green)

GBPUSD The second trade of the day comes from the GBPUSD pair.
Even though I'm not a big fan of this pair, I believe it's worth taking advantage of the signal.
However, for this pair, I recommend slightly reducing your lot size and overall risk.
🔍 Criteria:
✔️ Timeframe: 15M
✔️ Risk-to-Reward Ratio: 1:3
✔️ Trade Direction: Buy
✔️ Entry Price: 1.32793
✔️ Take Profit: 1.33054
✔️ Stop Loss: 1.32706
🔔 Disclaimer: This is not financial advice. It's a trade I’m taking based on my own system, shared purely for educational purposes.
📌 If you're also interested in systematic and data-driven trading strategies:
💡 Don’t forget to follow the page and subscribe to stay updated on future analyses.

Market appears supportive of Tesla's growth prospects**Direction:** **LONG**
**LONG Targets:**
- **T1 = $287.50**
- **T2 = $295.25**
**Stop Levels:**
- **S1 = $275.00**
- **S2 = $268.75**
---
**Wisdom of Professional Traders:**
This analysis synthesizes insights from thousands of professional traders and market experts, leveraging collective intelligence to identify high-probability trade setups. The wisdom of crowds principle suggests that aggregated market perspectives from experienced professionals often outperform individual forecasts, reducing cognitive biases and highlighting consensus opportunities in Tesla.
**Key Insights:**
Tesla continues to dominate the EV sector with substantial global market share and expanding demand across multiple territories. It has consistently outperformed competitors by innovating battery technologies and ramping up production capabilities. Recent improvements in cost efficiency and scaling production have reinforced positive outlooks from traders. Key focus areas include Tesla's development of its 4680 battery production and advancements in energy generation/storage, further suggesting a long-term competitive edge.
The broader market appears supportive of Tesla's growth prospects, particularly with EV subsidies and green energy initiatives in major economic regions. Tesla's brand recognition and consistent product releases continue to draw consumer attention, while strategic efforts like the buildout of gigafactories globally are seen as favorable catalysts for sustained revenue expansion.
**Recent Performance:**
Over the last week, TSLA has displayed steady consolidation and formed a strong technical base approximately near $280. This stability follows a significant bullish rally earlier in the month, and the stock now appears poised for a continuation to test resistance levels. Technical indicators such as the Relative Strength Index (RSI) remain within neutral-to-positive territory, while moving averages support the potential for upward trajectory amidst firm buying support.
**Expert Analysis:**
Analysts broadly expect Tesla to capitalize further on its technological leadership in the automotive market. Hedge funds and institutional investors have shown significant interest in maintaining long positions on Tesla due to growth-driven profitability and aggressive expansion. Experts view Tesla's ability to scale its production and integrate advanced AI technologies into the manufacturing process as differentiating factors in the industry.
Tesla's Q3 production and delivery targets have received favorable feedback, aligning with expectations of robust growth narratives. If global macroeconomic pressures ease, Tesla could benefit further from optimistic market dynamics, broadening its appeal among investors.
**News Impact:**
Tesla's recent progress in scaling production at its factories and updates on the highly anticipated Cybertruck have sparked renewed confidence in the company's product lineup and potential market penetration. News regarding expansions into new territories coupled with strategic collaborations in energy storage solutions bodes well for long-term growth. Positive sentiment in this area tends to support the general bullish narrative among professional traders and market participants.
**Trading Recommendation:**
Tesla exhibits strong fundamentals and resilient technical qualities conducive to a long play this week. Professional trader consensus supports a bullish stance, further backed by favorable news impacts and sustained market demand for Tesla vehicles and innovations. Maintaining stops near broader support levels while aiming for gradual upward price targets is recommended to balance risk and reward. Consider this a solid long opportunity for near-term price advancements.

BTCUSDT - Key Support Zone Holding StrongPrice has pulled back to a well-defined support zone after a strong upward move and a clear break of structure (BOS). A bullish reaction is visible from the support area, aligning with a potential reversal setup. The chart also highlights a recent retest of the resistance zone (R.S) before this drop. Watching for a continuation toward the upper target if the support holds.

Gold Eyes Recovery as Price Targets $3,260 ResistanceGold is showing signs of a potential rebound on the 15-minute chart. After finding support around the $3215–$3225 zone, price action is starting to climb again. If this upward momentum continues, we could see gold make a push toward the $3260 resistance level. Keep an eye on price behavior near support—any strong bounce could be a signal for further upside.

DXYDXY 99.418 Bearish Target – Summary:
99.418 is likely a key support level or technical target based on chart patterns or retracement levels.
It marks a potential bounce zone or short-term bearish goal before deeper levels like 98 or 95.
Break below 100 and weak momentum indicators support the move toward 99.418.
If DXY holds above 99.418, it may trigger a short-term rebound.

BTCUSDT Take ProfitHave I ever told you how much I love BTC? 😄 Yes! Our BTCUSDT trade has hit Take Profit!

doge buy midterm"🌟 Welcome to Golden Candle! 🌟
We're a team of 📈 passionate traders 📉 who love sharing our 🔍 technical analysis insights 🔎 with the TradingView community. 🌎
Our goal is to provide 💡 valuable perspectives 💡 on market trends and patterns, but 🚫 please note that our analyses are not intended as buy or sell recommendations. 🚫
Instead, they reflect our own 💭 personal attitudes and thoughts. 💭
Follow along and 📚 learn 📚 from our analyses! 📊💡"

Consumer Goods Sector Calls on Trump for ExemptionsBy Ion Jauregui – Analyst, ActivTrades
Trade policy returns to the center of the U.S. economic stage. Donald Trump, in his new electoral program, has reignited his protectionist strategy with proposals for additional tariffs that could exceed 60% on certain products, including footwear, electronics, and manufactured goods imported from China and other regions. This measure, if implemented, will have direct consequences on the business fabric listed on Wall Street and, by extension, on the main stock indices.
Impact on major brands
Companies like Nike (NYSE: NKE), Skechers (NYSE: SKX), and Adidas (ETR: ADSGn), although the latter is listed in Europe, have already expressed their concern. Together with more than 70 other brands, they have asked the administration to exclude footwear from the new tariff package, arguing that adding an extra 145% to the current tariffs — which already range between 20% and 37.5% — would be a direct blow to their profitability and pricing structure, and would slow down their sales forecasts. This fear is not unfounded: both Adidas and Skechers have revised their U.S. sales forecasts downward, anticipating a drop in consumption due to the increased cost of their products.
Repercussions on stock indices
The effects are not limited to companies directly affected. The S&P 500, which includes the 500 largest U.S. companies, covers numerous sectors exposed to imports and international supply chains. An increase in tariffs translates into:
• Reduction of corporate margins in sectors such as discretionary consumption, retail, technology, and automotive.
• Drops in quarterly profits, which could lead to downward revisions in valuations.
• Greater market volatility, since investors usually react cautiously to aggressive protectionist policies.
The Nasdaq 100, with high exposure to tech companies such as Apple (NASDAQ: AAPL) or Tesla (NASDAQ: TSLA), is also in the spotlight. Many of these firms depend on components manufactured in Asia, so a tariff escalation implies higher costs and possible delivery delays, directly affecting their operations.
Meanwhile, the Dow Jones Industrial Average, more concentrated in industrial and consumer sectors, could be affected by pressure on companies such as 3M, Boeing, or Home Depot, especially if domestic demand is impacted by the rising cost of imported goods.
Risks for the corporate economy
The risk goes beyond consumption. Increasing the tariff burden also implies higher operating costs for importing companies, reducing margins, pressuring quarterly profits downward, and in many cases, affecting stock prices. In addition, multinationals that manufacture in Asia could be forced to restructure their supply chains, which would involve unforeseen investments during a global economic slowdown.
Skechers Analysis
The company has been trading lower continuously after a poor start to the first quarter from its highs at the end of January at $78.24, added to the bearish gap caused by Donald Trump's tariff policy. The price is currently supported around the $45.58 level and trading in a middle area around $48.50. Its current upper zone is $56.70 and its lower zone is $42.50. If the price holds during the quarter, we could see a return to the upper part of the indicated range. Otherwise, if the results are as severe as forecasted, Skechers may test the support again and seek a new lower support zone around the current lows of $31.28.
Fiscal and political context
Although employment in the U.S. has shown resilience, with 177,000 new jobs created in April and an unemployment rate of 4.2%, the economic cooling is evident. Trump's proposal includes not only tariffs but also a sharp cut in public spending: $163 billion less, with a 23% reduction in non-defense sectors such as education, healthcare, or research, while the security budget increases by 65%. This fiscal reorientation could cool internal demand and affect GDP growth in the medium term, raising the risk of recession in consumption-sensitive sectors.
Tariff policies are usually poorly received by financial markets due to their distorting effect on prices, international trade, and business confidence. In summary, the new tariff proposals could put downward pressure on U.S. stock indices, especially if the markets price in lower business profitability, increased costs, and a slowdown in consumption. An environment that, far from bringing calm, brings investors back to a more cautious mode.
*******************************************************************************************
The information provided does not constitute investment research. The material has not been prepared in accordance with the legal requirements designed to promote the independence of investment research and such should be considered a marketing communication.
All information has been prepared by ActivTrades ("AT"). The information does not contain a record of AT's prices, or an offer of or solicitation for a transaction in any financial instrument. No representation or warranty is given as to the accuracy or completeness of this information.
Any material provided does not have regard to the specific investment objective and financial situation of any person who may receive it. Past performance is not reliable indicator of future performance. AT provides an execution-only service. Consequently, any person acting on the information provided does so at their own risk.

Amazon remains a dominant force in e-commerce and cloud**Direction:** **LONG**
**LONG Targets:**
- **T1 = $195.80**
- **T2 = $199.00**
**Stop Levels:**
- **S1 = $188.00**
- **S2 = $185.00**
**Wisdom of Professional Traders:**
This analysis synthesizes insights from thousands of professional traders and market experts, leveraging collective intelligence to identify high-probability trade setups. The wisdom of crowds principle suggests that aggregated market perspectives from experienced professionals often outperform individual forecasts, reducing cognitive biases and highlighting consensus opportunities in AMZN.
**Key Insights:**
Amazon remains a dominant force in e-commerce and cloud computing, but growth concerns have recently pressured its stock. Professional traders emphasize the importance of AWS (Amazon Web Services) as a growth driver, despite recent performance discrepancies compared with competitors like Microsoft Azure. Technical traders also note that Amazon is consolidating around key support levels, with reduced implied volatility that could indicate forthcoming price stabilization or upward momentum. Sentiment is mixed, but traders are gearing up for possible resilience given potential catalysts.
**Recent Performance:**
Amazon’s stock has seen a gradual recovery from prior declines earlier this year. Still, the stock remains 13% lower year-over-year compared to a modest 3% decline in the S&P 500. This muted performance reflects concerns around short-term macroeconomic challenges, such as slower growth in AWS and tariff changes. The recent price movement indicates a trading range and decreased volatility, suggesting less aggressive downside selling.
**Expert Analysis:**
Expert opinions signal Amazon remains structurally intact with a strong long-term outlook, although short-term headwinds persist. The cloud segment moderation is highlighted as a key challenge, but analysts remain optimistic with broader revenue trends, including Amazon's diversification initiatives into healthcare and logistics. In technical trading terms, a break above the $192 resistance zone may confirm bullish momentum, while a breach below $185 could signal further weakness.
**News Impact:**
News surrounding tariff adjustments and Amazon’s ambitious but high-cost Project Kuiper dominate recent headlines. Import tariff changes impact margins, but traders see efforts to roll out satellite-based internet projects as a testament to Amazon's innovation drive. Satellite deployment challenges may take the spotlight away from near-term earnings performance, adding speculation on long-term growth factors.
**Trading Recommendation:**
Amazon's recent consolidation near its support zone and technical signals indicate a favorable long setup for traders anticipating a breakout above $192. Focus on maintaining stop levels diligently and adjusting targets if momentum shifts unexpectedly. Long-term fundamentals remain supportive, reinforcing confidence in growth as risks moderate over time.

Gold Outlook: After Breaking 3,260 — Is 3,000 the Magnet?Gold Weekly Forecast
Gold closed last week below the previous weekly lows at 3,260, confirming bearish intent. Price has now left behind multiple imbalances from the bullish leg that started at the 3,000 level.
We could first see a retracement to the small imbalance zone around 3,300, followed by a bearish continuation back to the main support/imbalance zone near 3,000.
Sideways price action is likely early in the week — but unless bulls reclaim 3,300+, momentum favors a retest of the base.
Bias: Bearish
Key Zones:
• Resistance / Rebalance: 3,300
• Support / Imbalance Target: 3,000
—
Weekly forecast by Sphinx Trading
Drop your view in the comments.
#Gold #XAUUSD #GoldForecast #LiquidityVoids #TechnicalAnalysis #SphinxWeekly #SmartMoney #FVG #3kLevel

$SPX / $SP500 – China Deal or Global Meltdown? The Risk/Reward 📉 The S&P 500 ( SP:SPX / VANTAGE:SP500 / $ES_F) is at a geopolitical crossroads.
After the Global Pause, the index rebounded, but only to retest resistance near the 200-day EMA. Now it faces a binary outcome:
Scenario A: ✅ Deal with China
Estimated probability: 20%
Potential upside: +10%
Expected value: +2%
Scenario B: ❌ No Deal with China
Estimated probability: 80%
Potential downside: -50%
Expected value: -40%
📉 Expected move: -38% net Markets are not priced for this. Volatility ( TVC:VIX ) is quietly coiling under the surface (chart 2), ready to explode if the no-deal scenario materializes.

Japan Oer handling the DollarUSDJPY is lossing ground and drifting to the downside just after the 145 price leel retest then it will look to shift down to 143 pice level for the week if not days

AMD Longadvanced money destroyer? Long idea.
Good luck to all in these market conditions. Hopefully this is a very good idea like the ones we published previously that have been removed

Dow Jons artistic outlook - a proposition for you to take or disWhen I'm looking at my chart, i like to know what this story is about.
This is what
the whole world is looking at,
some say between 1-5 years from, now we are all going to see what it is about.
Most of us want to prosper but there is a certain minority group who doesn't want that. Why? IDK tell me that.
--------------------------------------------------
The chart do not represent a prediction of any kind its more an invitation how to start thinking -about build.
---------------------------------------------------
Time is short although my chart is on 12 month time line
=================================================
they say 1-5 years but very unlikely now. I don't know if you can see that
there is a time in next 3 years when the trend goes up.
Its my 10 years of experience i and some hard challenging times. i tracked dow nearly 24/7 for 3 years now so i know what it is about. to explain it to you in full could take some time and here is not a place to do just that.
You can see some general shapes and possible traversals, it happens i track them quite correctly due to my different mind.
"I have good intuition when I'm true to myself
this is my point of view I hope to share with you."
SimonTheBeekeeper
PS:
when things starts to move fast
i have my map to find out
where and how.
--------------
thanks for watching I
