RARE / -13R / SHORT....SAS @ .5318 Rare but rewarding !
sell limit.... SAS @ 0.5318
💯 solid setup...watch this tank 📉
in engineering....we call this BUCKLE ;)
expecting min DD < 15p max RRR > 13
TP1 and SL as shown until final TP2 projected by system.
Sorry, alert is not based on TA like BoS or OB or SnR SnD PP or Fibs or even ICT etc....since designed to induce and seduce...rather based on multi-system confluence convergence and confirmations.... now system beeping let's test n see 🙈
IF u like this...would appreciate any feedback for continuous improvement...
🥂
Beyond Technical Analysis

Forget Candlestick Patterns -Who is in control BUYERS or SELLERSAll the information you need to find a high probability trade are in front of you on the charts so build your trading decisions on 'the facts' of the chart NOT what you think or what you want to happen or even what you heard will happen. If you have enough facts telling you to trade in a certain direction and therefore enough confluence to take a trade, then this is how you will gain consistency in you trading and build confidence. Check out my trade idea!!
www.tradingview.com


Nasdaq vs SQQQ, 1 year daily chartThe pattern emerging shows the convergence between the two trend lines. The trend lines show the change from zero, indicating positive or negative trend. The trends are currently at a point where SQQQ is beginning to trend positively, as Nasdaq tests the negative direction. That leads to the cross over as the trends change.
A longer view shows a better picture of where they have come in the past few years to have gotten where they are now. This helps to understand the ultimate outcome of the current cross-over.
Legend:
Nasdaq-hollow candles
SQQQ-solid candles

Gold Vs. Nasdaq, since 2022Fairly clear here that Gold and Nasdaq correlated in direction until December 2024, at which time the equities market peaked. The two continued to correlate in trend direction until February, where, after several years divergence finally occurred.
Gold continues upward, equities continue lower. This seems to be a clear indication that equities, in this case the Nasdaq, will continue into downward correctional territory while Gold continues into a positive trending direction.

Daily Analysis- XAUUSD (Monday, 28th April 2024)Bias: Bullish
USD News(Red Folder):
-None
Analysis:
-Strong drop on market open, waiting for equal low to be liquidated
-Looking for buy if price makes rejection
-Potential BUY if there's confirmation on lower timeframe
-Pivot point: 3220
Disclaimer:
This analysis is from a personal point of view, always conduct on your own research before making any trading decisions as the analysis do not guarantee complete accuracy.

DXY ... Dollar Index looks not as clean Gann reviewNot too much to explain here...just see the highlighted areas and see that the Gann box Stacking strikes again with some interesting levels. The light angles are kinds nice, but the most recent one where the price is now seems to be the only thing holding it back from being a green face smash to 96...
Mor Tariff... Mor pain for the Dolla Dolla Bill y' all
This is the larger picture and see as to how I come to these Gann box alignments:
Again...You just find pivots and span them with the box- then stack or slide them with points all being contiguous and you have your price action analysis.
Above chart is the weekly. Just imagine if there was any significance to the 2001 high and then the 2008 lows when it comes to geopolitics or financial situations....one could say:
Its almost like a twin peak, one with a tower on it, just suddenly got hit out of nowhere and then crashed down to the Great Financial Center down below..hmmm VV

Trade Idea: Supply Network Limited (ASX: SNL)SNL has demonstrated impressive resilience, staging a sharp V-shaped recovery and returning to all-time highs despite broader market uncertainties. The stock’s ability to maintain strength through news-driven volatility highlights robust underlying momentum.
With overall market volatility currently at manageable levels, a small initial position is warranted to participate in the ongoing uptrend, while maintaining disciplined risk management.
Entry Strategy:
Initiate a small long position at current levels to capitalize on potential continuation of the uptrend.
Risk Management:
Set an initial stop-loss at $36.21, representing a controlled downside risk of approximately 5.7% from current levels.
This setup allows for participation in the momentum while maintaining tight risk controls in case the trend fails to follow through.
⸻
DISCLAIMER : The content and materials featured are for your information and education only and are not attended to address your particular personal requirements. The information does not constitute financial advice or recommendation and should not be considered as such. Risk Management is Your Shield! Always prioritise risk management. It’s your best defence against losses.

Gann Box stacking and Gold...funny things alignNot much to explain here...just the boxes all aligned and stacked up onto each other starting from the 1999 low to the bull run high of 2011, and then copied and stacked to show current price action.
However, there is a weird thing with boxes of the Gann type. Usually 25 and 75 time allotments, or 1st and last boxes, are the most aggressive moves. But this one has already almost broken the box in the first panel of the 25%.
So you will either have a stagnation and then slight down or up drift until you hit the later 75% box at the most right....or you just go "nah, Irish goodbye to yah lad" and jump to the next box up...we shall see.
But those lines do hold some weight and you can see the Gann angles had a few good pivots and one generally good line to follow through this initial explosion up.
But we go sidesways if the house of bird poo color can clean up their act...pull a Styx and "Come sail away with me..." to the next box up and run to the like 5K limit, who shall know....
--------
from 1999 summer to 2011 summer to move the height of the box....
and its been achieved in merely 2 some years as of this point...oh boy
VVVV Notice the 3 peaks at 1900 perfectly aligning with that box edge before the next box is stacked up to accommodate current price action...
Your thoughts...right...wrong...or just a :) all welcome
PS...These boxes arent made to fit this chart...It is just a pivot low to pivot high and then copied and stacked/extended....But see how that 2nd box times the triple peak and explosion into the newest up move...crazy hmm

Price Action + Fundamentals Point to Dollar StrengthThe current market environment presents compelling evidence for a bullish move in the US Dollar Index (DXY). While some patience is required, the setup is increasingly favorable for the dollar to appreciate in the coming weeks and months.
Key Factors Supporting a Bullish Move:
Monthly Close Above 100.160:
A critical technical level to monitor is the monthly close above 100.160. If achieved, it would signal a strong bullish breakout, setting the stage for a continuation higher. Given current price action and market dynamics, this scenario looks highly probable. However, if the price fails to close above 100.160 and instead breaks below it, we could potentially start looking for short opportunities.
Bond Market Strength (30Y, 10Y, 5Y):
This past week, we witnessed notable strength across the US bond market. Yields declined as prices rose, typically a positive signal for the dollar as it reflects capital inflows into US assets.
COT Report Insights:
The Commitment of Traders (COT) report reveals a critical shift: commercial traders, often considered the "smart money," are beginning to accumulate long positions in the dollar. This change in positioning historically precedes significant bullish moves.
Seasonal Patterns:
Seasonality also favors the dollar during this period. Historically, the dollar tends to strengthen in the mid-year months, aligning perfectly with the current technical and fundamental landscape.
Targets:
Initial Target: 106.120
Given the accumulation signs and supportive macro backdrop, a move towards 106.120 seems very realistic.

Bitcoin About to Repeat 2021 ? Major Crash Incoming?🚨 Bitcoin About to Repeat 2021? Final Pump Before Major Crash Incoming! 🚨
Bitcoin’s current price action is reflecting classic Smart Money Concepts (SMC) and ICT methodologies — and the structure is almost identical to what we saw at the 2021 bull market top.
✅ Here's what I'm expecting based on SMC/ICT principles:
Final liquidity sweep above relative equal highs (targeting $110K–$130K 🚀), just like the final pump in 2021
Displacement and Market Structure Shift (MSS) to signal a confirmed reversal 📉
Distribution phase where smart money offloads their positions onto trapped retail buyers
This fractal behavior and liquidity engineering mirrors how the market topped in 2021 before the brutal bear market began.
🔮 Key Smart Money Signs to Watch:
Liquidity grabs above highs (inducement traps) 🔥
Premium array setups at major order blocks 🏦
Bearish BOS and MSS confirmation 🛑
Fair Value Gaps (FVGs) acting as magnets after the reversal ⚡
🧠 Reminder:
"If you understand where the liquidity is, you understand where the market is going." — ICT
History doesn't repeat, but smart money strategies often do.
💬 What do you think? Will Bitcoin repeat the 2021 trap and collapse after new highs? Let’s discuss below! 👇🔥
#Bitcoin #BTC #Crypto #BTCUSD #SMC #SmartMoney #SmartMoneyConcepts #ICT #Liquidity #MarketStructure #TradingView #OrderFlow #BearMarket #CryptoTrading

GBP_NZD SWING LONG|
✅GBP_NZD dropped to
Retest a horizontal support
Level around 2.2200 and we
Are already seeing a bullish
Rebound so as we are bullish
Biased further growth
Is to be expected
LONG🚀
✅Like and subscribe to never miss a new idea!✅
Disclosure: I am part of Trade Nation's Influencer program and receive a monthly fee for using their TradingView charts in my analysis.

Sell!Hello all. Copper is near a very critical zone ant it will fall. do u agree? tell me why? CM if you agree or don not agree.

GBPUSD SCENARIO 27/04/2025English : According to our analysis, we anticipate a bearish scenario.
Morocan Darija : kanchofo d'apres l'analyse dyalna antsanaw hboot
ATENTION : I only share my ideas, not signals

$BTC | 1D Macro Resistance ZoneBitcoin is testing a key liquidity area ($94.5K–$95.2K) after a sharp rally from $78K. This blue zone has triggered major rejections before — we may be nearing exhaustion.
🔍 Context & Observations:
— Possible final push + trap above resistance
— MSS level at $89,272 = first target if breakdown starts
— LTF range forming post-impulse
📌 Main scenario (correction):
— Entry: after fakeout & drop below resistance
— Target: $89.2K / $85K
— Invalidation: close 2-3 bars > $95K
📈 Alt scenario (bullish breakout):
— Entry: breakout & hold above $95K
— Target: $101K–$105K
— Invalidation: drop below $94K
⚙️ Triggers to watch:
— SFP or bearish structure on LTF
— Fakeout + low-volume rally
— Reclaim below range
Altcoins remain strong while BTC chops. Patience is key!

Just An Inch To Go1 inch inches nearer to breaking out to the upside. It's all a matter of time better yet, should I say inch--es.

28 Apr - XABCD Pattern Signals Potential UpsideRecently, the expected Head and Shoulders pattern seems to be delayed — and possibly invalidated — as buyers successfully defended the line at $3,287, pushing the price up to $3,319 on Friday. As a result, a new bullish setup has emerged.
On the 1-hour chart, an XABCD harmonic pattern has clearly formed, offering two upside targets:
Target 1: $3,367
Target 2: $3,435
On the downside, $3,260 is now acting as the critical level. A break below this point could open the door for lower prices.
For now, the bias is long until Target 1 at $3,367 is reached. Traders should monitor short-term sentiment closely: if signs of weakness or a shift appear, the price could reverse earlier.
Important to note: the Head and Shoulders pattern remains a risk if price falls below $3,260 after reaching $3,370 and moves toward the neckline at $3,237.
📍 Summary:
Idea: Go long toward $3,367.
Risk: Head and Shoulders pattern could still complete if bearish momentum returns.
Stay sharp and manage your risk accordingly!
-------------------------------------------------------------------------
This is just my personal market idea and not financial advice! 📢 Trading gold and other financial instruments carries risks – only invest what you can afford to lose. Always do your own analysis, use solid risk management, and trade responsibly.
Good luck and safe trading! 🚀📊

Something I AAVE to doHow many years have I been learning to trade? A decade plus thus far and things are clicking because its something I AAVE to do.

$XRP | 4h longCRYPTOCAP:XRP is showing notable relative strength against the market.
Currently testing the #4h Break of Structure (BOS) zone — a critical area for a potential breakout.
🎯 Base scenario:
— Bullish pattern forming right at the BOS zone.
— A clean breakout and acceptance above BOS would signal the start of a new impulsive leg.
— If confirmed, the next target zone is $2.54–$2.68 (0.618–0.75 fib extension).
🛎️ Set alerts above BOS and monitor for a strong bullish candle close.
🛡️ Invalidation: Failure to hold above BOS, with price returning below without confirmation.
💬 A confirmed BOS breakout on CRYPTOCAP:XRP could act as a major catalyst, boosting not only CRYPTOCAP:XRP but also broader altcoin momentum.
Stay sharp around this zone.

Ethereum | Short | Money Flow Weakness | (April 2025)Ethereum (ETHUSDT) | Partial Profit + Watching Short Setup | Money Flow Weakness | (April 27, 2025)
1️⃣ Insight Summary:
Ethereum is showing early signs of weakness as money begins to flow out. I'm taking partial profits and carefully watching for a possible short setup if momentum continues to shift downward.
2️⃣ Trade Parameters:
Bias: Partial profit taken; preparing for possible Short
Entry Zone: Watching current levels for short entries if weakness confirms
Stop Loss: Above recent local highs (if short position is activated)
TP1: Dynamic — adjust based on structure breaks
Partial Exits: Continue trimming profits on any major liquidity grabs or breakdowns
3️⃣ Key Notes:
✅ Order flow shows clear signs of money exiting Ethereum — confirming caution is needed.
✅ My own indicators align with the outflow and loss of bullish momentum.
✅ Partial profits locked to secure gains before volatility increases.
✅ Potential for a much deeper move down exists if selling pressure accelerates.
❌ Risk if a sudden reversal trap happens — short setups must wait for full confirmation.
4️⃣ Follow-up:
I will stay flexible here and update if we get a stronger breakdown or if conditions change rapidly.
Please LIKE 👍, FOLLOW ✅, SHARE 🙌 and COMMENT ✍ if you enjoy this idea! Also share your ideas and charts in the comments section below! This is best way to keep it relevant, support us, keep the content here free and allow the idea to reach as many people as possible.
Disclaimer: This is not financial advice. Always conduct your own research. This content may include enhancements made using AI.

Public Service Announcement: Super BTC!
Could this be one of, if not, the most significant trendline in Bitcoin's history? Bitcoin has clearly moved beyond its initial phase and appears to be on a strong upward trajectory. Allow me to present "Super BTC," the definitive trendline among all of Bitcoin's trendlines.

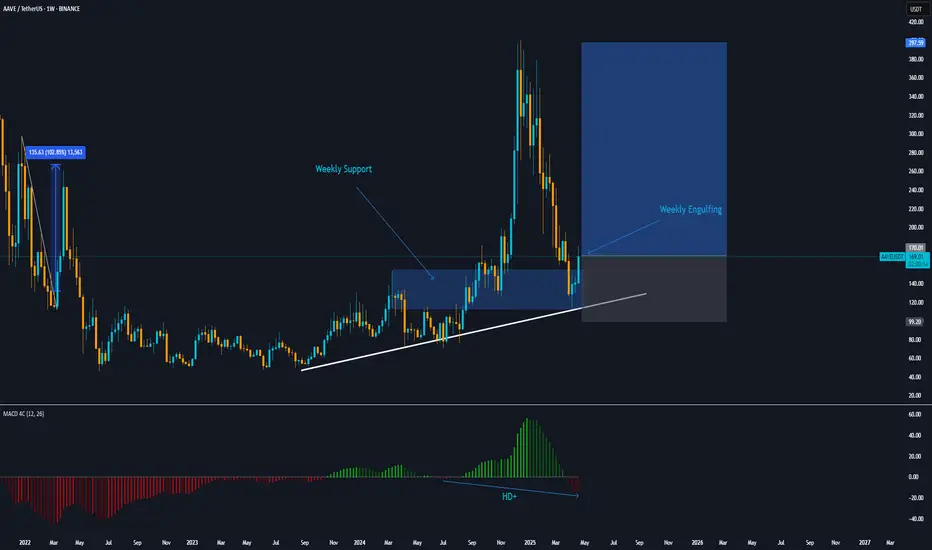
AAVEUSDT is ready to begin an UptrendWith the closing of a strong bullish candle and its engulfing, we can expect the price to grow to its previous high price range.
SUI SHORT massive manipulation on binance perps.I expect the market maker's volume output and the price to float freely, through spot fixation by big hands, May 1st major unlocking of SUI tokens, 60+% of tokens are in the block,
I keep shorting from 2.60 with targets on the chart, personally I see in this impulse we got a soon continuation of the downward structure with a local break renewal, too much positive from nothing, duties + tense situation in Asia can give impetus to a quick price delivery to 2.85 level
