USDCAD Potential Long PlayRetailers are short + bullish structure + Strong Demand zone. Potential Play? only problem, the zone does seem kinda at equillibrium
Beyond Technical Analysis

NASDAQ SELL?This is just a rough idea, I still need to wait and see where the market moves to and rejects from in order for TP and SL placement.
But, there is a Asian high, a London high and a NY high sitting closely together, causing what I call a liquidity pool, and we all know that liquidity moves the market. its like a magnet for the market.
so I'll be waiting and watching to see which session is swept and how the market reacts. But all in all, this is what i personally think Nasdaq will do
what are your thoughts? I would love to hear them.
I hope you all have a fantastic week and you rake in those profits.
God bless
J.D.L

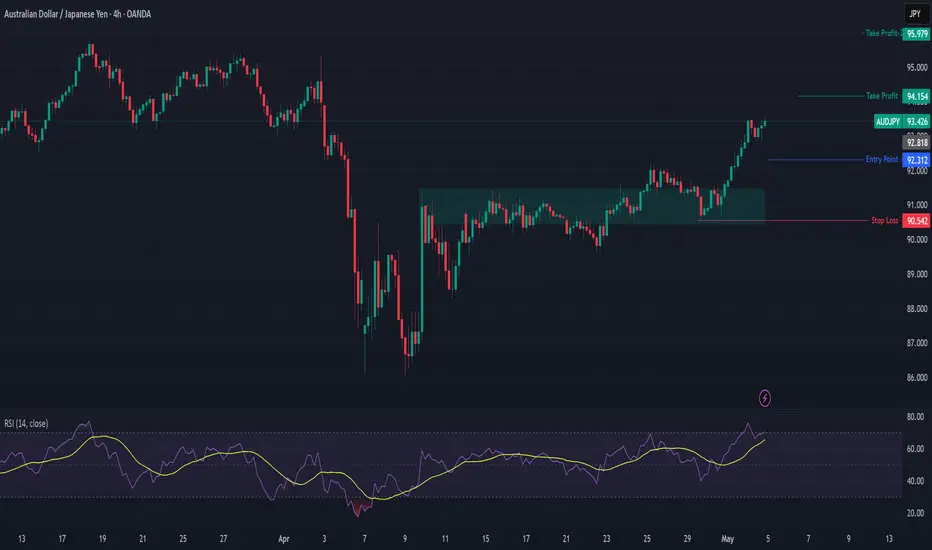
AUDJPY Trade Setup (Bullish Bias)🔥 Setup Summary:
Item Details
Bias: ✅ Bullish
Reasoning:
- Fundamentals strong (expectation no interest rate cuts + CPI bullish)
- JPY weak + overbought COT
- Exogenous: AUD strengthening
- Seasonality bearish short-term BUT medium-term bias bullish
Primary Entry: 🔑 92.30 (Buy Zone)
Dip Buy Zone: 🔄 91.80 – 92.00 (0.5–0.618 Fib retrace)
Stop Loss: 🚫 90.54 (below structure + 0.786 Fib)
Take Profit 1: 🎯 94.15 (below last swing high)
Take Profit 2: 🎯 95.00+ (extended target for trend continuation)
Risk:Reward: ~1:3+ (Entry at 92.3 / TP at 94.15–95.00)
Week of 5/4/25: EURUSD AnalysisEurusd has been consolidating internally, but has made a final push bearish from Friday NFP. We're looking for a short at the flip zone of the 1h POI, but if it goes past that to the extreme of the internal structure, we will be cautious and wait for a break to switch bullish.
Thanks for stopping by!
Major News:
FOMC - Wednesday
Unemployment - Thursday

Week of 5/4/25: AUDUSD AnalysisAfter a hellish week of consolidation, price has made its move higher (finally) and we're back to a trendy chart.
My analysis the beginning of the week shows 2 POIs that I am interested in for longs, and if it breaks the level that I pointed out bearish, I will look for shorts.
Thanks for tuning in!
Major News:
FOMC - Wed
Unemployment - Thurs

Super Performance Candidate NASDAQ:DUOL , leader in the digital language-learning market, rapid user and revenue growth and increasing profitability, cementing it in a well positioned long term growth model
Adding resilience in a downtrend market and a key breakout day, at a RS Rating of 98,
I have reasons to believe this security could increase

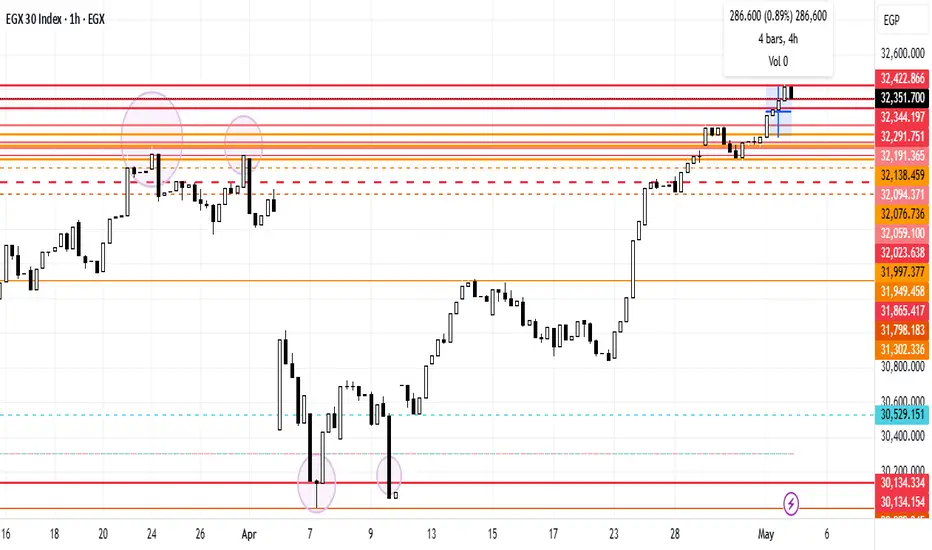
EGX30 Chart AnalysisEGX30 stock has shifted gradually to a higher zone, reaching the 32,291.751 resistance line, the 32,344.197 resistance line, and the 32,422.866 resistance line, showing the buyers' dominance over the sellers. Additionally, the upward trend is because Egypt's blue-chip index EGX30 closed 0.7% higher, which led to a 1.6% increase in TMGH, which strengthened the fundamental analysis about the CBE's decision about cutting the interest rate and the advanced massive ads and negotiations initiated by TMGH with different aspects.
Super Performance CandidateNYSE:SPOT , displaying market dominance, consistent user and revenue growth
Given with its recent earnings report and immediate market environment, prices sustained to attractive levels displaying institution appetite for risk.
With a RS Rating of 98,
I have reasons to believe this security price could increase

Why Being Delusional Might Be Your Greatest Asset in TradingIf you think you’re going to make a full-time living trading financial markets you’re completely delusional!... and that's a good thing.
It was 1997, and two friends—let’s call them Reed and Marc—thought it would be fun to have a movie night and rent Apollo 13 from their local Blockbuster store.
For those of you who might need some context, Blockbuster was a video rental store where you’d go to rent a movie you’d like to watch.
This was shortly after discovering fire and the wheel, and it was revolutionary. At its peak, Blockbuster was worth approximately $5 billion and had over 80,000 employees across 9000 stores worldwide.
Their business model was very simple, and although they generated revenue in various ways, their core revenue was generated through a combination of rental fees, video sales and late fees.
You see, it just so happened that our two friends who thought it would be fun to rent Apollo 13, chill at home, and eat popcorn would essentially have to pay the $40 late fee, and they were admittedly, not too happy about that.
As they sat in frustration, one of them came up with the idea to start a website and rent movies to people without charging a late fee.
Instead people would just pay a monthly subscription of around $19.95 per month and they could rent up to three movies of their choosing and keep it for as long as they wanted, no rental fee, no video sales, no late fees, just a monthly subscription of $19.95.
If people wanted to rent a new set of DVD’s then all they’d need to do is return the DVD’s they’d initially rented and the new set was mailed to them within a day or two.
Now it is important to mention that all this occurred toward the end of the third industrial revolution and the internet was not nearly as advanced as it is today. People would use a dial-up connection which only produced 56 kbps or slower.
Streaming was near impossible unless you enjoyed watching a movie in three-minute increments before it loaded the next three minutes. Downloading a movie could take an entire day or even longer.
It’s fair to say that our two friends Reed and Marc were throwing stones at giants, but they had very good aim.
I’m sure you heard the story where a boy aimed at a giant's head and threw him with a stone. Turns out the boy won that fight, and ultimately claimed victory for his people, but I digress.
You see Reed had a background in computer science and software development, and at the time he co-founded a software company called Pure Software. Marc had a background in marketing and product development.
It’s safe to say that they made a very good team, but they were still going up against giants, they were challenging a system that was working with a system that was not even established yet. Essentially, they either had to be very confident or extremely delusional. Turns out they were both.
They decided to brainstorm a few names for their little startup, everything from Kibble to TakeOne, and even DirectPix and none of it seemed to stick. Eventually, they decided to combine the words “internet” and “film” to make “Netflix”.
Today Netflix is the most popular streaming platform, with its annual revenue peaking at 33.7 Billion back in 2023.
I share this story with you because it really takes more than just experience, skill, and luck to take on giants, I would argue you need to have a healthy amount of delusion as well.
So, if you think you're going to make a full-time living trading financial markets, you're completely delusional—and that might be the best thing going for you.
Because the truth is, every breakthrough, every disruption, every world-changing idea begins with someone who dares to believe in something that doesn’t quite make sense to the rest of the world—yet.
Reed and Marc didn’t just challenge a system; they challenged what was possible at the time. They bet on a future that didn’t exist—on a slower internet, a skeptical audience, and an unproven model. What looked like delusion was a vision in disguise.
In trading, as in business and life, it’s not the most logical or the most experienced who wins—it’s often those who are bold enough to stay in the game when everyone else calls it crazy. You’ll need skill, yes.
Strategy, of course. But you’ll also need the unreasonable belief that you can beat the odds, learn the rules, and then rewrite them entirely. So go ahead—be delusional.
Just make sure you’ve got the grit, the patience, and the aim to back it up.
What “giant” are you bold enough to challenge next?

GOLD Once fall According this analysis Trade carefully best of Luck investors.
Forecast from Mr Martin Date 04 May 2025
Gold market is very high in this week due to the Chinas ministry of commerce said it signalised a Possible easing of tensions the US China trade war talks are still going and this creating a softer environment for gold to cool off from its strength in this week Gold will fall agaain price will decline from key level.
Key Level
Resistance zone 3260 / 3270
Support 3205 / 6162
remember like and comments to share more analysis with you.

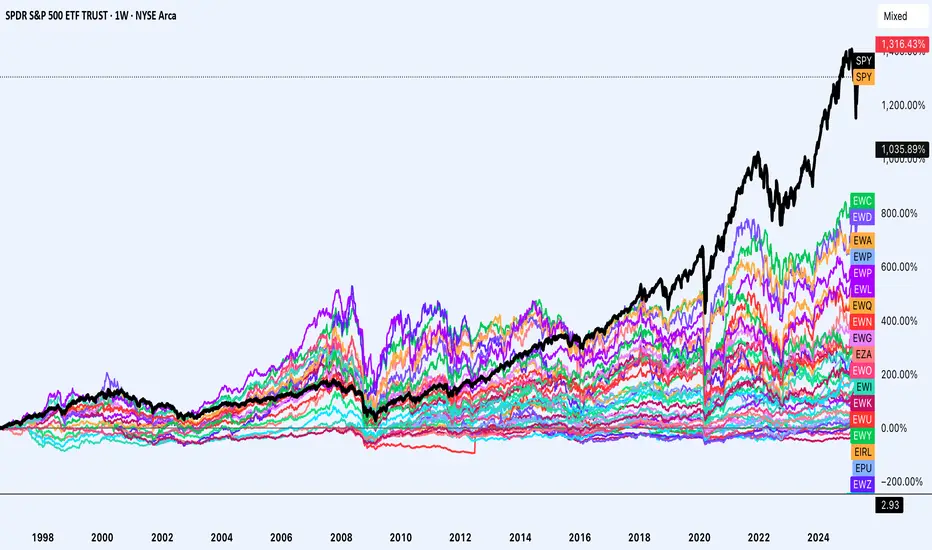
US Outperformance, when will it end?The US market has consistently outperformed global markets since the global financial crisis, it has also outperformed since the tech bubble. A portion of this can be attributed to a strong dollar (many markets outperformed in local currency). However this strong dollar performance may be coming to an end.
In addition there are structural reasons why the US has and may continue to outperform:
1. A larger weighting to higher growth sectors such as technology, communication services and a lower weight to lower growth sectors such as energy and materials.
2. Better rule of law, better focus on shareholder returns, less crowding from the government and state owned enterprises lowering the return of markets. (EM SOEs as an example)
3. US attracting global talent and fostering innovation. "The smartest person in any subject will likely go to the US'
So how can the US consistently underperform given these things?
1. Well for one the dollar may start to be a worse performing currency, it seems the current administration wants that. This not only lowers the performance of the US compared to global markets it also lowers the foreign inflows to US assets and also benefits EMs with dollar denominated debts.
2. The idea that the US attracts the best talent and fosters innovation may be declining with the current cultural attacks on immigration and the federal government spending cuts impacting research projects.
3. Global markets currently have a lower weighting to high growth sectors however this may not continue and instead we may start to see the marginal weight of sectors going to higher growth sectors instead of lower growth sectors.
4. The darling companies in most countries may list in their local markets instead of in the US. (Seeing the UK ease regulations of share classes, Chinese companies not welcomed in the US, European companies redomiciling back to Europe)
5. Valuations, Valuations, Valuations. Gun to your head: Next ten years would the multiple become a headwind or tailwind for the US market? What about for global markets? US trades at roughly 21x forward earnings whereas the UK trades at 12x, Eurozone at 14x, Japan at 13.5x, EM at 12x and China at 11x.
If after 10 years the US trades at an 18x multiple and the UK as an example trades at a 15x valuation that would be an annualized headwind of 1.5% for the US and an annualized tailwind of 2.3% for the UK. Add to that the effect of low starting valuations on yield (US net shareholder yield is close to 2% whereas the UK yields 4%).
Just rough numbers on performance for US vs UK next 10 years.
US: -1.5% multiple change, 2% yield, 10% earnings growth = 10.5%
UK: 2.3% multiple change, 4% yield, 6% earnings growth, 1% currency = 13.3%
Everyone is over allocated to the US and is under allocated outside the US. Currently the US represents around 20% of global GDP however it represents 70% of global market cap. 70 cents of every dollar in the equity market is in and goes to the US. Will this likely increase or decrease as a share? The next question becomes who will take that share if it falls?
Investing outside the US does not mean:
Investing in markets with bad shareholder friendliness
Investing in markets with a history of fraud
Investing in markets with notorious related party transactions
Investing in markets with high starting valuations.
Some markets such as China can have the first 3 issues applied to it, some markets such as India may frankly have all of these issues. Some markets in Europe may have the first and last aspect. And some markets likely have none of these issues. I propose Japan, UK and Northern Europe.
History is only a guide however the history of returns involved one of the single best economic performances of any country coming from the US which resulted in an amazing stock market with great returns, this is not guaranteed.
Historically stocks return nominally 10% and on a real basis 7% which can be decomposed to 3% yield and 7% earnings growth with virtually no multiple change (on long enough time horizons) when you start at a high valuation the yield component is lower and you need higher earnings growth to compensate. And on a much longer time horizon earnings growth is what really matters.
Earnings growth does not exist out of no where, it usually tracks nominal gdp growth + a margin increase from operations and or sector compositions.
Nothing is guaranteed, your next maximum drawdown is in the future, expect the unexpected and keep invested as the global debt bubble will likely be inflated away.
formed a bearish head and shouldersXVS has formed a bearish head and shoulders pattern and has already broken below the blue neckline. This breakdown suggests a potential move down to the green line level.
📈 Technical Overview:
Pattern: Bearish Head and Shoulders
Neckline: Blue level, already broken.
🎯 Target: Green line level upon confirmation of the breakdown.

AI BTC Prediction Next 24–48 Hours !May 3, 2025, 11:13 pm. BTC/USD. BTC/USD Trading Plan
Timeframe: Next 24–48 Hours
Long Scenario
- Entry: 96,550 (confirmed close above 96,500 with rising volume + RSI > 50).
- SL: 95,700 (below immediate support 95,800).
- TP: 96,800 (below resistance 97,000).
- Trailing Stop: 1.5x ATR (~162 pips) after surpassing 96,800.
- Confirmation: MACD histogram reversal + Bollinger Band breakout above midline.
Short Scenario
- Entry: 95,750 (confirmed close below 95,800 with rising volume + RSI < 40).
- SL: 96,600 (above resistance 96,500).
- TP: 95,200 (above support 95,000).
- Trailing Stop: 1x ATR (~108 pips) after breaking 95,500.
- Confirmation: Supertrend remains bearish + EMA crossover downward.

Opened liquidity pool for SOLUSDC💰Opened a SOL/USDC liquidity pool
1% range with approximately $300
I want to create detailed statistics and understand how well it performs within narrow ranges.

NQ weekly review and Outlook. FOMC week CME_MINI:NQ1!
Expecting buyside expansion on NQ. Lets see how we react in here.

Fibonacci retracement tool, moving averages, support and resis..My favorite timeframes: Weekly, Daily, 4hr, 1hr and some minutes.
You are currently seeing my analysis on a 1hr chart.
As told, focus should only be only the following:
-Fibonacci Retracement tool (38.2 and 61.8 ratios).
-Moving Averages (simple moving average and exponential moving average)
-Support and Resistance levels (connect @least 2 or more points).
-Supply and Demand Zones.
-Candlestick Patterns.
-Trendline Strategy (connect @ least 2 or more points).
*also watch out for chart patterns.

XAGUSD Double Top Pattern – Bearish Reversal Targeting $22 Zone"
🔎 Key Zones and Annotations Explained
🟥 Resistance Level (Supply Zone):
Marked in red, this level represents a historical supply area where sellers consistently outweigh buyers.
Multiple rejections from this zone confirm its strength.
🔄 RS Interchange (Support-Turned-Resistance):
This area around 26.00 – 27.50 has previously acted as support and could now act as resistance if price attempts to retrace upward after breaking down.
📉 Bearish Projection Path:
A potential price trajectory is illustrated with a zigzagging downward pattern, reflecting corrective moves and retests.
If the neckline is breached convincingly, this projection suggests continued bearish follow-through toward the 22.00 region.
🎯 Trade Setup and Risk Plan
Entry Trigger:
Short position considered after confirmation of neckline break (~29.50), ideally on a weekly candle close below this level or a successful bearish retest of broken support.
Stop Loss Placement:
Above the resistance highs at 35.57, which would invalidate the double top and signal possible trend continuation.
Profit Target:
Based on the measured move of the double top (height from resistance to neckline), we target the 22.42 – 22.46 region.
This aligns with previous support and a psychological round level, making it a strong candidate for price reaction.
⚠️ Risk Management Considerations
Always use defined position sizing and risk-reward ratios. A minimum of 1:2 RR is recommended.
Confirm breakdowns with volume spikes, momentum divergence, or break of trendlines for added confluence.
Keep an eye on macroeconomic data (like inflation rates, Fed interest rate decisions, and USD index strength) which can heavily impact the value of precious metals like Silver.
📘 Educational Insight: Why Double Tops Work
The double top is a psychological failure pattern. The first top attracts buyers expecting a breakout, but when price returns to that level and fails again, it often triggers mass liquidation and new short entries, especially when the neckline support fails. This builds downward momentum, making it a favorite pattern among swing and position traders.
🏁 Conclusion
This weekly chart of XAGUSD paints a clear picture: Silver may have topped out in the short-to-mid term. If the double top confirms and neckline breaks, expect a sizable correction back into the lower $20s. The risk is clearly defined, and the reward potential is high. Patience and confirmation are key.
💬 What Do You Think?
Do you agree with this bearish outlook on Silver? Are you waiting for confirmation before entering? Drop your thoughts or analysis below!
📌 T ags/Hashtags
#XAGUSD #Silver #DoubleTop #TechnicalAnalysis #ChartPatterns #SwingTrading #Commodities #PriceAction #Forex #BearishSetup #Metals #TradingView #GoldAndSilver #ShortTradeSetup

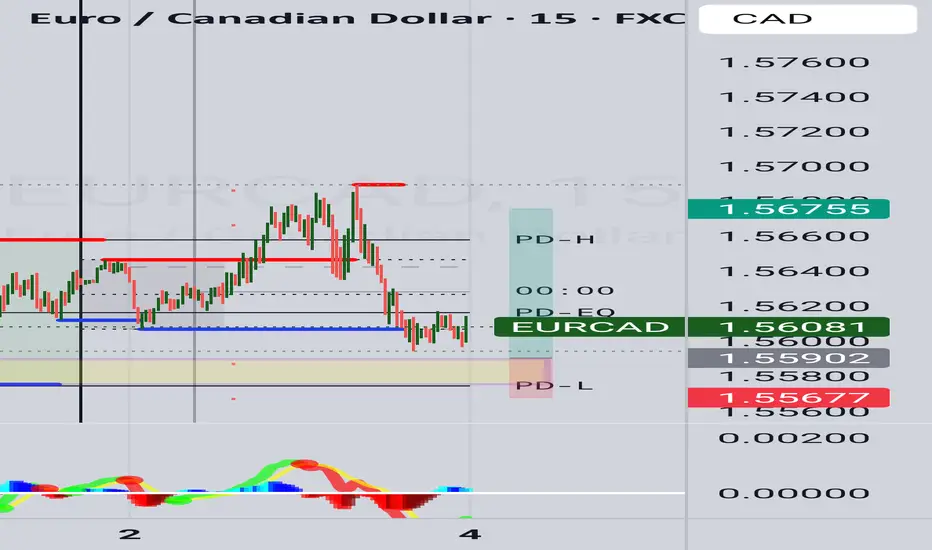
EurCadLooking at a drop to the previous low on open and a ride toward the upside for a 15min. With TP1- 1.5635, tp 2- 1.5685, TP3- 1.57. Above TP 3 is a inducement for a higher time frame
EURJPY - 05.05.2025 - 09.05.2025EURJPY - 05.05.2025 - 09.05.2025
I am looking for short in EURJPY this week.

Candlestick Reversals vs. IndicatorsA simple question to think about. Do indicators make charts too confusing, have mixed success, and ultimately fall victim to whipsaw with an occasional big winner?
Would it be better to use an indicator free daily chart and just observe the buyer and seller psychology that candlesticks offer?
Candlestick patterns are powerful. Especially when you observe them around areas of price congestion, support or resistance.
I would love to hear some opinions on these questions. For and against my thoughts.

APPL - Another pattern associated with 69I have many ideas where I talk about 69\96 indicating local and global price reversals. Here we were additionally shown 99, which means strong growth. I'm going to fixate on the imbalance overlap. See attached ideas

RSR Bearish Head and Shoulders Pattern Confirmed🚨 SEED_DONKEYDAN_MARKET_CAP:RSR Bearish Head and Shoulders Pattern Confirmed 🚨
SEED_DONKEYDAN_MARKET_CAP:RSR has formed a bearish head and shoulders pattern and has already broken below the purple neckline. This indicates a potential for further downside movement. However, if the price breaks out above the red resistance zone (the right shoulder), the bearish structure could change and become bullish.
📈 Technical Overview:
Pattern: Bearish Head and Shoulders
Neckline: Purple level, already broken.
🔻 Potential Downside: Further downside movement possible.
Bullish Invalidation: If the price breaks out above the red resistance zone (right shoulder), the bearish pattern may be invalidated, and the trend could turn bullish.
Keep an eye on the price action for further developments and confirmation of either continued bearish movement or a bullish reversal.
