DXY 1Hr Analysis, London Close Friday 1/28/22Wow, what a move this week by USD
Expecting us to come back for liquidity to
96.95. It is possible this Dollar trend may just keep going
but usually the weekly candle crossover provides some bout of
liquidity
Bias

USDCAD Bearish Bias to 1.267 price point on the 4HR ChartLooking for USDCAD to respect 127.5 Price Point on the Daily
Anticpating a pullback to 1.26700 on the 4hr
Really good risk to reward short during High volume
time (London Session Close) We''ll see what happens
This is a day trade, don't plan on holding it into asian
unless we are in a fair amount of profit

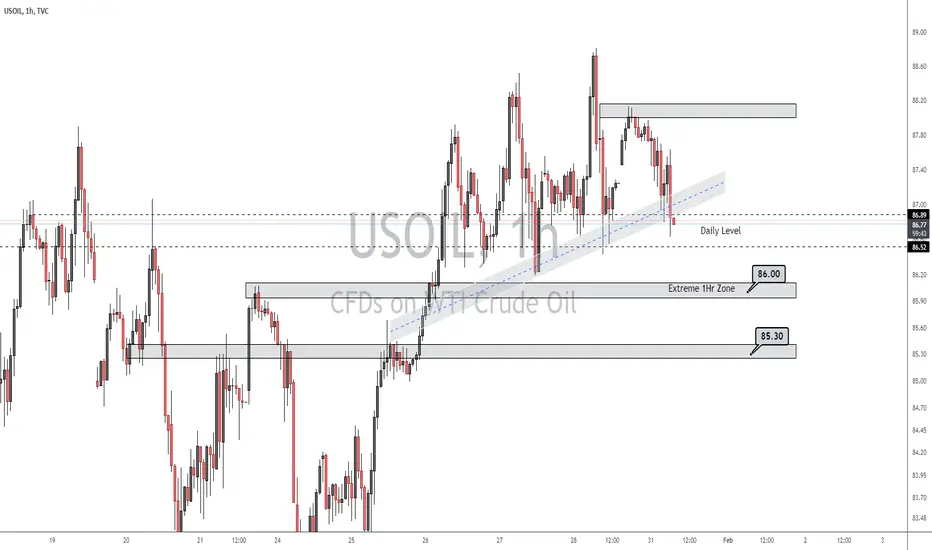
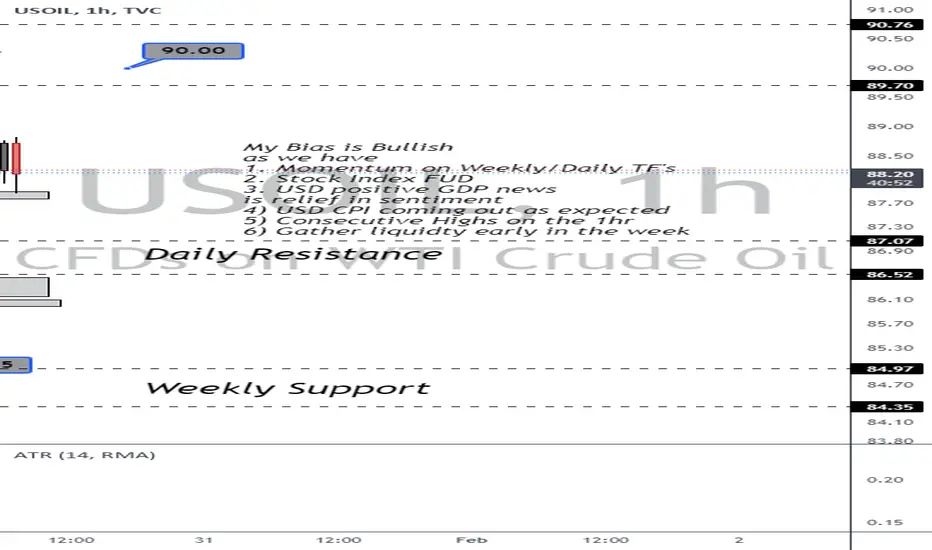
USOIL 1Hr Medium Term AnalysisI'm bearish on crude as we begin the week, in the medium term. We have been quite bullish on this
commodity. However it looks like we may correct to 86 and/or 85.30$ price point before
continuing our Bullish Ascent to 90$
EURUSD Sell Setup Idea, Trading with Higher Time Frame TrendHere we have a sell setup Idea, Selling at a 1Hr Zone Pullback
The Risk to Reward is worth it when trading with the trend.
Momentum is Bearish on the HTF's
We have a clean range to fill on the daily/weekly Timeframes down to 1.10
The USD Dollar is in Momentum
Stock Index fear has stabilized, but still has the market thinking twice. I believe I am correct
but I am okay witht he market proving me wrong
and will not fight the market if we decide to pullback hard bullish early in the week

GJ Bearish Bias, Daily Rejection, Looking for 153.5 on HTF'sWe have the first london session of the week go bullish
but nd up pulling back hard, back below 155 Psychological level on HTF's
I'm looking bearish, we have bearish market structure on this intraday chart
Anticpating USD strength as well, JPY being a safe haven, I expect them to move in unison

//EURUSD Final 4 Sessions of the Week, Avg RR 5.11:1, +7.33R //
Hello All, This ^^ is my Technical breakdown of Eurusd on the 3m Chart
I detail the Final 4 Trading Sessions of the Week and how I earned
+7.33R.
During this time period we had 2 USD Red Folder News Releases.
I review our last release of the week, USD CPI and How I used it
to get the price I wanted and earn +2R (2 Times my Risk)
If you have read this Far , I appreciate it.
We have quite a bit of news during the next week. Jan 31-Feb 4
Cheers to a good trading week and Safe Trading

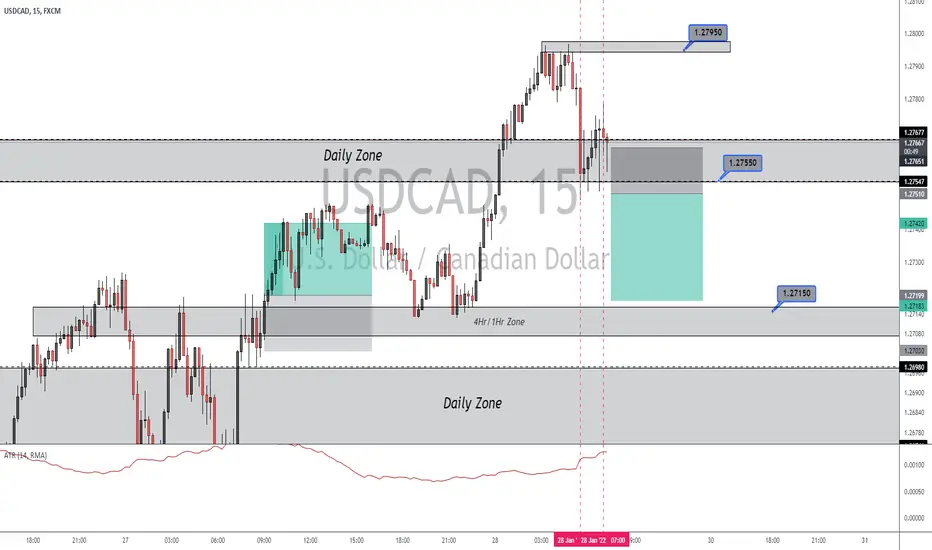
USDCAD Day Trade Idea // 15m TimeframeWe have Rejection from Daily Resistance that began during NY Open
This could just be liquidty for another Leg up in Trend Bullish.
However, I like Dollar weakness to finsh off the week.
This is a sell stop, SL about 14 Pips, same as 15m ATR
Bitcoin 4Hr Chart AnalysisIt Appears we are rejecting our Weekly Support
Level at 33,500
We can see a Range forming above the Lows which
Is a good sign for the Bulls
Holding 35K Psychological Price point. We have a few
scnearios that can play out.
1 We go Retest the Lows , which is where most Long term
and positions traders are looking, which I think is most likely.
2 We continue to Range on the 4Hr
3. Buyers step in on the Weekly and drive Price back up to 39,200 Price point

USOIL 1Hr Chart Friday NY Session, 88.20$Consecutive HH's on the 1Hr
Fakeout for liquidity back down to 86.75 yesterday duirng NY Session
to grab orders. Shouted out buys if your Bias is Bullish on crude in the "update section "
yesterday from 86.75
Intraday ATR increasing as we move into London Close, could see another leg here.
Or we reject to gather more liquidty for Sunday/Monday next week.
Anything can happen, always have a stop and a good Risk Reward
GJ Short Idea , NY Session Friday 4:1 RRAnticpating the weekly candle to pullback to 154
Fakeout during NYSE to gather liquidity
Tight 11 Pip SL on GBPJPY
anticpating London Close volkume to take us bearish
We got a solid bearish 1hr candle close at 154.5

EURUSD 4Hr Analysis, Week 4 2022Reasons listed on Chart for why Im bearish
Usually smart to trade with the trend
Unless market Structure Flips
and You get stopped out. Currently in a short here
We have a huge range on the Daily/Weekly TF's to clear
down to 1.105 and eventually 1.10

GBPJPY 4Hr Analysis, week 4 2022 We may come up to 155 on the Daily
We may Respect 154.500 Since we just closed below that
price point during the Pre-NY 4hr Candle.
I don't like it a whole lot, Staying out for the Time being
I had just taken a 5:1 RR position that got stopped out,
Trading in Line with my bias, Bearish , Due to the Daily/Weekly TF's
I'm still looking for a retest of lows, at 153.8 and 153.5

BTC ShortShort, trading with the Bearish Moomentum
on the HTF's, We have rejection candles at our Daily S/R Zone
I believe the RR is worth it, trading with the trend

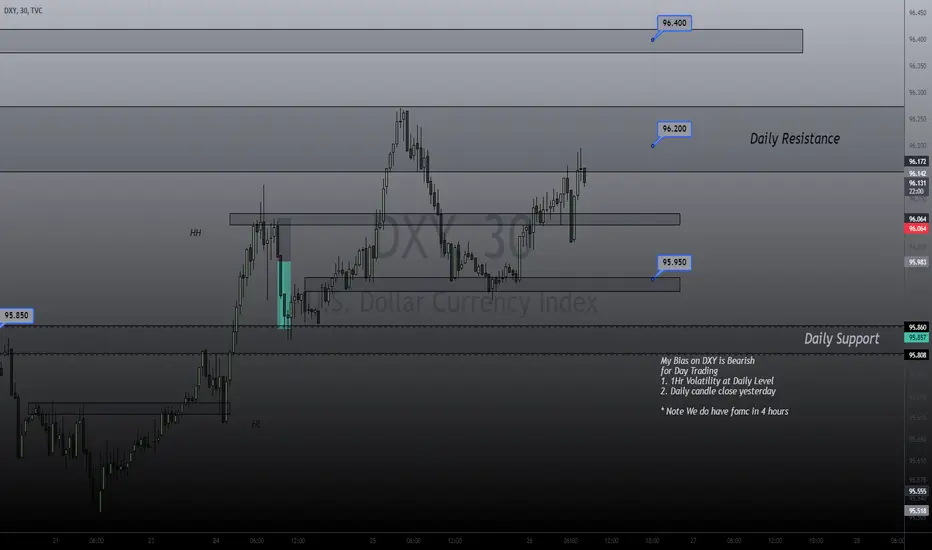
DXY Lower TF Rejection of Daily Resistance Level As we approach FOMC price is printing rejection candles off our daily zone.
This could all be liquidity for a move higher later during FOMC
Best to stay out of the market for the time being and possible scalp with your bias
if FOMC confirms your bias.
USDCAD 4Hr Analysis, Week 4 2022 Interest ratesBearish
based off past 2 sessions.
Also based off Weekly/Daily Market structure
I am bearish on this pair as we move into Interest Rates.
It appears we may have done a liquidty pullback as
the market prepares for the News.
If we go down i'm looking to scalp as we go down to 1.25250

EURUSD 4hr analysis2 Reasons why my bias has flipped on this pair with regard to day trading
Listed on chart
looking for
1.133 price point

US Oil 4Hr Analysis, Week 4 2022, Cad interest Rate DayWe are quite Bullish
The daily candle yesterday closed in a fashion
that validated longs to 90$ a barrel.
We are currently testing 4hr Resistance
It is most wise to wait for the Daily candle to close
or until asian session latter for any sells. For
buys, Fomc could be a catalyst for us to move out of
87$ and 88$ and continue on towards 90$ a barrel


EURUSD 4Hr Analysis, New York Session Jan-25Lots of bear momentum
Lots of fear in the Market
Price needs liquidity though to keep moving
We'll see what happens
We shall see how candles close at 1.128 Daily Zone on the 1Hr during NY and Asian Sessions
Rejection or close below. IF we pullback up, im looking for 1.13

DXY 2Hr Analysis, Jan 25 NY SessiomDaily Market Structure is Bullish
and Weekly
However Im looking for a pullback for liquidity in trend
If I am Wrong I will be quick to cut losses. Looking for the price point
96.50 as a target for any shorts

Which day of the month to buy LUNA at DCA? Our Quant Answer!In this idea we want to show our operation as a long term trader - further definition for the term "Investors" - in which we select - doing also fundamental analysis - assets with long term bullish Bias.
In some of our portfolios we have LUNA, which we buy every month in Dollar Cost Averaging (DCA).
As Quant Traders and Investors, we have developed the Bias Analyzer to help us decide the day of the month when we can get a statistically advantageous price.
We notice that between the 19 and 21 the price of LUNA tends to fall and therefore today, we can buy at market whenever we want, considering that the day is calculated at midnight UTC .
Also we can combine the BIAS information by looking at the graph where is presented:
- Fibonacci levels or Hosoda's 50% to find a good point: 0.382, 0.500, 0.618, 0.786
- Support and Resistances provided by Ichimoku/Chikou
If you would like to automatize or remind, feel free to use our Open-Source DCA Bot Indicator
How do you guys calculate your DCA entries?

Which day of the month to buy THETA at DCA? Our Quant Answer!In this idea we want to show our operation as a long term trader - further definition for the term "Investors" - in which we select - doing also fundamental analysis - assets with long term bullish Bias.
In some of our portfolios we have THETA, which we buy every month in Dollar Cost Averaging (DCA).
As Quant Traders and Investors, we have developed the Bias Analyzer to help us decide the day of the month when we can get a statistically advantageous price.
On the 21 and 27 the price of THETA tends to fall and therefore on these days, we can buy at market whenever we want, considering that the day is calculated at midnight UTC .
Also we can combine the BIAS information by looking at the graph where is presented:
- Fibonacci levels or Hosoda's 50% to find a good point: 0.382, 0.500, 0.618, 0.786
- Support and Resistances provided by Ichimoku/Chikou
If you would like to automatize or remind, feel free to use our Open-Source DCA Bot Indicator
How do you guys calculate your DCA entries?

BTCUSD : Not so fun times aheadThere's a ton of open float / liquidity collecting below equal lows of $28.7K - price is expected to reach there in a few weeks.
Below the liquidity grab, there are two open Fair value gaps which could support price.
Wait and watch.
