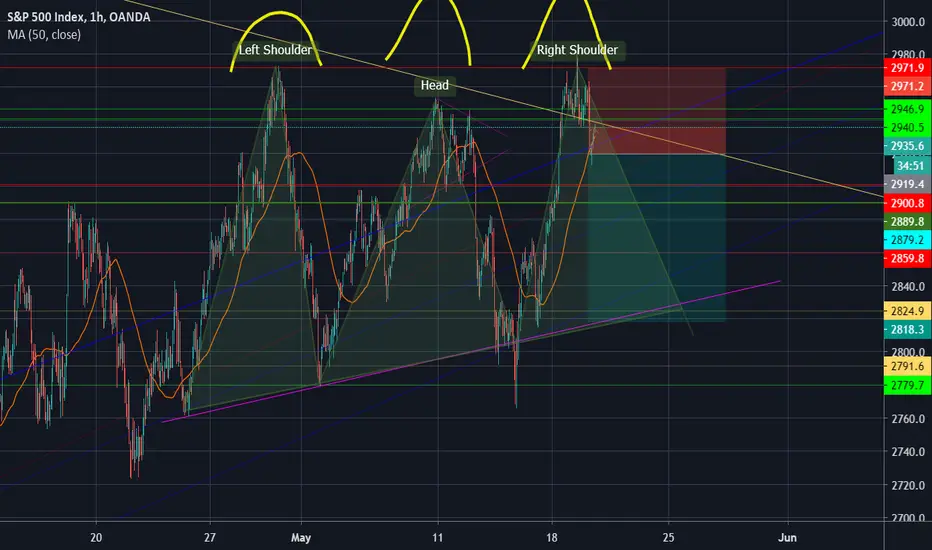
"The Real" Head and shoulder of the S&P ???I'm posting this as an idea, I thought that the head and shoulder was already here when we touched the 2780 level but we came back because the feds and Powell saying that they will do anything to keep the rally. Now this one (that I have in the picture) might come next week so I hope that the feds can't fight this really obvious technical indicator of a fall.
Or, I'm with a sell position and is just my bias of the trade trying to see and catch any false indicator of a big fall. (Although I'm pretty sure it won't go over 2971 or 2980 again).
Please let me know what do you think?!!!
Bias
GBPUSD LONG TRADE GBPUSD
This is my analysis for this trade, I post up all analysis on tradingview to keep track of my work.
On this pair i have a falling flag at the end of its run.
Break out forming the inverted head & shoulders.
now price has broken the neckline of the H&S looking for the retest to the go long.
i feel that price will consolidate for a period, then resume to the upside completing the Fibonacci pull back.

EURUSD, Trading the TrendLooking at the Euro’s value in US dollars (EURUSD) to find the general trend and potential entries and exits.
We can see historically, due to the momentum of the trend, that using a trend indicator like our Directional Bias Indicator has led to having a rather successful long./ short bias.
Above the yellow line, the bar color is green, and the bias is long. Below, bar color is red, and bias is short.
We always want to trade the direction of the trend, but in general, we will want to enter and exit positions along the trend as well.
To find entries and exits, we can use our Triggers indicator.
In an uptrend, we go long and take profits at L tp (purple arrow), and in a downtrend, we got short and take profits on S tp (blue arrow).
Likewise, if we want to find re-entry, we can look for the purple x marked L e for a long entry, and a blue x marked S e for a short entry.
In other words, we want to first and foremost listen to the long signals from Triggers in an uptrend and the short signals from Triggers in a downtrend.
Right now we have a long bias according to Directional Bias and a long entry according to Triggers. A cross below the yellow line means a short bias from Directional Bias and that means the long is invalidated. Otherwise, the bias from Triggers and Directional Bias is currently bullish on the US dollar against the Euro at the moment... although looking at how close we are to the previous range as defined by Directional Bias, that could change quickly.

GBPNZD GBPNZD, AGAIN I'AM LOOKING FOR MY FIBO LEVEL TO SELL IT FOR SWING , BUT TILL THEN ITS A LITTLE SCALP BUY.

AUD/USD - Short, with added confluence to make this move strongDaily Support created the illusion for people to go long, the stop losses just below.
Remember if you buy, your stop loss is a sell. You SELL your BUY position at a worse price!
China and Australia's economies are very tied together, due to the corona outbreak the AUD is tanking.
This added with the fuel from all the stop losses below the daily resistance zone create a good ammunition to take price down.
Plus breakout traders golden rule is usually trade support becoming resistance etc.
I entered after a pullback/retracement and break lower on 1hr.

200 EMA - best use for entries!I don't use indicators, they're not my style, they lag, they repaint; and in my opinion they don't work.
The 200 EMA on DAILY can be useful because of how slow it is. We can use it to filter the direction of which way we trade.
Price ABOVE 200 ema = ONLY BUY
Price BELOW 200 ema = ONLY SELL
Then drop timeframes for your entries via your strategy whatever that may be. If your strategy says go long but price is below EMA, don't take the trade etc...
Ignore the EMA on other timeframes lower than the daily. You want a slow daily direction indicator.
Don't blindly trade this, wait until price is clearly past the EMA and maintaining a good distance from it.
Use it as a guideline if you struggle working out fundamentals to help you filter a direction to trade.
NOT TO REPLACE FUNDAMENTAL ANALYSIS!!!

NZDUSD: RBNZ On The WayThe Reserve Bank of New Zealand will likely give the Kiwi a boost of volatility in the upcoming Asia session with its latest statement on monetary policy. Expectations are for no change this month as recent economic data has been net positive, and as they wait to see the full extent of damage the COVID-19 is set to do to the world economy. The scenario to watch out for is a more dovish-than-expected RBNZ and reversal pattern back to the downtrend after the event for the bearish market. For the bullish bias, any rhetoric lowering the odds of a potential rate cut this year will likely draw in buying support for the Kiwi, at least for the short-term as recent sessions have shown global positive risk sentiment as the main driver for the financial market. One news which might have earlier sparked some volatility on comdolls could be "WHO's Tedros, the first vaccine for COVID-19 (coronavirus) could be ready in 18 months".

Check you bias. You're confident no bearish continuationGot to see what both sides of the coin look like.
if this was the correct pattern, we could get 8800-9k or we could fake break up and drop.
We will see soon enough how this plays out.
If this plays out, you better come give me a like for charting the trend you didn't want to.

EurUsd Long IdeaLong idea...
bounce from support zone to blue line (target)..always managing trade according to developing price action

GBPAUD short opportunity Waiting for brake down and retest of this structure ( H1 ) to possible ride it down to 1.87 area. Watching developing price action.

INTRADAY TRADE: CAD/JPY BUY OPPORTUNITY82.70 is our pivot point.
Our Preference: The Upside prevails as long as 82.70 is support.
Alternative Scenario: The downside breakout of 82.70 would call for 82.90 and 82.36

NZDUSD shortWaiting for this rising wedge brakedown, retest of the structure and weekly level.
Stops have been taken out which is visible on Daily (blue line).
MACD divergence present over 3 peaks.( 3 drive pattern )
At least short term BIAS is bearish.
Watching price action to see how it develops, waiting for the brakedown.
If I dont see what I want to see then NO trade.

Educational Content : % based movement natural biasHope this idea will inspire some of you !
Don't forget to hit the like/follow button if you feel like this post deserves it ;)
That's the best way to support me and help pushing this content to other users.
Kindly,
Phil

XAUUSD 24.06.2019WEEKLY:
- possible retest of the trendline before further downside
- pair bounce on trendline twice (yellow sphere), thereafter, pair broke out (pink sphere).
- there could be a possible short opportunity if pair rejects the ascending trendline
- pair could spike to the 100% fib before continuing its downward mvnt
INVALID IF:
- weekly closure above the trendline
NB:
- watch DXY + SILVER for correlation.
- wait for upward momentum to decrease, therefore look for multiple rejections on the daily/ 4H time-frame before shorting
- wait for clear rejection on daily + 4H time frame before entering trade
- watch fundamental release prior to entering

XAGUSD 24.06.2019WEEKLY:
- rejected the descending trendline (3rd rejection) possible mvnt to the downside.
- anticipating 1-2 more rejections of the 61.8% fib level + trendline before shorting.
- possible spike to the 71%/ 78% fib level before pushing further down
DAILY:
TRADE = INVALID IF:
- daily closure above 61.8% + trendline

GOLD My Old Buddy 4H XAUSUD Short Term Bias Down IdeaIdea - Gold 4h Short term bias down, following blue line trend wedge short.
Please share, comment or add your opinion. Thank you, Nath
Join our Gold FX Collective Discord group - Here's your Invite discord.gg
Also live streaming on twitch, give a follow over at www.twitch.tv

24th of april gbpaud bullish setup.gbpaud rejected weekly zone (purple) and created new daily zone (green) and 4hr/1hr zone (yellow).

Psych Hack #0007 - decision-making - it's what we do. Everybody - I mean everybody - who is actively trading has to make decisions. Entry points, exit points, trailing stops, stop-losses and so on - they all involve decisions. But what affects the integrity of our decision-making ? Some say we don't need to make decisions, once we follow a mechanical trading plan. I disagree 100%. If everybody could follow a mechanical trading plan and be millionaires it would have happened already - it ain't happening! End of.
I say that our decisions are made in our heads - our brains, our minds. I say that I (we) need to know about the pitfalls in decision-making - pitfalls that may affect our minds.
I'm sharing some things I've learned with others. These may not be of relevance to everybody. However, as the hard evidence shows that between 75 and 90% of all traders lose money consistently, I think it should be of relevance to a majority.
Declaration : None of this is advice - even if so construed. Opinions on the two charts shown are not be relied upon. Your losses are entirely your own.


GBPNZD - Sun March 17This is a much longer term outlook on GBPNZD. As you can see on a DAILY time frame, price has been respecting the channel but in the past few weeks has been trying to breakout to the downside.
Looking at things from a technical perspective, I see the downside pressure winning this tug of war and taking price to the 1.7500 region.
Although, when you factor in the current state of affairs surrounding the Pound and Brexit... anything could happen.
This is strictly my opinion and I am not qualified to give financial advice. Trade at your own risk.
Happy trading :)
~TraderTrev

Possible GBP/JPY Short Position!!SMP TRADING
SELF DEVELOPMENT/METHODOLOGY/PSYCHOLOGY
Chart time frame - H4
Timeframe - 1-2 days
Actions on -
A – Activating Event
Market will meet resistance in zone @144.66 - .... and fall to the @141.200. In order to enter, the pair MUST be in line with my Entry Procedure....
B – Beliefs
Market move towards the first Target 1 level @ 141.400
FX:GBPJPY
Trade Management
Entered @ Sign up for mentoring
Stop Loss @ Sign up for mentoring
Target 1 @ 141.200
Target 2 @ ....
Risk/Reward @ 4.1
Happy trading :)
Follow your Trading plan, remain disciplined and keep learning !!
Join our Mentoring Program TODAY!! twitter.com
Please Follow, Like,Comment & Follow
This information is not a recommendation to buy or sell. It is to be used for educational purposes only!

SRT, Force Trends18th Feb - (p=227,355/l=282,215)
This pair is running a circus with tension on reversing. We have formed trendlines channels and I expect yet another to be formed inorder for a new uptrend to officially emerg. Previous trend continuation price action has been a failure however if we break low we are going to have a good downtrend.

EURUSD LONG BIASAfter a break above structure on Lower (1H) TF resulting in a bullish engulfing on the Daily TF, im expecting exhaustion to the psychological 1.13800 area where i will be waiting for bullish confirmation on a lower TF to enter long
