XRP / RIPPLE | 30M | IMPORTANT LEVELSFriends,
I valued your requests and prepared the following Ripple analysis: If Ripple drops below the level of 2.1807 for 30 minutes, the target will be the 2.1424 level. This level holds a very significant support zone.
The most critical support level is located at 2.1085.
If Ripple does not fall below this support zone, my target level for Ripple will be 2.2495.
Please don't forget to like.
Thank you to everyone who supports with likes.
Bitcoin (Cryptocurrency)

TAO ANALYSIS📊 #TAOAnalysis
✅There is a formation of Descending Channel Pattern in daily time frame in #TAO .
Also there is a perfect breakout and retest. Now we can expect a bullish move. If the price sustains the major resistance zone then we will see more bullish move
👀Current Price: $349
🎯 Target Price : $460
⚡️What to do ?
👀Keep an eye on #TAO price action and volume. We can trade according to the chart and make some profits⚡️⚡️
#TAO #Cryptocurrency #Breakout #TechnicalAnalysis #DYOR

#BTC #BTCUSD #BTCUSDT #BITCOIN #Update #Analysis #Eddy#BTC #BTCUSD #BTCUSDT #BITCOIN #Update #Analysis #Eddy
I have identified the important support and resistance areas of the weekly timeframe for you.
I have identified the important resistance prices for the start of the decline with the red line and the important support prices for the start of the growth with the green line.
This analysis is based on a combination of different styles, including the volume style with the ict style.
Based on your strategy and style, get the necessary confirmations for this analysis to enter the trade.
Don't forget about risk and capital management.
The responsibility for the transaction is yours and I have no responsibility for your failure to comply with your risk and capital management.
💬 Note: An important analysis will be presented on the lower timeframe on Bitcoin soon, which, based on the chart and explanations sent in that analysis, you can hunt for Bitcoin's decline by getting confirmation, pay attention to the current chart and consider important liquidity, including the Decision and Extreme areas.
Be successful and profitable.
For altcoins, proceed according to my analysis on the Total 3 chart.
My analysis of the Total 3 chart:
You can also view and review my previous analyses on my TradingView page.
Please don't forget to like and follow, your support encourages me to continue on my path and provide more analysis and updates.

BITCOIN - Price can exit from wedge and rise to $100K levelHi guys, this is my overview for BTCUSDT, feel free to check it and write your feedback in comments👊
Some days ago price reached resistance line of triangle and then, in a short time, declined to $80300 level.
Price broke $92000 level and then some time traded inside triangle, where it reached this level again and then corrected.
Later BTC exited from triangle and entered to wedge, where it first declined below $80300 level, but later turned back.
Then it continued to move up inside wegde, where it later made correction to support line and then rose to $92000 level.
Soon, price broke this level and even reached resistance line of wegde, after which it corrected and continues to rise.
Possibly, price can bounce up from support area to $100K, thereby exiting from wedge pattern.
If this post is useful to you, you can support me with like/boost and advice in comments❤️

Bitcoin Trading and Investment Strategy (April 2025)Bitcoin (BTC) is trading around the mid-$90,000s after rebounding ~25% in April, with market sentiment shifting to greed. BTC’s dominance is high (~64%) as capital concentrates in Bitcoin over altcoins. On-chain data shows large holders (“whales”) aggressively accumulating, even as short-term traders turn optimistic. Below is an actionable strategy.
BTC broke out of a multi-month falling wedge pattern, signaling a potential bullish reversal. On the 1H/4H charts, momentum is bullish: a textbook double-bottom formed on the daily with a neckline around $87,600 was breached, confirming upside targets near $100,600.
A bull pennant consolidation is visible on the 1H after the sharp rally, hinting at another leg up (measured move target ≈ $100,900 on breakout). Short-term EMAs (20/50) on 1H/4H have turned upward and are stacked bullishly, aligning with the daily 50 and 200 EMAs which have flipped into support. The Relative Strength Index (RSI) is in bullish territory without extreme overbought readings, leaving room for further upside. Volume has been steady to rising on upward moves, indicating buyers remain in control.
Immediate support lies at the breakout zone of GETTEX:87K –$90K (prior resistance now turned support). This area includes the daily double-bottom neckline (~$87.6K) and coincides with the top of the earlier consolidation range. Bulls want to see this zone hold on any pullback. Below that, secondary support is around $84K and roughly the 4H 200 EMA area.
Resistance is clustered at $94K–$95K (recent local high region). A 4H close above $95K with strong volume would likely trigger momentum buyers. Beyond there, $100K is a major psychological level and the short-term target from multiple patterns – importantly, a dense cluster of short seller liquidation levels sits around $100K, making it a “liquidity magnet” for market makers. Expect heavy order flow and possible volatility as BTC approaches six figures. Above $100K, minor resistance could appear near ~$102K (projected wedge target), then prior ATH ~$108K–$109K.
For longs, scale out profits in layers as BTC advances. First TP around $100K – just before the round number – to avoid slippage if a wave of selling hits there. If momentum is very strong, hold a portion for a possible extension to $102K–$105K (wedge target zone). A stretch goal for bulls would be the $108–$110K area (all-time high region), but tighten stops well before this level as profit-taking is expected near ATH.
If BTC falls back under the GETTEX:87K neckline after having broken out, it would negate the double-bottom breakout and likely accelerate downward. Thus, stop-losses for longs can be placed just below GETTEX:87K (e.g. $86K) to cap risk.
The breakout from the wedge/base was accompanied by a surge in volume, confirming institutional participation. Volume has not dried up on this rally – a positive sign that the trend could sustain. Overall, the daily chart structure sets the stage for a potential run back to five-figure territory (100K+), provided key support levels are defended.
Any dips into the high-$80Ks are buy-the-dip opportunities as long as BTC quickly reclaims $90K. Below GETTEX:87K , the next critical support is $80K–$84K. $84K was highlighted as a crucial level – failure to hold 84K during the last pullback would have signaled capitulation. It held then, so watch it on any retest.
Stop Loss:
Short-Term: 5–10% below entry ($90,000 for $92,500 entry).
Mid-Term: 10–15% below entry ($85,000 for $91,000 entry).
Long-Term: Monitor support ($80,000) but hold unless fundamentals deteriorate.
Position Sizing:
Short-Term: 1–2% of portfolio per trade.
Mid-Term: 5% of portfolio.
Long-Term: Up to 10% of portfolio.
Risk/Reward: Target 2R for short-term, 3R for mid-term, and let long-term investments ride based on fundamentals.
Not a financial advice. DYOR.

TradeCityPro | Bitcoin Daily Analysis #74👋 Welcome to TradeCity Pro!
Let's move on to Bitcoin and major crypto index analysis. As usual in this analysis, I want to review the triggers for the New York futures session for you.
⏳ 1-Hour Timeframe
In the 1-hour timeframe, as you can see, after the price was rejected from the 95306 area, it formed a short-term box between 93898 and 95306, and currently, the price is moving out of this box.
✔️ As you can see, after a large red candle and a second rejection from 95306, a lot of bearish momentum and selling volume entered the market, and now the price has broken the 93898 support. If the price stabilizes below this level, there is a possibility of a deeper correction down to 91945.
💥 The SMA99 indicator overlaps with the 93989 area, and if this PRZ (Potential Reversal Zone) formed by the price is broken, the probability of a further drop will increase.
⚡️ The RSI oscillator has also activated its divergence, and now we are seeing the effect of this divergence in the market. For a short position, if the 93898 area is broken, we can enter.
📈 For a long position, if the 93898 area gets faked out, we can enter a long with a fake breakout trigger in lower timeframes. The main trigger for a long is the break of 95306.
👑 BTC.D Analysis
Let's move on to Bitcoin Dominance. There is still a ranging box between 64.19 and 61.60, and the price is fluctuating between these two levels.
✨ Currently, confirmation for bullishness comes with a break of 64.60 or 64.41, and bearish confirmation comes with a break of 64.19.
📅 Total2 Analysis
Moving on to Total2, a ranging box has formed in this index between 1.03 and 1.05. These areas are suitable triggers for opening positions.
🧩 For a long position, a break of 1.05 could start the next bullish leg, with a target of 1.07.
🔽 For a short position, with a break of 1.03, the price could make a corrective move.
📅 USDT.D Analysis
Moving on to Tether Dominance, it is still struggling with the 4.99 support area and hasn't been able to stabilize below it.
📊 As long as this support holds, the next bullish leg in the market will not start. On the other hand, as long as dominance is below 5.14, the market trend remains bullish.
❌ Disclaimer ❌
Trading futures is highly risky and dangerous. If you're not an expert, these triggers may not be suitable for you. You should first learn risk and capital management. You can also use the educational content from this channel.
Finally, these triggers reflect my personal opinions on price action, and the market may move completely against this analysis. So, do your own research before opening any position.

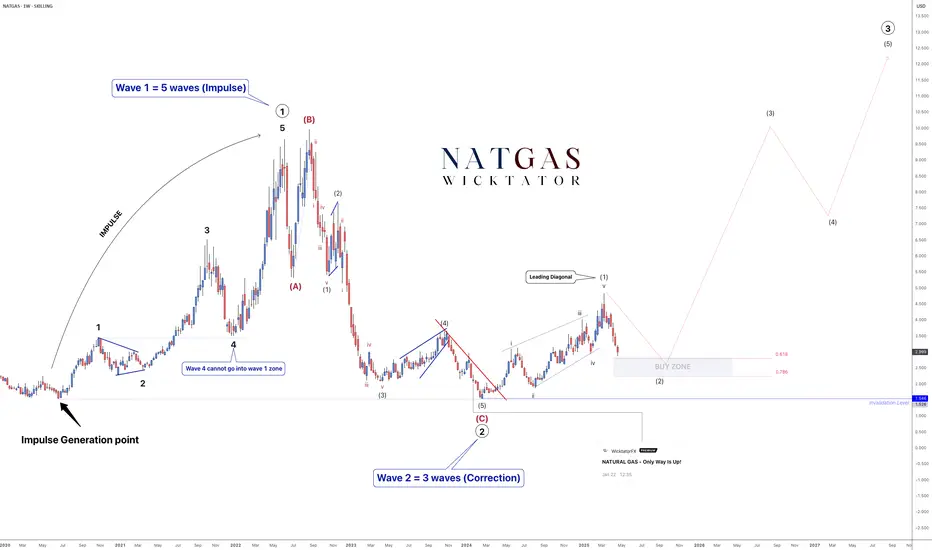
NATGAS Elliott Waves – Preparing for a Multi-Year Rally!Following our last post on Natural Gas, we have now seen a breakout, suggesting the start of a larger bullish wave — a move that could last multiple years.
From a technical perspective:
- Wave 1 (5-wave impulse) is complete.
- Wave 2 (ABC correction) is also complete.
- We are now in Wave 3, which itself will form 5 subwaves.
Wave 3:
Subwave 1 of Wave 3 has formed as a leading diagonal.
We are now in Subwave 2, which typically retraces around 61.8% of Subwave 1.
Our buy zone is positioned around this retracement area, and we will be looking for a lower timeframe breakout to confirm entries.
Important note:
Subwave 2 could form a more complex ABC correction, so patience is required while it develops.
Trade Plan:
- Wait for price to reach the buy zone.
- Look for lower timeframe bullish confirmation (trendline break, BOS, structure shift, etc.).
- Enter after confirmation.
Stoploss Placement:
- Aggressive option: Below the corrective low.
- Conservative option: Below the broader invalidation level.
Targets: 8, 10, 12
See below for our last NatGas analysis:
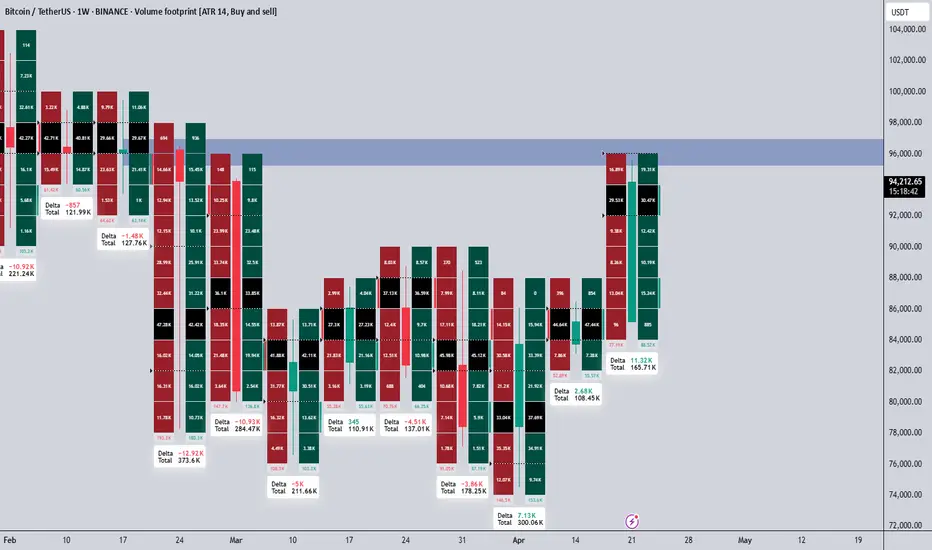
Market Recap | Last Week's Data Still Positive but Stay AlertLast week's data continues to paint a positive picture for the markets. Buyers are still clearly active based on the momentum we've observed. However, it's crucial to remember that markets are dynamic, and what looks strong today can shift quickly depending on upcoming news and developments.
📊 What the Data Tells Us:
Buyers are in control. Demand has been supporting the price across key levels, preventing deeper pullbacks.
Momentum remains bullish for now, but there’s a sense of caution creeping in as traders anticipate next week's news releases.
No major cracks yet, but we cannot afford to be complacent. Smart traders always stay flexible.
⚡ What's Next?
Until fresh news hits the market, buyers have the upper hand. But remember: your biggest strength is adaptability. Stay ready to pivot if next week’s developments shift sentiment.
Trust the data, but always respect the changing nature of the market. Confidence is good, but awareness is better.
📌I keep my charts clean and simple because I believe clarity leads to better decisions.
📌My approach is built on years of experience and a solid track record. I don’t claim to know it all but I’m confident in my ability to spot high-probability setups.
📌If you would like to learn how to use the heatmap, cumulative volume delta and volume footprint techniques that I use below to determine very accurate demand regions, you can send me a private message. I help anyone who wants it completely free of charge.
🔑I have a long list of my proven technique below:
🎯 ZENUSDT.P: Patience & Profitability | %230 Reaction from the Sniper Entry
🐶 DOGEUSDT.P: Next Move
🎨 RENDERUSDT.P: Opportunity of the Month
💎 ETHUSDT.P: Where to Retrace
🟢 BNBUSDT.P: Potential Surge
📊 BTC Dominance: Reaction Zone
🌊 WAVESUSDT.P: Demand Zone Potential
🟣 UNIUSDT.P: Long-Term Trade
🔵 XRPUSDT.P: Entry Zones
🔗 LINKUSDT.P: Follow The River
📈 BTCUSDT.P: Two Key Demand Zones
🟩 POLUSDT: Bullish Momentum
🌟 PENDLEUSDT.P: Where Opportunity Meets Precision
🔥 BTCUSDT.P: Liquidation of Highly Leveraged Longs
🌊 SOLUSDT.P: SOL's Dip - Your Opportunity
🐸 1000PEPEUSDT.P: Prime Bounce Zone Unlocked
🚀 ETHUSDT.P: Set to Explode - Don't Miss This Game Changer
🤖 IQUSDT: Smart Plan
⚡️ PONDUSDT: A Trade Not Taken Is Better Than a Losing One
💼 STMXUSDT: 2 Buying Areas
🐢 TURBOUSDT: Buy Zones and Buyer Presence
🌍 ICPUSDT.P: Massive Upside Potential | Check the Trade Update For Seeing Results
🟠 IDEXUSDT: Spot Buy Area | %26 Profit if You Trade with MSB
📌 USUALUSDT: Buyers Are Active + %70 Profit in Total
🌟 FORTHUSDT: Sniper Entry +%26 Reaction
🐳 QKCUSDT: Sniper Entry +%57 Reaction
📊 BTC.D: Retest of Key Area Highly Likely
📊 XNOUSDT %80 Reaction with a Simple Blue Box!
📊 BELUSDT Amazing %120 Reaction!
I stopped adding to the list because it's kinda tiring to add 5-10 charts in every move but you can check my profile and see that it goes on..
BTC - Golden Pocket Confluence + FVG Sweep = Long SetupA highly refined scenario blending Fibonacci confluence with liquidity principles, setting up a controlled bullish play.
---
1. Golden Pocket + FVG Confluence — Critical Demand Zone
The blue highlighted area represents a strong confluence:
- FVG (Fair Value Gap): Imbalance left by aggressive price movement, likely to attract price for rebalancing.
- Golden Pocket: The 0.618–0.65 Fibonacci retracement zone, statistically favored for deep retracements and high-probability reversals.
Expecting strong buying interest once price taps into this confluence.
---
2. 0.618-0.65 Fib Range — Key Reversal Territory
The Fibonacci zone offers the perfect environment for engineered liquidity sweeps and smart money accumulation.
- This range often acts as a trap for retail shorts while institutions accumulate.
- A clean entry opportunity arises as price dips into this critical golden zone before expansion.
---
3. FVG Resistance Above — Initial Reaction Zone
A notable FVG resistance area is marked around 94,400–94,500:
- Upon reaching this zone, price may face initial selling pressure or short-term consolidation.
- Observing how price interacts here can further confirm bullish strength and continuation.
---
4. Smart Money Liquidity Play
The setup suggests a classic liquidity engineering move:
- Induce shorts through a pullback into the Golden Pocket.
- Absorb liquidity inside the FVG.
- Trigger a sharp bullish reversal aligned with institutional footprints.
This layered setup is clean, logical, and methodical.
---
5. Projected Price Flow
Anticipated price action structure:
- Step 1: Dip into the Golden Pocket + FVG demand zone.
- Step 2: Reversal toward the FVG resistance.
- Step 3: Breakout continuation upon reclaiming resistance, leading to further bullish expansion.
Each leg is mapped to follow high-probability liquidity behavior.
---
6. Summary:
- Golden Pocket + FVG = Prime Reversal Confluence
- Efficient Liquidity Sweep Mechanics
- Structured Bullish Progression Based on Smart Money Concepts
This plan is framed to capitalize on precision entries and liquidity dynamics without chasing price.

BTC Is Still Bullish (4H)This analysis is an update of the analysis you see in the "Related publications" section
Bitcoin is still struggling with the supply zone we identified in the previous analysis. It has not yet been able to establish itself above this supply area.
A slight correction is expected, with support anticipated from the green box.
The closing of a 4-hour candle below the invalidation level will invalidate this analysis.
For risk management, please don't forget stop loss and capital management
Comment if you have any questions
Thank You


btc . w4 - wknd . SHORT but cautious - yet paytientfriday plan, was to SHORT (see prvs post)
sell zone
starts . friday open
ends . monday open
entry . 95.542
sl . -2.62%
10 sell orders . 1.52% spread
tp1 . 91.642 . +3.99%
funding . +0.01%
we are according to plan + collecting funding
tp1 adjusted to moderate, since bullish outlook coming from april.
tp2 . +10.11%

Bitcoin: The Path To 109K Is Now Open.In my previous article I describe the potential breakout if 88K was compromised. I pointed out, the compound double bottom in the 74 to 78K area implied a greater probability of price breaking out, it was just a matter of catalyst. IF anything this possibility should have told you that swing trade shorts are a lower probability and much riskier within that resistance zone. For those of you looking for precise calls, eventually you will learn there is no such thing, because markets adjust to new information as it becomes available but we can assign loose probabilities to scenarios. So what technical possibilities are we looking at for the upcoming week and how will this shape our expectations?
On my chart, the updated anticipated scenario (See illustration) points to a retrace back to the 90K area which is NOW a support. Since the broader trend is bullish it is within reason to expect this support to HOLD and NOT break. That means it is an ideal location for high probability swing trade longs UPON confirmation. Watch 93,250 break (see blue arrow) to confirm price is following the retrace scenario (break of previous candle low). IF this is not broken, then the retrace scenario is NOT in play.
Another fact I want to point out is a new minor impulse structure is now in effect (it is not numbered on the chart). The move from the 74K low to the current high contains 3 waves which means the next retrace is likely Wave 4 which would then open the possibility for the Wave 5 breakout beyond the 95K area. Wave 4 to 5 is the highest probability wave to anticipate because it requires 3 waves to be in place and has to adhere to the Wave 1 overlap rule. While this does not offer a specific setup to trade, it does help to shape a clear expectation. All you need from there is a system or method to confirm the bullish reversal (like the Trade Scanner Pro).
Other than that, If Bitcoin manages to maintain the support above 90K, this new rally may be the broader Wave 5 that I have talked about previously which implies a test of 109K over the next quarter. Again this is a game of gauging potential and then quantifying the risk that is associated with it. That is only the beginning of the trade idea because from there you must have a decision making process in place to manage the trade in a constantly CHANGING environment. IF you fail to have such a process then you face random results.
Thank you for considering my analysis and perspective.

BITCOIN Breakout Confirmed - Is $106K the Next Stop?COINBASE:BTCUSD is displaying strong bullish momentum after breaking decisively above the key $90,000 level. This breakout occurred after a well-defined double bottom formed around the major support zone near $74,000. The inability to create a new low and the sharp rejection from that zone confirmed strong buyer presence and marked a clear exhaustion of sellers.
The market is now following through with a solid bullish impulse, pushing past intermediate resistance and confirming the continuation of the ascending channel structure. With buyers stepping in aggressively and price respecting bullish market structure, Bitcoin now appears poised to reach the next significant resistance zone around $106,000, which also aligns with a big resistance level.
From a fundamental perspective, Bitcoin is gaining strength due to several key macroeconomic shifts. The recent escalation of trade tariffs by the Trump administration has heightened economic uncertainty, driving investors to seek alternative assets outside traditional markets. Historically, Bitcoin has thrived during such periods of instability, acting as a hedge against fiat volatility and centralized policy manipulation.
Adding to this backdrop, global central banks continue tightening monetary policy, increasing fears of a recession. As inflation remains sticky and growth slows, capital is flowing into assets with limited supply and no centralized control, reinforcing Bitcoin’s position as digital gold.
Meanwhile, institutional adoption continues to climb. Spot market activity is increasing, and institutional investment vehicles are seeing significant inflows. Improvements in regulatory clarity and market infrastructure are reducing barriers, allowing larger players to participate confidently. This deepening institutional interest is providing a strong foundation for sustained price movement toward $106,000.
The convergence of powerful technical patterns, especially the confirmed breakout and continuation within the ascending channel, along with strong macro and institutional support, points to a likely continuation of Bitcoin’s upside momentum.
Traders should closely monitor confirmation signals, such as bullish volume surges, strong candle closures above the $90,000 breakout level, and continuation patterns forming on lower timeframes to validate this scenario.
Feel free to share your thoughts or add further insights into this analysis!

INJ Is Nearing An Important SupportHey Traders, in today's trading session we are monitoring INJ/USDT for a buying opportunity around 9.90 zone, INJ/USDT is trading in an uptrend and currently is in a correction phase in which it is approaching the trend at 9.90 support and resistance area.
Trade safe, Joe.

Bitcoin —Short-Term Retrace (Drop) Or Higher Next?Look at this, this is Bitcoin on the daily timeframe. I will keep it short, sweet and easy.
Bitcoin broke up 22-April and has been sideways since with an upward bent. When Bitcoin is set to drop, it drops the next day.
It has been four days and Bitcoin is going up, no retraces. This indicates that the next move will be a big, very big, green candle. No significant drop so far.
A drop would mean prices moving below 90K. Wicks lower or higher are not relevant and consider noise only. Not a drop nor a rise.
The next major move is up. Bitcoin is going up.
The action on the chart reveals higher prices.
The action coming from the Altcoins market reveals a major advance happening in the coming days.
Four days not lower but higher.
The 2-March high, the highest price since the first drop below 90K has been compromised. There was no strong rejection nor selling pressure.
This is a strong resistance level, $95,000. As soon as it gets conquered, Bitcoin will move straight up to $100,000.
Very easy, simple, short and sweet.
Bitcoin is going up. Buy and hold.
Buy and hold. I repeat.
Orange is the target zone. Short-term. Up next.
Namaste.

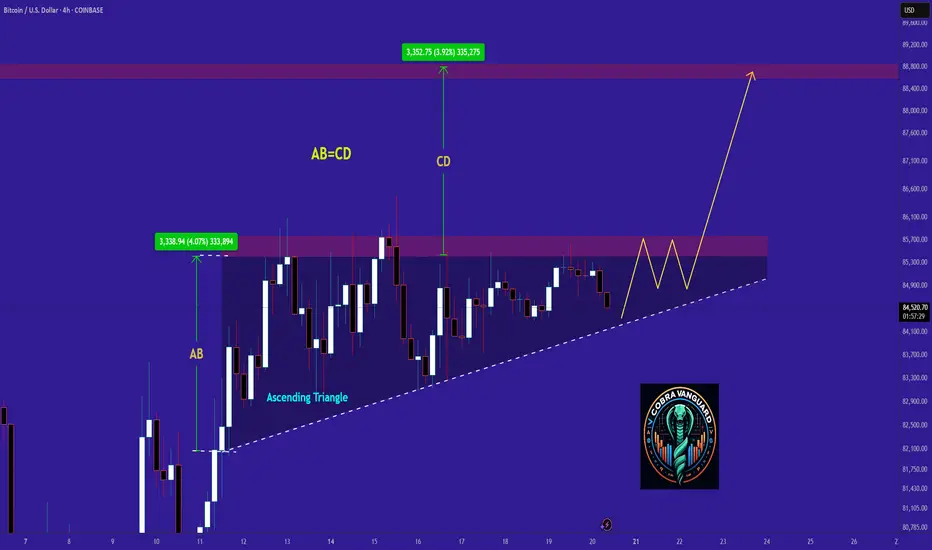
BITCOIN Ready for PUMP or what ?Currently, COINBASE:BTCUSD is forming an ascending triangle, indicating a potential price increase. It is anticipated that the price could rise, aligning with the projected price movement (AB=CD).
However, it is crucial to wait for the triangle to break before taking any action.
Give me some energy !!
✨We spend hours finding potential opportunities and writing useful ideas, we would be happy if you support us.
Best regards CobraVanguard.💚
_ _ _ _ __ _ _ _ _ _ _ _ _ _ _ _ _ _ _ _ _ _ _ _ _ _ _ _ _ _ _ _
✅Thank you, and for more ideas, hit ❤️Like❤️ and 🌟Follow🌟!
⚠️Things can change...
The markets are always changing and even with all these signals, the market changes tend to be strong and fast!!
$BTC - Weekend OutlookBitcoin just tapped into the major overhead supply zone 95k, which corresponds to the breakdown origin of the previous range.
Notably, we observed the highest Coinbase premium in recent sessions, signaling aggressive spot-driven demand. However, a sell wall is starting to build around 95k and 97k, suggesting that short-term sellers are positioning here.
Key support to watch : the 88k–86k range, which marks the recent breakout base and vwap.
Holding this zone would validate the breakout structure and set the stage for further continuation to the upside. Failure to hold likely triggers a deeper retest toward mid-range levels.
Expect volatility over the weekend as price oscillates between overhead supply and this critical breakout support.

Bitcoin correction. Waiting for 70k-76kBitcoin correction. Waiting for 70k-76k
The previous idea suggested Bitcoin would reach $95,000-$100,000 before entering a 1-2 year bear phase alongside the U.S. stock market decline.
Bitfinex:
However, based on Coinbase orders in the $70,000-$76,000 range and recent BTC sell-offs on Bitfinex over the past three days, it looks like this correction is being dragged out to trigger more liquidations.
This crypto correction might also align with an SP500 drop. Waiting for lower levels to find good entry points.
Coinbase orders:
BTC/USDC Liquidation Heatmap

EURUSD - Bullish Shift after IFVG? This chart outlines a clean sequence of bullish intent where institutional accumulation is visible through structure, inefficiency, and reactive zones.
---
1. Support Zone Holds — Demand Confirmed
The previous resistance area has now clearly flipped into support , marked by multiple wicks rejecting lower prices.
- This region is a high-probability demand zone engineered through earlier consolidation.
- Price returned to this level, swept minor liquidity, and immediately bounced—confirmation that demand is active.
---
2. Fair Value Gap (FVG) — The Imbalance Magnet
A clean FVG sits above price, created during the prior bearish leg. Now acting as a rebalancing zone.
- Price is pushing into this inefficiency after finding support.
- The gap inversion (price reclaiming and holding above the FVG) would validate bullish continuation.
- Think of this as the mid-point between structure and expansion.
---
3. BSL Above — The Next Liquidity Target
A key Buy Side Liquidity (BSL) level is marked higher, acting as the next logical draw for price.
- Smart money seeks liquidity above recent swing highs.
- If price holds above the FVG, this BSL becomes the magnet for bullish expansion .
---
4. Projected Price Action Flow
The roadmap is clear and logical:
- Step 1: Bounce from support (done)
- Step 2: Push through and hold the FVG
- Step 3: Expand higher toward BSL
Each leg has purpose, and the structure confirms smart money is in accumulation mode.
---
5. Summary:
- Support + FVG + BSL = Structured Bullish Thesis
- As long as price stays above the FVG post-inversion, buyers have control.
- This is a textbook case of price engineering via inefficiency and reactive structure.

TradeCityPro | Bitcoin Daily Analysis #73👋 Welcome to TradeCity Pro!
In this analysis, I want to give you a complete review of Bitcoin. There are just a few days left until the monthly candle closes, and it’s been a while since I analyzed higher timeframes for you, so it’s a good time to do that now.
📅 Monthly Timeframe
In the monthly timeframe, it’s very clear that Bitcoin has a long-term uptrend, which is still ongoing. The new leg of this trend started from the 16162 bottom and has so far extended to 104857.
⚡️ In the past few candles, the price has entered a phase of correction and consolidation, which is perfectly natural and necessary for the trend’s health. However, because this is happening on the monthly timeframe and takes months, some traders and market participants might think the uptrend has ended.
✔️ First of all, Bitcoin’s uptrend has not ended yet. We’ve just seen two red monthly candles, and now with this month's candle, bullish momentum is reentering the market. I believe the price can register a new all-time high (ATH). Even if that doesn’t happen, remember that Bitcoin’s dominance is very high, and this bullish cycle won’t last forever—eventually, Bitcoin dominance will start to fall.
🔍 If that happens and the percentage of money inside Bitcoin decreases, this capital will shift into altcoins. With this large inflow of capital, an altcoin season will begin.
📊 My personal view is that Bitcoin will have one more bullish leg toward 130,000 or 180,000, and after that, dominance will start to drop and the altcoin season will begin. Initially, Bitcoin will move upward, followed by strong, large-cap altcoins like Ethereum, BNB, XRP, etc. After these big players rally, capital will shift into good low-cap projects, leading to the crazy crypto pumps we've seen in previous bull runs.
🔽 This is the scenario I find most likely. But if the market moves against this scenario and dominance shifts earlier or later, I will adapt accordingly without being rigid in my analysis.
✨ As for Bitcoin turning bearish, I think that’s very unlikely for now, and the triggers for that are still far away from the current price. If that scenario becomes more probable, I’ll update my analysis and discuss it.
In short, for Bitcoin to turn bearish, it would need to make a lower high and a lower low compared to 104000, and if a sharp downtrend is to happen, the price must establish below 58000.
📅 Weekly Timeframe
In the weekly timeframe, we can see the bullish movement in more detail. A bullish move started from the 16162 bottom and after three bullish legs, the price reached the 104857 resistance.
💫 Currently, the price is in the correction phase of the third bullish leg and had pulled back close to the previous high of 71520. After forming a bullish engulfing candle, bullish momentum has returned, and the price is moving back toward 104857.
🎲 The 104857 area overlaps with the 0.618 Fibonacci Extension, creating a strong PRZ (Potential Reversal Zone). If this high breaks, the next resistance levels are the 0.786 and 1 Fibonacci levels, roughly around 125000 and 155000.
👀 There’s also a visible trendline in this timeframe that the price has touched three times, and each time the trendline bottom coincided with RSI support. However, the last time the price touched the trendline, it made a fakeout, which can be observed both on the price chart and on RSI.
⭐ This fakeout could inject even stronger bullish momentum and drive the price higher. But for this to happen, the current bullish leg must break above 104857—otherwise, the scenario fails, because if buyers truly have strength after a trendline breakout, they should be able to break the previous high.
☘️ If this doesn’t happen, it signals weakness, and the price could move back toward the 71000 support, with an increased probability of breaking it.
💥 In previous analyses, I also mentioned that during this bullish cycle, RSI has accurately indicated market bottoms each time it touched the 45.17 support level. This has happened again, and I hope you were able to benefit from it.
📅 Daily Timeframe
In the daily timeframe, as you can see, using the bullish leg up to 106247, we can draw a Fibonacci Retracement.
🔑 In the initial correction phase after reaching 106247, a box was formed between the 0.236 Fibonacci level and the 106247 top. After the 0.236 Fibonacci level, which overlapped with 90958, was broken, a deeper correction occurred down to the 0.5 Fibonacci level.
🔄 A descending trendline can also be drawn on the chart. As I mentioned in Bitcoin analysis #52, I advised spot buying upon the breakout of this trendline. I hope you were able to take full advantage of that opportunity.
📚 After the price reached the 0.5 Fibonacci level, a strong reaction occurred, and after activating the 87360 trigger, the price began a bullish move with strong buying volume and sharp candles, climbing back above 90958. If it holds above this level, it could move back toward the 106247 top.
💥 The RSI oscillator has increased significantly during this bullish move and is now near the Overbuy zone. If RSI enters the excitement zone, the likelihood of a sharp move toward the main resistance increases, and if RSI stabilizes above this zone, the probability of breaking the 106247 top will be very high.
📉 Currently, strong bullish momentum has entered the market, so we can expect a solid uptrend to continue. However, if the price falls back below 90958 before reaching the 106247 top, it would suggest that the entire bullish move was a fakeout, and bearish momentum could enter, pushing the price lower toward the 0.618 or even 0.786 Fibonacci levels.
⏳ 4-Hour Timeframe
Let’s check the 4-hour timeframe for futures triggers.
✔️ As you know from previous analyses, we had two main entry points for long positions at 85697 and 88289, and I hope you managed to open positions based on those.
💣 Currently, the price has reached the 95173 resistance and is being rejected. The RSI oscillator also shows a divergence, and if the 64.4 level breaks on RSI, temporary bullish momentum could fade.
🔼 In case of correction, the supports we currently have are at 92109 and 88289. For more levels, we’ll need to wait for a proper correction to use Fibonacci tools.
📈 For a long position, you can enter on the breakout of 95173. The next price target will be 98828.For a short position, we still need to wait for a proper trend reversal.
❌ Disclaimer ❌
Trading futures is highly risky and dangerous. If you're not an expert, these triggers may not be suitable for you. You should first learn risk and capital management. You can also use the educational content from this channel.
Finally, these triggers reflect my personal opinions on price action, and the market may move completely against this analysis. So, do your own research before opening any position.

HelenP. I Bitcoin can rebound up from support zone to $96KHi folks today I'm prepared for you Bitcoin analytics. After breaking out of a prolonged sideways movement, the price entered a confident bullish phase that changed the market rhythm. This breakout came after the price consolidated for several days within the 83700 - 83000 support zone. During that period, the price formed a reliable foundation, and the trend line confirmed its strength, consistently holding the lower boundary of the structure. Once the price escaped this consolidation box, bulls quickly seized control, pushing BTC upward with strong momentum. The move took Bitcoin above the 94000 area, where it started to slow down and form a local peak. Now the price is pulling back, heading toward the nearest support zone between 92200 and 91600 points. This area matches Support 1 and historically acted as a zone of high buyer interest. Given the proximity of the trend line and the strength of this support zone, I expect that BTCUSDT will rebound after this correction. That's why I set my goal at 96000 points, a realistic target if the support holds and BTC resumes upward movement. If you like my analytics you may support me with your like/comment ❤️

BTCI expect Bitcoin to move between 75k and 90k until it breaks out in one direction.
I hope to see further growth up to 120k. There is also a small chance to reach 150k, but for now it looks unlikely.
At the same time, there is a risk of a drop to the 50k–60k area, which would be about a 50% correction from the top, similar to what happened in 2021.
