Starts Late, Ends Late: 2026 Bull Market?Market conditions are so different now. Everything is changing fast and radically, it has to do with the stars. The way the stars are aligned now has not happened in hundreds of years. The type changes we are seeing now have not happened in hundreds of years.
It is not only the financial markets but the whole world and the way we perceive reality is changing in so many ways. This is certain to have its effect on the Cryptocurrency market, the effect is already present and tangible, market conditions (reality) will never be the same.
The bull market is starting late. By this date in 2021, everything was up and up really strong. Some pairs had already peaked, literally, some altcoin trading pairs had already peaked by April 2021. The full cycle complete. Thousands of percentages of points of growth.
What about now? It is April 2025 and the bottom is in on many pairs. Only last week, 7-April, we had a marketwide bottom. The start of the 2025 bull market cycle and phase. A late start can translate into a late end.
Now, a full bullish cycle can be completed in 6 months. This is not necessary nor required. Also, the market is much bigger now, it wouldn't be feasible, there would be too much rush.
Think of the market as an entity that wants to survive, thrive, live and grow. Can it go through years of bearish action and only produce several months of growth? Balance is needed. The market needs a bullish cycle to keep the participants engaged or else everybody will quit forever if there is nothing to gain.
The fact that the Altcoins market hit bottom is the most bullish signal there is, but, looking at all these charts, hundreds of charts, something tells me that what is coming will be different to the past. Actually, it will be similar because the last bull market happened from March 2020 through late 2021. So we can have a bull market from April 2025 until some time in 2026. I just don't believe that everything will end too fast, within six months, because we are having a late start. It will be the other way around, the bull market will extend.
Instead of Cryptocurrency growing for 1 year, we might get continued growth for 2-3 years straight, maybe more for some pairs. Some pairs have been dropping for 4 years while others have been down for 6 years or more. When things change, these pairs will be experiencing sustained long-term growth.
Other pairs grew strong and never moved below support. These pair were supposed to drop according to classic past patterns and yet, they all remained strong and ready for more. This bull market will be out of the ordinary. Everything that is happening right now in finance and politics is not the same as always, it is a true generational change.
We are going through a phase of evolution and this is what will cause the bull market to extend. Late start, late end.
Namaste.
Bitcoin (Cryptocurrency)

Bitcoin: Normal Bullish vs Super Bullish +Altcoins Market UpdateBitcoin is bullish right now but not super-bullish. What needs to happen for Bitcoin to turn super-bullish is the question that I am getting through email from my most ardent followers. Why this question?
Some people don't like to take much risk. They are ok with some risk but not big risk. Buying early can produce great profits if things turn out ok, but it can also produce huge losses if the market makes a surprise rejection and turns the other way.
People like us like to catch the bottom but this comes with the risk of getting whipsaw. There can be several drops at the lows before a bearish wave ends. Without the proper risk management, position management, trying to catch the bottom can result in loses. Easy to see and understand.
Bitcoin is normal bullish above $80,000. Bitcoin is strongly bullish above $85,000.
This is still a great buy because Bitcoin is trading below $90,000. Anything below $100,000 is great for the long-term. Now, for Bitcoin to turn super-bullish we need a break and close above $88,700 on the daily timeframe. Give or take two days above this level to add strength. A stronger confirmation comes with the weekly close. If you want Bitcoin super-bullish, get it when the $88,000 resistance is gone.
To me, Bitcoin is already bullish confirmed. The correction is over and has been over for an entire week. This is only the start. Slow and steady growth. Bullish momentum will grow. Maximum speed will start in May 2025, late, and then up, up and up. It will be a long ride and it is likely to extend.
» Altcoins Market Update
The Altcoins market is great right now. Some pairs are finally starting to break bullish and moving above resistance. Support has been confirmed for weeks and in some cases for months. But there was been some sideways on the low but now bullish action is starting to show up. This is just the start. In a matter of days, some pairs will be growing between 30-80% in a single day. Once these move, they tend to retrace a little bit before additional growth. Do not try to catch those, it is a futile effort. Look now for the ones trading low with good signals and charts then buy and hold. You will do great.
Right now a diversification strategy can work wonders because there just too many pairs. The market will take a long time to grow. The market will take a while to unravel.
In the past, long gone past, 2016 and so on, the market would alternate between pairs every few months. As the market grew, the period between each bullish wave continued to extend, while in the past we would see strong action every few months, now it happens only once or twice per year. As the market grows, it takes longer and longer for money to move around and reach every sector. This bull market will be long.
It is likely that this bull market will extend because of so many pairs. There is not enough time to lift everything up in just 6 months. This is good news, it would be better to have a 2-3 years strong-long bull market rather than 6 months. The longer it last, the more time we have to adapt, learn and grow.
Since it is inevitable to make mistakes, the longer the bull market lasts, the more chances we will have to apply everything that we learn live every day. It will be great.
It is confirmed, everything will grow. By everything I mean the biggest portion of the market, choose wisely because a pair can start growing tomorrow while another one can start growing within 5-6 months. Both go up, but one do so in early 2025 while another one can grow in late 2025. Which one are you holding? Diversification right now is a strong move across the Altcoins. When Bitcoin grows 20%, some Altcoins will grow by 300%. Strong projects can grow between 80-150%.
There are many ways to approach the market. Do what works for you. I am wishing you success.
Thank you for reading.
Consider hitting boost and leaving a comment if you enjoy the content.
Namaste.

BITCOIN FALLING RESISTANCE|SHORT|
✅BITCOIN is trading in a downtrend
Along the falling resistance line
Which makes me bearish biased
And the coin is about to retest the resistance
Thus, a pullback and a move down are expected
With the target of retesting the level below at 83,213$
SHORT🔥
✅Like and subscribe to never miss a new idea!✅
Disclosure: I am part of Trade Nation's Influencer program and receive a monthly fee for using their TradingView charts in my analysis.

Bitcoin time? We Are Watching the Old World Fade in Real-TimeTechnical Breakdown:
🎥 Watch today’s full Bitcoin chart video here:
👉
📊 Also see:
Gold outlook -
DXY macro reversal –
THEN CONNECT THE DOTS WITH ME:
This isn’t just Bitcoin... this is the evolution of money in motion.
🟠 Bitcoin Time? We Are Watching the Old World Fade in Real-Time
This isn't just a moment for Bitcoin —
This is a moment for the entire monetary system .
The same chart we’ve used since the 2020 breakout continues to hold.
We called the structure.
We called the delayed breakout.
And now we are watching a macro pivot that goes far beyond crypto .
🔁 Technical Outlook
✅ Breakout after Halving 4 (April 2024)
✅ Structural retest complete
🔹 70% chance: Break above 115K
🔻 30% chance: Retest the 59K major support
The third test is building...
And historically, third tests break out or break everything .
We are prepared for either — but positioned for the upside.
🌍 Global Context
While this structure plays out, here’s what’s happening outside the chart:
🟡 Gold breaks ATHs → hard assets are in demand
💵 Dollar breaks support → normalization or loss of confidence?
🧊 Inflation cools to 2.4%
🟠 Bitcoin gains macro relevance — ETF flows, institutional entry, and global uncertainty
🔮 The End of Cycles?
We’ve ridden Bitcoin’s halving-driven cycles for a decade.
But ask yourself:
What if Bitcoin is no longer a cycle asset… but a reserve one?
2025 could mark a shift from speculative bull runs to long-term monetary adoption.
The signs are there.
⚔️ New Monetary Order?
China hoards gold
The U.S. aligns with Bitcoin (BlackRock, ETFs)
The Dollar fades structurally and symbolically
This is not just a trade.
This is a transition.
From fiat to fixed.
From speculation to structure.
From old world to new order.
Still long. Still with structure. Still watching history unfold.
One Love,
The FXPROFESSOR 💙

Bitcoin Potential DownsidesHey traders, in today's trading session we are monitoring Bitcoin for a selling opportunity around 86k zone, BTCUSDT is trading in a downtrend and currently is in a correction phase in which it is approaching the trend at 86k support and resistance area.
Trade safe, Joe.

The Charts Wall Street Watches – And Why Crypto Should Too📉 Crisis or Rotation? Understanding Bonds Before the Bitcoin Reveal 🔍
Hi everyone 👋
Before we dive into the next major Bitcoin post (the 'Bitcoin Reveal' is coming up, yes!), let's take a moment to unpack something critical most crypto traders overlook — the world of bonds .
Why does this matter? Because the bond market often signals risk... before crypto even reacts.
We're going to walk through 4 charts I've posted recently — not the usual BTC or altcoin setups, but key pieces of the credit puzzle . So here’s a simple breakdown:
1️⃣ BKLN – Leveraged Loans = Floating Risk 🟠
These are loans to risky companies with floating interest rates.
When rates go up and liquidity is flowing, these do well.
But when the economy weakens? They’re often the first to fall.
📌 Key level: $20.31
This level held in COVID (2020), the 2022 bank scare... and now again in 2025.
⚠️ Watch for a breakdown here = real credit stress.
Right now? Concerned, but no panic.
2️⃣ HYG – Junk Bonds = Risk Appetite Tracker 🔴
Junk bonds are fixed-rate debt from companies with poor credit.
They pay high interest — if they survive.
When HYG bounces, it means investors still want risk.
📌 Fear line: 75.72
Held in 2008, 2020 (COVID), and again now.
Price rebounded — suggesting risk appetite is trying to return .
3️⃣ LQD – Investment Grade = Quality Credit 💼
LQD holds bonds from blue-chip companies like Apple, Microsoft, Johnson & Johnson.
These are lower-risk and seen as safer during stress.
📊 Chart still shows an ascending structure since 2003, with recent pressure on support.
📌 Support: 103.81
Holding well. Rebound looks solid.
Unless we break 100, this says: "No panic here."
4️⃣ TLT – U.S. Treasuries = Trust in the Government 🇺🇸
This is the BIG one.
TLT = Long-term U.S. bonds (20+ yrs) = safe haven assets .
But since 2022, that trust has been visibly broken .
A key trendline going back to 2004 was lost — and is now resistance.
📉 Price is in a clear descending channel .
📌 My expectation: One final flush to $76 or even $71–68
…before a potential macro reversal toward $112–115
🔍 The Big Picture – What Are Bonds Telling Us?
| Chart | Risk Level | Signal |
|--------|------------|--------|
| BKLN | High | Credit stress rising, but support holding |
| HYG | High | Risk appetite bouncing at a key level |
| LQD | Medium | Rotation into quality, no panic |
| TLT | Low | Trust in Treasuries fading, support being tested |
If BKLN breaks $20...
If HYG fails to hold 75.72...
If LQD dips under 100...
If TLT falls to all-time lows...
That’s your crisis signal .
Until then — the system is still rotating, not collapsing.
So, Should We Panic? 🧠
Not yet.
But we’re watching closely.
Next: We add Bitcoin to the chart.
Because if the traditional system starts breaking... 🟧 Bitcoin is the alternative.
One Love,
The FXPROFESSOR 💙
📌 Next Post:
BTC vs Treasuries – The Inversion Nobody Saw Coming
Because if the system is shaking… Bitcoin is Plan B.
Stay ready.

Another Dump Session for Bitcoin?#bitcoin #btc price has formed an ascending wedge after 75K capitulation. As seen in the chart, #btcusd broke down this wedge' s support line and now consolidating under it.
This breakdown was bearish. CRYPTOCAP:BTC must reclaim at least 89K to avoid incoming dump session.(The invalidation)
Also, the macro is still enigmatic nowadays. There' re no permanent recovery signs for trade wars. Unless the invalidation aids, BTC may see serious dumps in short term. Not financial advice. DYOR.

Price Action: Bitcoin BTC Monday 4/14/2025In this video, we are looking into Bitcoins Price Action on Daily Chart throughout the week as it approaches previous levels of resistance on its move towards 85k -88k mark.

Do you think I'm joking ???Now that Bitcoin is returning to the cup-and-handle support, one can expect a strong pump up to 130k . it might happen.
⚠️ Disclaimer
Blockchain X has artificial intelligence technology that can make smart trades, allowing you to continuously make profits in the crazy world of cryptocurrency. Come and try it!
Give me some energy !!
✨We spend hours finding potential opportunities and writing useful ideas, we would be happy if you support us.
Best regards CobraVanguard.💚
_ _ _ _ __ _ _ _ _ _ _ _ _ _ _ _ _ _ _ _ _ _ _ _ _ _ _ _ _ _ _ _
✅Thank you, and for more ideas, hit ❤️Like❤️ and 🌟Follow🌟!
⚠️Things can change...
The markets are always changing and even with all these signals, the market changes tend to be strong and fast!!

Bitcoin Double Top Signals Caution: Key Support Zones to WatchCRYPTOCAP:BTC previously formed a strong double bottom around the $74,500 level, which led to a bullish rally pushing the price up to a saturation zone near $86,000. However, current price action suggests a double top formation — a classic bearish reversal pattern. This aligns with RSI trendline rejection and signs of bearish divergence, reinforcing the bearish sentiment.
The key question: Is this a correction or the start of a deeper dump?
If BTC holds above $79,000, it may just be a healthy correction.
A breakdown below $79,000 brings the next support near $76,000 into focus.
If that fails, Bitcoin could revisit the $69,000 zone, which aligns with earlier consolidation.
Traders should monitor RSI closely and watch for reaction at the support zones. Opportunities exist for both short-term scalps and long-term positions near key levels.

ETHEREUM BITCOIN (BEST-CASE)CRYPTOCAP:ETH is the main platform for thousands of apps and blockchains, all powered by the Ethereum protocol.
This vibrant ecosystem fuels innovation and a wide range of decentralized apps and services.
Free and global Ethereum accounts
Pseudo-private, no personal information needed
Without restrictions anyone can participate
No company owns Ethereum or decides its future

TradeCityPro | Bitcoin Daily Analysis #61👋 Welcome to TradeCity Pro!
Let’s move on to the analysis of Bitcoin and key crypto indices. As usual, in this analysis I want to review the futures session triggers for New York.
🔍 Yesterday, one of our short position triggers was activated. Let’s get into the analysis to see how we can open a position today.
⏳ 1-Hour Time Frame
In the 1-hour time frame, as you can see, the trigger we gave yesterday at the 84382 level was activated and the price moved down toward the 82813 area. Today, I’ve adjusted the position of these lines since the price has created a better structure and the placement of the levels can change accordingly.
✔️ Currently, the price has formed a box between 83233 and 85482 and continues its ranging structure.
📈 For a long position, we can act if 85482 breaks. If this level breaks, since the trendline has also been broken, this time the price can move upward with more momentum, and the first target of this position would be 85482.
📊 Market volume is currently ranging, and we can’t extract specific data from this tool. But if volume increases along with an upward price movement, it would be a very good signal for the continuation of the bullish trend.
🔽 If that doesn’t happen and the price moves downward, the 83233 trigger is a very good one, and a break of this area gives us confirmation of a trend reversal, and the price can move further down.
👑 BTC.D Analysis
Let’s look at Bitcoin dominance. Dominance is still ranging and hasn’t moved much compared to yesterday.
⭐ A break of 63.61 would be suitable for a bullish move, and a break of 63.23 would be suitable for a bearish move.
📅 Total2 Analysis
Let’s move on to the Total2 analysis. This index is acting very similarly to Bitcoin and is currently near its long trigger.
🔼 For a long position, a break of 980 is suitable, and for a short position, a break of 947 is appropriate.
📅 USDT.D Analysis
Let’s check out Tether dominance. We’re still waiting for a break of 5.39, which is a very important level, and if it breaks, the price could have a long-term bearish move.
💫 For a bullish move in dominance, breaks of the 5.53 and 5.59 levels are also suitable.
❌ Disclaimer ❌
Trading futures is highly risky and dangerous. If you're not an expert, these triggers may not be suitable for you. You should first learn risk and capital management. You can also use the educational content from this channel.
Finally, these triggers reflect my personal opinions on price action, and the market may move completely against this analysis. So, do your own research before opening any position.

Btc october 2025 local top?#Bitcoin bull run is not over yet, there is a high probability that we will see a local top by October and also the possibility of the next local bottom in October 2026 is also in the plan.
CRYPTOCAP:BTC

bitcoin enters a hyper-parabolic state to 753kgm,
this was initially a private post,
but i've decided to open it up to the public, for the people.
---
interest rates are collapsing. not slowly. not in a controlled, measured descent. this is a freefall. the kind that rewrites economic history.
monetary debasement is inevitable. quantitative easing will accelerate, liquidity will flood the system, and the us dollar will plunge. this isn’t speculation. this is math.
and when that happens, the gates open. the largest alt season in history is not a possibility. it is an inevitability. this will be the kind of move that people will talk about for decades. portfolios multiplied beyond reason. valuations pushed to levels most can only dream of.
the everything bubble will expand beyond comprehension. people will call it unsustainable. they will call it madness. but madness is where the greatest opportunities are born.
most won’t be ready. they will hesitate. they will overthink. they will sell too early,
watching in disbelief as the market leaves them behind.
we will not.
🌙
---
tp - 753k

SIGNAL FOR TRADE IN 15m TIMEFRAMEBTCUSDT prepare for downward trend in 15m timeframe
its my opinion about this chart

BTC - Critical Juncture at channel and liquidity levelThe 1-hour chart reveals BTCUSDT navigating crucial price territory, with immediate focus on the 85,000.0 to 88,000.0 range. The market shows subtle but important movements, with current price action hovering near 84,260.1 after testing higher levels.
Key observations from the chart:
The volume profile indicates weakening momentum as price approaches the 88,000 resistance zone. Of particular note is the cluster of activity around 84,260.1 , which now serves as immediate support. The liquidity pockets at both 85,000 and 88,000 create clear reference points for potential breakouts or rejections.
Critical levels to monitor:
Upper resistance sits firmly at 88,000.0 , where previous reactions have occurred. Strong support emerges at 84,260.1 , with additional floors at 82,000.0 and the psychological 80,000.0 level. The 0.76% price change marker suggests some volatility brewing beneath the surface.
Trading considerations focus on two scenarios:
A hold above 84,260.1 could signal strength and potential retest of higher levels. However, failure to maintain this support may trigger moves toward 82,000.0 . The tight 0.04% to 0.02% bands indicate potential compression before the next directional move.
Market structure currently favors cautious optimism, but requires confirmation above 85,000.0 for stronger conviction. The diminishing volume at higher levels suggests some exhaustion, making proper position sizing essential.
Final Note: These price levels represent significant psychological barriers. Traders should watch for volume spikes and candle closes beyond these markers for confirmation. Always employ strict risk management in these potentially volatile conditions.
Disclaimer: Market conditions change rapidly. This analysis represents one interpretation of current price action and should not be considered financial advice.

bitcoin dips below 60kbitcoin dips below 60k, but we're unfazed.
i see this playing out as we move into the depths of winter,,,
this crypto winter ❄️
why would this happen, you ask?
the answer is simple: a stop-loss raid.
a sharp wave 4 designed to shake out weak hands.
distribution may have already started, hypothetically speaking, but it'll take the rest of the year to unfold.
think of it like the jan 2021 -> april 2021 vibe, only on a slightly higher degree and timeframe.
---
take note of the highlighted wave 2's and wave 4's on my chart.
what i'm illustrating is "the law of alternation," which states:
if wave 2 is flat, wave 4 will be sharp, and vice versa.
all the wave 2's in this cycle have been flats,
so by design, all of our wave 4's are set to be sharps.
this fits neatly into the larger cycle:
sharp retracements triggered by over-leveraged positions,
yet consistently bought up thanks to strong demand.
with each sharp retracement, however, the upward moves become smaller,
as momentum gradually fades.
---
w4 target: below 60k
w5 target: between 150k-200k (conservatively).
---
ps. i have recently shared a much more bullish idea via:

BTC.D - Still in the ascending channelCRYPTOCAP:BTC.D remains firmly within its long-standing ascending channel. The recent “fake breakout” below the channel has been invalidated as dominance swiftly returned to the channel, showing a strong reaction and confirming the channel’s validity.
This suggests:
✅ Bullish Implication for BTC: Bitcoin is likely to continue gaining dominance in bullish moves, outpacing altcoins in performance.
✅ Bearish Impact on Altcoins: In downturns, altcoins are expected to experience sharper declines compared to Bitcoin.
Traders should monitor this channel as a key indicator for market behavior, especially for Bitcoin and altcoin strategies.

14/04/25 Weekly OutlookLast weeks high: $86,116.94
Last weeks low: $74,520.92
Midpoint: $80.318.93
Did we truly think it would be easy? As Trump targets China the markets panicked in a huge de-risking event that sent BTC down to $74,500, fully retracing the Us election pump 6 months ago. After a double bottom and a tariff pause for 90 days on those countries that played ball, BTC reclaimed the previous weeks bottom and steadily climbed back toward major resistance at $86,000.
Clearly the focus has primarily been on traditional markets like the SPX & DJI, on the SPX the 1D 200 EMA tagged and as usual gave huge support, this is very often a local bottom and so far that is the case. BTC has very quietly flipped the 4H 200 EMA after the 10th time of trying, staying above the $84,000 level would be a confirmed reclaim if the trend can follow and flip bullish. If that is the case then it would seem the flush we've all been dreading is over, however, if Trump escalates the trade war once again then TA takes a back seat to FA once again.
This week I would like to see strong support at 0.75 line, a wick down to that level and a reclaim of the 4H 200 EMA would give me confidence that BTC can target the $91K mini range top. A loss of the 0.75 line and acceptance below I would then target weekly lows once again for a triple bottom.

Bitcoin Reversal After Fake Bullish Divergencehello guys.
Fake Bullish Divergence:
The Relative Strength Index (RSI) at the bottom shows a bullish divergence, but the price action invalidated it — signaling a "fake divergence".
This could trap early long positions and fuel further downside.
Broken Trendline Support:
A significant ascending trendline support has been broken, indicating weakening bullish momentum.
The recent bounce back seems corrective rather than impulsive.
Price Projection:
An arrow points downward toward the horizontal support around $69,149, hinting at a possible drop in price.
This level coincides with the intersection of the mid-channel support line and horizontal price structure.
Channel Structure:
The overall chart operates within a large ascending channel.
A revisit of the lower bound of the channel aligns with the projected price target.
-------------------------------------
Conclusion:
Despite the recent rebound, Bitcoin is showing signs of weakness due to a fake bullish RSI divergence and a broken ascending trendline. The technical setup suggests a potential decline toward the $69,000–71,000 support zone before any meaningful recovery can occur. Caution is advised for bullish traders until the price confirms a stronger support or reversal signal.

87-88K seems natural targetMorning folks,
So, our 80-85K trade was nice. Now we think that it is not time for big trades, mostly because many markets, and especially US bonds and dollar are overextended. That's why for a few sessions we're focused on near standing targets.
BTC daily chart shows strong resistance around 87-89K area, which is also might be the neckline of potential reverse H&S. We already talked about this previously.
It is the 2nd reason why it would be better to focus on something close. Thus, on 1H chart setup might be looking like you see on the chart. We hope that 83K support will hold. Otherwise, this trade has no sense, because stop placement below 81K support makes risk/reward ratio unattractive.
Thus, supposedly 87-88K is an upside target. And we hope that BTC will stay above 83K.

BITCOIN's 1D MA50 Flip = GREEN LIGHT for the NEXT BIG PUMP!Bitcoin (BTCUSD) closed Saturday's 1D candle above the 1D MA50 (blue trend-line) for the first time in more than 2 months (since February 03)! The 1D MA50 got tested and rejected the price 6 times since then. At the same time, the price marginally broke above the Lower Highs trend-line that started on the January 20 All Time High (ATH).
This is the most powerful short-term bullish combination as it was staged on a Bullish Divergence 1D RSI, which is on Higher Lows against the bearish trend's Lower Lows. Technically such break-outs immediate Target is the 2.0 Fibonacci extension, which now happens to be just below the $100k mark at $99500. In not such a coincidental fashion, that is he last Resistance level that run through February 05 - 21 before BTC's strong tariff sell-off.
So do you think the 1D MA50 break is the green light for a $99500 rally? Feel free to let us know in the comments section below!
-------------------------------------------------------------------------------
** Please LIKE 👍, FOLLOW ✅, SHARE 🙌 and COMMENT ✍ if you enjoy this idea! Also share your ideas and charts in the comments section below! This is best way to keep it relevant, support us, keep the content here free and allow the idea to reach as many people as possible. **
-------------------------------------------------------------------------------
💸💸💸💸💸💸
👇 👇 👇 👇 👇 👇

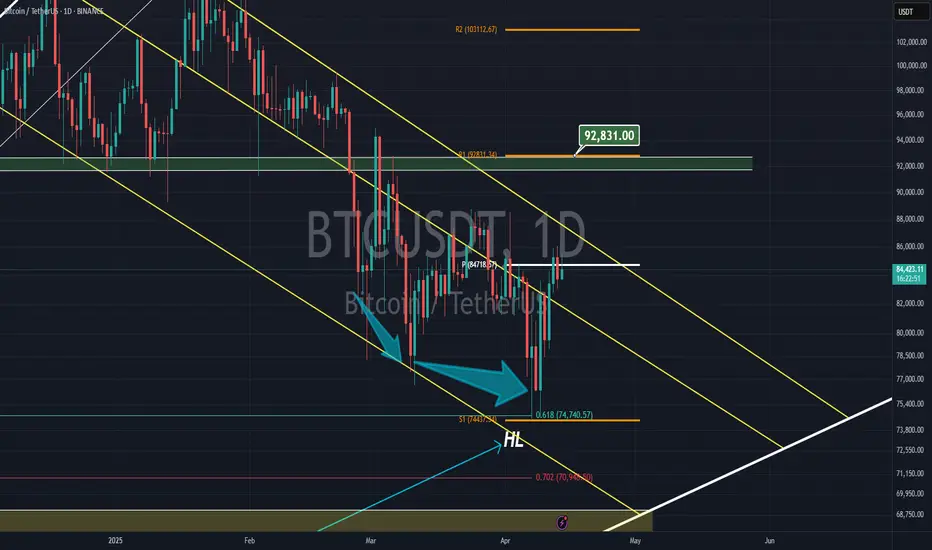
Bitcoin at the pivotBitcoin now is trying to break the April pivot ( which is easy IMO ) and as soon as pass that, it can get to 93k resistance