Top Altcoins Choice —Your Pick (Pre-2025 Bull-Market)Conditions are slightly different now because Bitcoin just closed last week below 80K, but this does not change the bigger picture or long-term perspective, that is, Bitcoin is growing next.
This is Bitcoin on the weekly timeframe, notice how its price trades safely above EMA55. Also notice how this level worked as support in 2023, launching the 2024 bullish phase, and also in late 2024, producing the final advance to ~110,000 before the present corrective cycle:
A correction is good because it opens the doors for new, great entry prices.
A correction is good, because after a correction, the market always grows. The market fluctuates between down and up. It doesn't matter how long it takes nor how hard the market shakes, it is cyclical in nature and this gives us the necessary strength to buy and hold long-term.
Back to the weekly timeframe. Bitcoin is also trading above SMA200 which sits around $45,000. The current drop is quite steep and it forms a falling wedge pattern. This wedge pattern is a bullish development and tends to lead to a reversal once the action reaches the apex of the channel.
Let's consider the daily timeframe:
Bitcoin just produced a new low and the lowest price since early November 2024. It is also the first time ever that Bitcoin closes weekly below 80K, a break of strong support.
The current low hit very close to the high hit in March 2024. Bitcoin hit a low of $74,500 today while the 2024 March peak price sits around $73,800, this is the strongest support zone due to it being a long-term All-Time High.
A great piece of news and something that confirms the market is about to turn is the trading volume. Notice the volume dynamics as Bitcoin moves lower and lower. This can indicate that the bears are losing strength. We are seeing new lows but each new low with decreasing volume. This means that a reversal will happen next. Bitcoin will grow in 2025, make no mistake.
To close this chapter and move to the Altcoins, consider the RSI; strong bullish divergence. Divergences tend to happen when the trend is about to change.
Namaste.
Top Altcoins Choice —Your Pick
Let's start the much awaited Pick Your Altcoin session. I will do a full chart analysis just for you. You make a choice, your top choice, and I will publish in my profile; you need to follow.
Instructions:
1) Pick any Cryptocurrency pair you like and leave a comment with the ticker. There is one condition though, the project/trading pair must be available on TradingView for me to be able to do the analysis. The chart also needs to have at least 6 months of data.
2) If you see a comment that has a pair that you like, make sure to boost it. The comments with the most boosts will get published first.
3) Maximum 3 pairs (Altcoins/projects) per person. Maximum 700 total chart analysis. Once we do 700 charts, I will not take anymore requests.
4) I will publish in my profile up to 10 charts daily. This is the posting limit. Once the limit is reached, I will start answering in the comments section. Once the comments limit is reached, we can continue the next day.
If the pair looks really good and has great potential for the 2025 bull-market, I can save it to publish in my profile. I will take my time to try and produce a high quality analysis. Your support is highly appreciated.
5) If you share a few details about yourself, your trading journey, your strategy, what you would like to see on the analysis or anything related to finance and Cryptocurrency, I can better connect with your mind and produce a more personalized analysis.
Bitcoin will recover and grow. This is easy.
The Altcoins will also grow.
2nd-May 2025 is a great date.
The accumulation phase continues. The time to buy is when the market is red.
Buy and hold —focus on the long-term.
Thank you for reading.
You deserve the best!
Namaste.
Bitcoin (Cryptocurrency)

$BTC Not Out Of The Weeds Yet - Must Break $84kIf CRYPTOCAP:BTC can break back above ~$84k then we could continue to follow my OG setup (yellow) and rip,
but since PA dumped slightly below the 50WMA it technically invalidated my inverse h & s idea.
A rejection of $84k would dump us back to ~$78k to form the right shoulder (red) and complete the setup.
nonetheless, i believe we've seen the bottom 👋

Litecoin LTCUSD Completing Final Leg Down Before LaunchAs you can see Litecoin is forming a very similar pattern. I think the rest of March will be corrective. Litecoin will likely come down and bounce off the trend line which coincidental also is a major support level. April will be slightly bullish, May and June will be majorly bullish which I believe Bitcoin will also fly up to 140k as well in this time. I believe Litecoin will outperform the majority of the market. Major hyperinflation will begin this summer which will be very positive for crypto. Many cryptos will die in this hyperinflation period. Only some will survive. Dollar is going to crash. Get ready for a wild ride into 2026. People calling for a bear market are ill informed and will kick themselves for selling. This is the beginning of the biggest run in some cryptos, we've ever seen. Buckle up. Good luck. Not financial advice.

Check support near the M-Signal indicator on the 1D chart
Hello, traders.
If you "Follow", you can always get new information quickly.
Please click "Boost" as well.
Have a nice day today.
-------------------------------------
(BTCUSDT 1M chart)
-
(1W chart)
Indicators indicating lows on the 1M chart and 1W chart, i.e. BW(0), DOM(-60) indicators, are not created.
Therefore, caution is required when trading as it can fall at any time.
This movement is likely to occur until the trend line corresponding to the trend line (1) on the 1M chart is created as a solid line.
-
(1D chart)
There are several trend lines drawn, but the important thing to consider is whether there is support near the section marked with a circle.
Among them, the section that must be broken to create a trend is 89294.25 and 73499.86.
Therefore, the key is whether the price can be maintained near the M-Signal indicator on the 1D chart and rise above 89294.25.
Therefore, the next volatility period is from around April 14th to 17th, and we need to check whether the price can be maintained above the M-Signal indicator on the 1W chart.
If it fails to rise, there is a possibility of falling again to around 78595.86 and 73499.86.
The important thing to consider is whether there is support near the M-Signal indicator on the 1D chart.
-
(30m chart)
The following applies to all time frame charts.
Trading strategies can be created based on whether there is support near the HA-Low and HA-High indicators.
Here, we refer to the movements of the Trend Cloud and StochRSI indicators.
Currently, the HA-High indicator has risen above it and the Trend Cloud indicator is thick, so it can be interpreted that the upward trend is likely to continue.
However, since the StochRSI indicator has fallen in the overbought zone, the upward trend may be limited.
Therefore, it can be interpreted that the support near the M-Signal indicator on the 1D chart is important.
If it continues to rise further, it is expected to touch the M-Signal indicator on the 1W chart.
If it rises or moves sideways, the Trend Cloud indicator will eventually become thinner.
If the Trend Cloud indicator shows resistance while being thin, the possibility of a decline increases, so at that time, you should refer to the various indicators that are generated and respond according to whether there is support near those indicators.
-
If you predict the movement in advance and proceed with the transaction, you may be subject to psychological pressure and may proceed with the wrong transaction, so you should always be careful.
In the HA-Low ~ HA-High indicator section, a trading strategy in the sideways or box section is required.
If it falls below the HA-Low indicator or rises above the HA-High indicator, a trading strategy in the trend is required.
The current example chart is a 30m chart, so this chart requires a trading strategy in the trend.
Therefore, if it shows support above the HA-High indicator, you can create a trading strategy and proceed with the transaction.
Since it is currently located near the M-Signal indicator of the 1D chart, whether there is support near this area is the first trading strategy period.
-
For reference, HA-Low, HA-High indicators are indicators created to create trading strategies, and M-Signal indicators on 1M, 1W, and 1D charts are indicators created to identify trends.
-
Thank you for reading to the end.
I hope you have a successful trade.
--------------------------------------------------
- Here is an explanation of the big picture.
I used TradingView's INDEX chart to check the entire range of BTC.
I rewrote the previous chart to update it while touching the Fibonacci ratio range of 1.902 (101875.70) ~ 2 (106275.10).
(Previous BTCUSD 12M chart)
Looking at the big picture, it seems to have been maintaining an upward trend following a pattern since 2015.
That is, it is a pattern that maintains a 3-year uptrend and faces a 1-year downtrend.
Accordingly, the uptrend is expected to continue until 2025.
-
(Current BTCUSD 12M chart)
Based on the currently written Fibonacci ratio, it is displayed up to 3.618 (178910.15).
It is expected that it will not fall again below the Fibonacci ratio of 0.618 (44234.54).
(BTCUSDT 12M chart)
Based on the BTCUSDT chart, I think it is around 42283.58.
-
I will explain it again with the BTCUSD chart.
The Fibonacci ratio ranges marked in the green boxes, 1.902 (101875.70) ~ 2 (106275.10) and 3 (151166.97) ~ 3.14 (157451.83), are expected to be important support and resistance ranges.
In other words, it seems likely that they will act as volume profile ranges.
Therefore, in order to break through these ranges upward, I think the point to watch is whether they can receive support and rise near the Fibonacci ratios of 1.618 (89126.41) and 2.618 (134018.28).
Therefore, the maximum rising range in 2025 is expected to be the 3 (151166.97) ~ 3.14 (157451.83) range.
In order to do that, we need to see if it is supported and rises near 2.618 (134018.28).
If it falls after the bull market in 2025, we don't know how far it will fall, but based on the previous decline, we expect it to fall by about -60% to -70%.
Therefore, if it starts to fall near the Fibonacci ratio 3.14 (157451.83), it seems likely that it will fall to around Fibonacci 0.618 (44234.54).
I will explain more details when the bear market starts.
------------------------------------------------------

BTCUSD: Attacking the 2025 Resistance looking for huge breakout!Bitcoin turned neutral on both its 1D (RSI = 47.243, MACD = -1813.400, ADX = 31.557) and 1W (RSI = 45.530) technical outlooks following the 90-day tariff pause. Technically it is going after the LH top of the Falling Wedge from its ATH and the 1D MA50, which has been the main Resistance since February 4th 2025. There is a key Bullish Divergence on the 1D RSI too, being on HL as opposed to the LL of the Falling Wedge. A breakout above the Wedge typically sets a technical target on the 2.0 Fibonacci extension, which falls just under the ATH Resistance Zone. Be ready to go long if the breakout takes place (TP = 106,000).
## If you like our free content follow our profile to get more daily ideas. ##
## Comments and likes are greatly appreciated. ##

HOW IS CRYPTO SHAPING UP?Trump and tariffs have a firm grip on the economic world as of late, so where does that leave the crypto market?
TOTAL has a clear structure since the beginning of the bull market in 2023, in the last 3 days TOTAL has wicked into the bullish trendline support but sits within a bearish trend channel. This level also coincides with the bullish orderblock that started the leg up post US election so a very strong level of support here.
Do I think this is the end and the bottom is in? The chart would make a very good case for it however I believe that the Geo-politics outweigh Technical Analysis currently, at least in the short term. Everyone is watching for the latest news release/Trump announcement and all the time that is going on the market is very reactionary with less passive orders and more reactionary news based market orders. That taken into account in the short term this is a game of musical chairs with massive volatility swings and liquidations left right and center, a traders dream.
I'm very interested in how the FED will react to this, once we start getting emergency or early interest rate cuts that for me is when BTC will take the next step up and will flip to an investor/buy and hold environment, whether that's from here, lower or higher I'm not sure but but BTC needs a risk-on environment to thrive and Trump is doing his best to force J Powells hand.

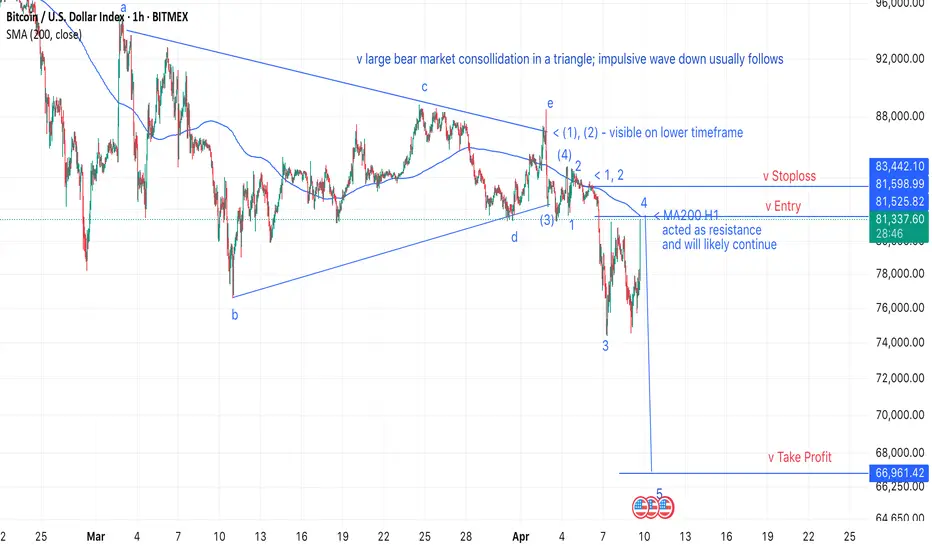
[BTC short] Entry: 81.5k, SL: 83.5k, TP: 67kThe backdrop is my prediction of a 2008-style crash, with Bitcoin (BTC) dropping to $26k (see related ideas).
During the crash, I’ll aim to capitalize on short-term moves, targeting clear patterns with high reward-to-risk ratios.
Following a prolonged consolidation—resembling a triangle—an impulsive wave down has begun to form. I now expect the 200-hour moving average (MA200 H1) to act as resistance, pushing the price to a new low and trade accordingly.
BTC ANALYSIS📊 #BTC Analysis
✅There is a formation of Falling Wedge Pattern on 12 hr chart and currently trading around its major support zone🧐
Pattern signals potential bullish movement incoming after a breakout
👀Current Price: $78,150
🚀 Target Price: $84,900
⚡️What to do ?
👀Keep an eye on #BTC price action and volume. We can trade according to the chart and make some profits⚡️⚡️
#BTC #Cryptocurrency #TechnicalAnalysis #DYOR

BTC | BEARISH Cycle Begins | $71KThere are a few tell signs that BTC has entered the bearish market.
If the price fails to maintain closing daily candles ABOVE the 70k area, there is a likelihood for a nasty Head and Shoulders pattern to form.
A key point to watch are the Bollinger Bands, which gives you an indication of the next possible zone to watch.
_____________________
BINANCE:BTCUSDT

Bitcoin - Watching For CapitulationI'm not going to try and predict whether not Bitcoin has begun what I believe to be its inevitable long term bear market, but I will look at some important trends and horizontal levels. For years, I've speculated that Bitcoin would have a hard time sustaining a significant new all-time high. It turns out, for the mean time, I've been correct in that assumption.
Bitcoin has now broken down from the ascending broadening wedge pattern that began in November, 2022. Here's the chart zoomed out:
There is still a chance for this to be a false breakdown, if buyers show up soon and take price back above that $87-90K resistance, which has become quite strong. However, ongoing global market news continues to remain bearish fundamentally, as many commodities and material objects will have to be repriced to the upside. At the same time, the FED is in a bind because if this causes a spike in unemployment, they will be more hesitant to lower rates, fearing greater inflation. This is the definition of stagflation.
In any case, zoomed in you can see that Bitcoin is in a downtrend channel - often a bullish pattern. My speculation is that Bitcoin will attempt to break down BELOW the channel, leading to a cascade of liquidations. This kind of drop can end around $69-71K on the shallow end, though can go much deeper from a structural standpoint. Outlined are all the support levels, and circled in red is a potential capitulation area.
If Bitcoin manages to bounce from the $60-70K level on high enough volume, depending on economic news, price can even make a new high. But we're not there yet by any means. This possibility is shown with the green arrow. On the other hand, if Bitcoin cannot bounce at the previous trend resistance (light blue line below the red local downtrend), price can retrace all the way towards $48-50K.
Let's see what happens!
Thanks for reading.
-Victor Cobra

TradeCityPro | Bitcoin Daily Analysis #56👋 Welcome to TradeCity Pro!
Let's dive into the analysis of Bitcoin and key crypto indices. Today, as usual, I will review the New York futures session triggers.
✔️ Yesterday, the short trigger we discussed was activated, and the price moved downward to the area of 74760.
👀 Today, the market conditions are favorable for opening positions, both long and short.
⏳ 1-Hour Timeframe
As I mentioned yesterday, the price executed another downward leg after pulling back to the 80595 area, activating our trigger at 78913 and moving to the main support floor. Today, I have adjusted this area, and we will explore why this adjustment was made.
📚 Positions like the one yesterday, which are opened for scalping, I usually set with a risk to reward ratio of 2 or 3, and I don’t leave them open for long, opting instead to secure profits. If you also open such positions, I recommend not holding them long term.
💥 However, today, as you can see, the price is forming more structure and giving us more logical triggers. The SMA99 indicator is nearing the price, and the RSI is showing divergence compared to the first bottom that the price made at 74650, which was accompanied by divergence.
🔼 For the divergence in RSI to activate, it needs to break the area of 59.87. If this happens, we can say that the divergence is active, and we can look for a price trigger for a long position.
⚡️ The first trigger for a long position is the 77735 area, which is considered risky, and with the breaking of this area, you can open a scalping position. The main long trigger is the breaking of 80595, which, if broken, activates a Double Bottom pattern that could change the market trend.
⭐ Keep in mind, there is currently no Double Bottom, and only if the 80595 area breaks will this pattern form.
📉 For a short position, the 74760 trigger is still appropriate, and you can enter a short position if this area breaks. However, it is important to note that this area is very close to the 71779 area, and opening a position on the break of 74760 will be risky.
👑 BTC.D Analysis
Let's now analyze Bitcoin dominance, which continues to range between the areas of 63.30 and 63.50. Breaking this box could define the positions we open today.
💫 If the 63.30 area breaks, dominance might temporarily decline, allowing more capital to flow into altcoins. Conversely, if the dominance breaks upwards at 63.50, more capital will flow into Bitcoin. Soon, we will have a comprehensive analysis of Bitcoin dominance that I highly recommend not to miss.
📅 Total2 Analysis
Moving on to the analysis of Total2, yesterday the Total2 trigger at the 896 area was activated, and altcoins, like Bitcoin, declined, causing this index to drop to the area of 860.
🔍 Today, for a short position, breaking the 860 area is appropriate. However, for a long position, I recommend seeking confirmation from Bitcoin itself and its dominance.
📅 USDT.D Analysis
Finally, for the Tether dominance analysis, this index activated its upward trigger at the 5.84 area and performed an upward leg to 6.13.
📊 Currently, confirmation for the next upward leg in dominance will be with the breaking of 6.13, and the confirmation for a downward turn remains at the 5.73 area.
❌ Disclaimer ❌
Trading futures is highly risky and dangerous. If you're not an expert, these triggers may not be suitable for you. You should first learn risk and capital management. You can also use the educational content from this channel.
Finally, these triggers reflect my personal opinions on price action, and the market may move completely against this analysis. So, do your own research before opening any position.


Thanks to STUPID TRUMP the downward trend continuesDo you agree with me that Trump is a narcissistic and crazy man who has decided to destroy the world economy, or is he discrediting powerful people and just lying

HelenP. I Bitcoin may rebound from resistance zone and fall moreHi folks today I'm prepared for you Bitcoin analytics. After a strong rejection from the second resistance zone between 86700 and 87900 points, Bitcoin lost its bullish momentum. The price attempted to hold within the range but failed to break above the trend line, which has consistently acted as dynamic resistance. This trend line marked the turning point once again, pushing BTC down with increased selling pressure. The price then sharply declined, breaking below the first resistance zone between 78200 and 79500, which is now acting as resistance. This level was previously tested multiple times, making it a key barrier. After breaching this zone, the price dropped even lower and reached the 77000 area, where it found temporary support and began a minor bounce. Currently, Bitcoin is trading just below the resistance zone and remains under the trend line. Sellers are still in control, and the recent bounce looks weak compared to the prior impulse down. Given the rejection from resistance, the position relative to the trend line, and continued bearish pressure, I expect BTC to resume its decline toward 70000 points, which is also my goal. If you like my analytics you may support me with your like/comment ❤️

BITCOIN Can a USD sell-off save the Cycle?Bitcoin (BTCUSD) is hanging on its 1W MA50 (blue trend-line) amidst the market chaos and especially following last night's stronger 104% trade tariffs to China from the U.S.
This is a simple yet powerful classic chart, displaying Bitcoin against the U.S. Dollar Index (DXY, black trend-line). This shows the long-term negatively correlated pattern they follow on their Cycles.
Every time DXY entered an aggressive sell-off in the final year of the 4-year Cycle, Bitcoin started its final parabolic rally of its Bull Cycle. This time the DXY peaked exactly at the start of the year (2025) and is on a selling sequence up until today but due to the ongoing Trade War, BTC not only didn't rise but is on a correction too.
Can an even stronger DXY sell-off save the day and complete the 4-year Cycle with a final rally? Feel free to let us know in the comments section below!
-------------------------------------------------------------------------------
** Please LIKE 👍, FOLLOW ✅, SHARE 🙌 and COMMENT ✍ if you enjoy this idea! Also share your ideas and charts in the comments section below! This is best way to keep it relevant, support us, keep the content here free and allow the idea to reach as many people as possible. **
-------------------------------------------------------------------------------
💸💸💸💸💸💸
👇 👇 👇 👇 👇 👇

Spy what I see with my little eyeTraders,
Fear, trade wars, WW3, Tariffs and a bunch of I told you soo's..... "You voted for this!" just a bunch of chirping. Because this man got to being a billionaire being a silly goose yeah? What happens when them 401k's start 3x'n, what happens when we see one of the biggest bull markets we have experienced in our lifetime?
I don't know much but I know this..... the bull market may not be over. Just taking a break!
Enjoy the hopium!
Stay Profitable!
Savvy

Fil has BottomedTraders,
Like it or love it, this is an unpopular opinion in a sketchy time in the market. Regardless, our team thinks we have bottomed for alt, its discount season! You name it and it is at the bottom!!
We hope you enjoy a little hopium in these uncertain times!!
Stay Profitable,
Savvy!

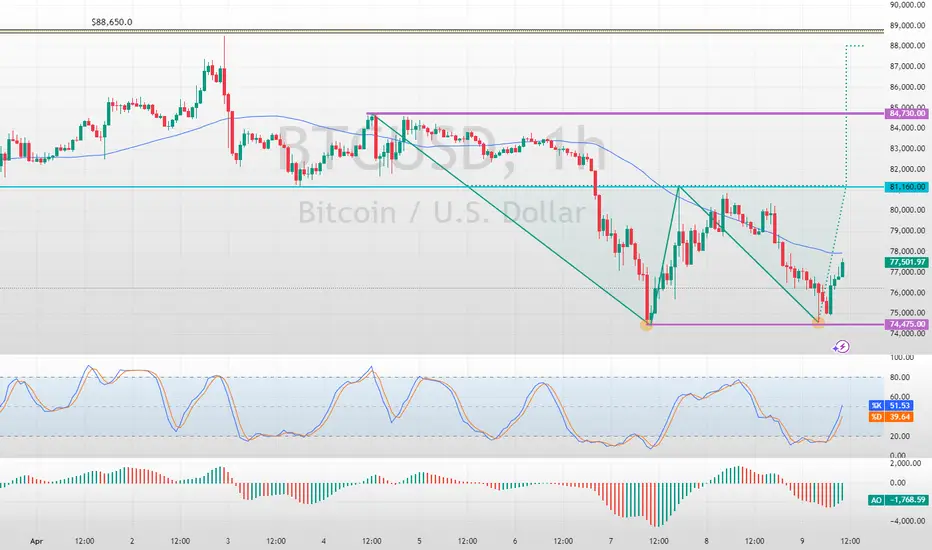
Bitcoin Formed a Double Bottom Bullish PatternFenzoFx—Bitcoin formed a double bottom bullish pattern. A consolidation phase toward $81,160 is imminent if the price holds above $74,475.
>>> Trade BTC/USD, swap free at FenzoFx Decentralized Forex Broker.
Bitcoin At $250,000 In 2025: Bull-Market Entry (Buy) Zone ActiveBitcoin's 2025 bull-market buy-zone is still active. Actually, Bitcoin is at a great price right now. We are aiming for a target of $250,000 for this cycle. We are looking at the bottom right now, literally. Any buy below $90,000 is extremely good and below $80,000 a dream come-true. This will be obvious in just a matter of weeks.
How are you feeling today?
I hope the start of the weekend is treating you good.
This is a friendly reminder, Bitcoin has been sideways for months. When Bitcoin drops, it drops but, currently, there are no new lows.
Bitcoin peaked in December 2024 and produced a double-top in January 2025. A small retrace and that's it; the accumulation phase is ongoing and the buy-zone active.
There are many signals that support a correction bottom being in. We looked at these already so you will have to trust me. Leverage is possible on this setup. Leverage for a long-term trade. This is the best possible scenario and the best type of trade.
No complexities. No calculators. No fees. No interest, just buy and hold.
Wait patiently... It will be a very strong rise and the Altcoins will grow even more than Bitcoin. The entire Cryptocurrency market will produce maximum growth.
This post is intended to alert of you a great entry-timing. Great prices as well but timing right now is great. We might have to wait a bit longer, it won't move right away, but with this price you can't go wrong.
I am wishing you tons of profits in 2025 and financial success.
Thank you for reading.
If you are new, feel free to follow.
Master Ananda for you (formerly Alan Santana).
Namaste.

$BTCUSD bottom between $61k-65kI think we're gearing up for one last move lower here in BTC, that should be the end of the bearish move and then we should continue higher from there.
I think it's most likely that we'll hit the $61k or GETTEX:64K support levels to mark the bottom. Why those levels?
That region is the 50% retracement off of the bottom. If we're still in a bull trend, that's where we should bounce.

Level to watch The market is currently at a critical juncture, facing a pivotal decision: either rallying back to 90,000 or breaking the key support level at 73,800.
Previously, I highlighted a potential top once the market reached 100,000, with an initial target around 74,000, which the market has already breached twice. At this stage, it’s a fierce battle between the bulls and the bears, making it challenging to predict the next move.
A rally from here could push the market back into the 85,000-90,000 range. If it breaks through 90,000, there’s potential for a climb to 108,000, possibly even 125,000.
On the other hand, a break below the crucial support at 73,800 could signal a deeper correction, potentially bringing the market down to 48,000.
I've been short on ETH and XRP, expecting a more bearish trend for both. ETH has already hit its target, while XRP could potentially drop back to 0.45.
The upcoming days will certainly be fascinating to watch.

#Bitcoin (April9)The most in-demand buying zones in Bitcoin —don’t miss the opportunity! :)
Naturally, you can freely use the levels for a new order or for TP of your positions. The levels are updated daily!
The results of price reaction to these levels will be shown in the upcoming videos.

Bitcoin Pullback Complete – Bears Gearing Up for Round Two!!!First of all, let me say that the market has been very excited these past few days, so be more careful with your capital management.
Also, these days, Bitcoin ( BINANCE:BTCUSDT ) has a high correlation with the US stock market indices , and one of the most important of them is the S&P 500 Index ( FOREXCOM:SPX500 ).
Today, I published the following analysis for the S&P 500 Index , which I used as a result of that analysis for Bitcoin .
Bitcoin is trading near the Resistance zone($81,610-$79,800) , the Yearly Pivot Point , the Daily Pivot Point , the important uptrend line (broken) , and the Cumulative Short Liquidation Leverage($81,500-$79,677).
Overall, it seems that this uptrend in Bitcoin over the past few hours was a pullback to the broken Important uptrend line and the liquidation of short position s. Do you agree with me?
In terms of Elliott Wave theory , it seems that the uptrend of the last few hours has been in the form of a Zigzag Correction(ABC/5-3-5) and we should expect another decline .
Based on the above explanation , I expect Bitcoin to resume its downtrend and approach the Potential Reversal Zone(PRZ) again ( after breaking the support lines ).
Cumulative Long Liquidation Leverage: $74,520-$73,244
If you want to see my overall view of Bitcoin on the weekly timeframe and further understand the significance of the Uptrend line(broken) , you can refer to the following idea:
Note: If Bitcoin can completely fill the CME Gap($84,475-$81,450), we should expect further increases.
Please respect each other's ideas and express them politely if you agree or disagree.
Bitcoin Analyze (BTCUSDT), 15-minute time frame.
Be sure to follow the updated ideas.
Do not forget to put a Stop loss for your positions (For every position you want to open).
Please follow your strategy and updates; this is just my Idea, and I will gladly see your ideas in this post.
Please do not forget the ✅' like '✅ button 🙏😊 & Share it with your friends; thanks, and Trade safe.
