$BTCUSD bottom between $61k-65kI think we're gearing up for one last move lower here in BTC, that should be the end of the bearish move and then we should continue higher from there.
I think it's most likely that we'll hit the $61k or GETTEX:64K support levels to mark the bottom. Why those levels?
That region is the 50% retracement off of the bottom. If we're still in a bull trend, that's where we should bounce.
Bitcoin (Cryptocurrency)

Level to watch The market is currently at a critical juncture, facing a pivotal decision: either rallying back to 90,000 or breaking the key support level at 73,800.
Previously, I highlighted a potential top once the market reached 100,000, with an initial target around 74,000, which the market has already breached twice. At this stage, it’s a fierce battle between the bulls and the bears, making it challenging to predict the next move.
A rally from here could push the market back into the 85,000-90,000 range. If it breaks through 90,000, there’s potential for a climb to 108,000, possibly even 125,000.
On the other hand, a break below the crucial support at 73,800 could signal a deeper correction, potentially bringing the market down to 48,000.
I've been short on ETH and XRP, expecting a more bearish trend for both. ETH has already hit its target, while XRP could potentially drop back to 0.45.
The upcoming days will certainly be fascinating to watch.

#Bitcoin (April9)The most in-demand buying zones in Bitcoin —don’t miss the opportunity! :)
Naturally, you can freely use the levels for a new order or for TP of your positions. The levels are updated daily!
The results of price reaction to these levels will be shown in the upcoming videos.

Bitcoin Pullback Complete – Bears Gearing Up for Round Two!!!First of all, let me say that the market has been very excited these past few days, so be more careful with your capital management.
Also, these days, Bitcoin ( BINANCE:BTCUSDT ) has a high correlation with the US stock market indices , and one of the most important of them is the S&P 500 Index ( FOREXCOM:SPX500 ).
Today, I published the following analysis for the S&P 500 Index , which I used as a result of that analysis for Bitcoin .
Bitcoin is trading near the Resistance zone($81,610-$79,800) , the Yearly Pivot Point , the Daily Pivot Point , the important uptrend line (broken) , and the Cumulative Short Liquidation Leverage($81,500-$79,677).
Overall, it seems that this uptrend in Bitcoin over the past few hours was a pullback to the broken Important uptrend line and the liquidation of short position s. Do you agree with me?
In terms of Elliott Wave theory , it seems that the uptrend of the last few hours has been in the form of a Zigzag Correction(ABC/5-3-5) and we should expect another decline .
Based on the above explanation , I expect Bitcoin to resume its downtrend and approach the Potential Reversal Zone(PRZ) again ( after breaking the support lines ).
Cumulative Long Liquidation Leverage: $74,520-$73,244
If you want to see my overall view of Bitcoin on the weekly timeframe and further understand the significance of the Uptrend line(broken) , you can refer to the following idea:
Note: If Bitcoin can completely fill the CME Gap($84,475-$81,450), we should expect further increases.
Please respect each other's ideas and express them politely if you agree or disagree.
Bitcoin Analyze (BTCUSDT), 15-minute time frame.
Be sure to follow the updated ideas.
Do not forget to put a Stop loss for your positions (For every position you want to open).
Please follow your strategy and updates; this is just my Idea, and I will gladly see your ideas in this post.
Please do not forget the ✅' like '✅ button 🙏😊 & Share it with your friends; thanks, and Trade safe.

[BTC] Crash to $26k: Generational Buying OpportunitySince 2022, Bitcoin has surged in a major bull market, hitting the psychological $100k milestone. However, a triple divergence on the weekly RSI signals an overbought market, pointing to an imminent pullback.
The recent peak likely marked the end of Wave (3). Given that Wave (2) was an expanding flat (verifiable on lower timeframes), Wave (4) should bring a sharp, significant correction.
Wave 4 of (3) formed a running triangle, followed by a short Wave 5—exactly as occurred. Running triangles in Wave 4 paired with a brief Wave 5 often indicate distribution, typically preceding a major move against the trend.
The price action from March 2024 into 2025 resembles classic distribution. Since peaking near $110k, Bitcoin has declined slowly but steadily, suggesting a major crash rather than a typical medium-term pullback.
The $26k–$30k range offers robust support, and it’s unlikely the price will drop much lower. Along the way, the 200-week moving average (MA200 Weekly)—Bitcoin’s strongest historical support—could trigger a significant bounce. However, if this level is decisively breached, full-blown panic could ensue.
Given my expectation of a 2008-style bear market in the S&P 500 (see related ideas), the timing aligns perfectly. A market-wide crash would inevitably impact Bitcoin, as panic drives capital out of all markets to meet margin calls.
The $26k zone should mark the crash’s bottom, potentially presenting a generational Bitcoin-buying opportunity. If the S&P 500 retests its COVID lows while Bitcoin only revisits its 2023 consolidation range, it would underscore BTC’s relative strength. Once panic subsides, capital could flood into Bitcoin from across the globe.
Technically, this would be the bottom of Wave (4). Wave (5) could then propel Bitcoin to $1 million per coin in a powerful uptrend.

[BTC] $1M Bitcoin Inevitable—After a $26k CrashToday, I posted predictions that Bitcoin (BTC) will crash to $26k and the S&P 500 (SPX) will retest COVID lows (see related ideas). Yet, I firmly believe that post-crash, Bitcoin will soar to $1 million per coin—an inevitable outcome that could unfold rapidly, perhaps within one or two years.
Consider this: Bitcoin is no longer a fringe, unproven technology. It’s the world’s largest and most robust computer network, running without downtime for 16 years.
Critics argue quantum computing will kill it, but they overlook a key point: if quantum computers break traditional encryption, the entire internet, banking system, and digital infrastructure collapse too. Is this possible? Yes, but humanity tends to solve such challenges. By then, quantum-resistant cryptography will likely be implemented, and no profit-driven miner will resist it.
Hyperbitcoinization, forecasted 11 years ago (hyperbitcoinization.com), is unfolding now. Reports suggest 60–70% of hodlers never sell, stabilizing supply. Meanwhile, demand is surging globally. Individuals are pouring savings into Bitcoin, selling homes, borrowing, and maxing out credit cards. Visionaries like Michael Saylor borrow billions to buy more. New demand streams keep emerging: ETFs enable retirement account investments, seasoned “wise” investors are finally onboard, institutions are piling in, banks worldwide offer Bitcoin accounts, nation-states and politicians join the fray. Capital is flooding into Bitcoin from every corner, draining other markets.
This is arguably the strongest bull market in modern history. Bitcoin’s price lacks traditional fundamentals—it’s a psychological market fueled by belief and emotion. Emotionally charged bull markets don’t fizzle out with quiet distribution; they end in a euphoric squeeze beyond imagination. What’s happening resembles a market cornering (en.wikipedia.org) —not by a malicious group, but by humanity-wide groupthink. Think Tulip Mania or the Dutch East India Company. Skeptical? Read Extraordinary Popular Delusions and the Madness of Crowds by Charles Mackay.
Bull markets don’t die under selling pressure; they collapse when demand is exhausted. But with capital being siphoned from all markets, when will demand dry up? Only when the price reaches a level requiring infinite capital to push higher. No one knows exactly when, but it won’t be before $1 million per Bitcoin.
If my 2008-style SPX crash prediction (see related ideas) proves correct and Bitcoin only falls to 2023 levels ($26k), its resilience will shine. While the SPX retests COVID lows, Bitcoin’s shallower drop would signal unmatched strength.
TECHNICAL ANALYSIS
Bitcoin’s long-term chart is stunning. Since the 2018 bottom, it’s traced Elliott Waves , , , and . From the 2022 low, we’re in Wave . A pullback to $26k would be Wave (4) within the larger —unlikely to dip much lower.
Since inception, the 200-week moving average (MA200 Weekly) has been Bitcoin’s bedrock, supporting every bear market. Odds favor it holding again. A crash to $26k would confirm a four-year consolidation/reaccumulation phase. Once it breaks out, the move will be explosive.
This reaccumulation also resembles a rounding bottom, cup-and-handle, and inverse head-and-shoulders pattern—classic bullish signals in a strong trend, promising a massive upward surge post-breakout.

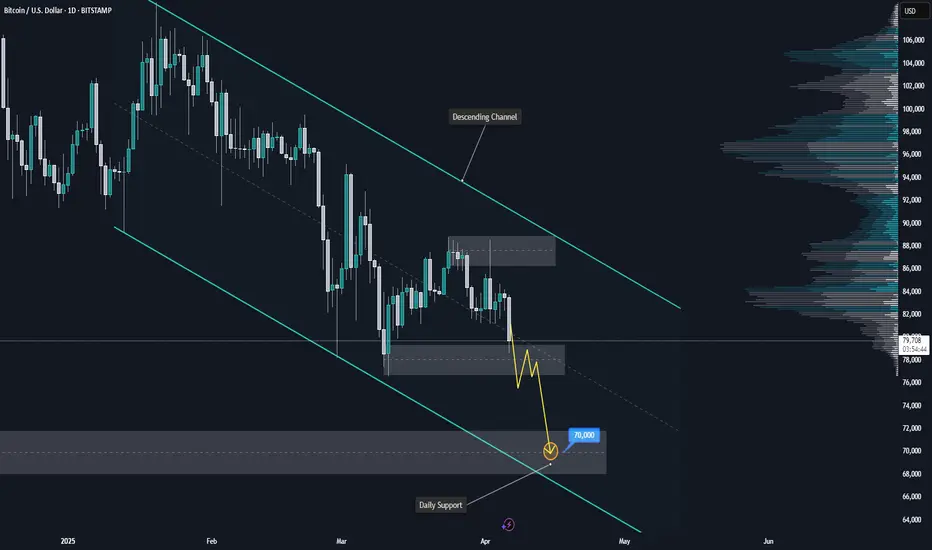
BITCOIN Downtrend Continues – Is $70K the Next Stop?COINBASE:BTCUSD continues to trade within a well-defined descending channel, maintaining a clear bearish market structure on the daily timeframe. After a strong rejection from the upper boundary of the channel, the price has retraced to a minor support zone around $78,000.
Given the prevailing momentum and strength of the broader downtrend, this support is likely to break under continued selling pressure. A clean breakdown below this level would reinforce the bearish bias and open the door for a move toward the daily support zone near $70,000, which aligns with the lower boundary of the channel.
This zone marks a potential area of interest where price may react or attempt a short-term bounce. However, unless there is a significant shift in momentum, the path of least resistance remains to the downside.
Traders should watch for confirmation of the bearish continuation, such as lower highs, weak bullish pullbacks, or increased volume on red candles, before considering short entries.
If you align with this outlook or have additional perspectives, feel free to share your thoughts below.
ETH - Last chance for Ethereum at this area or...?This blue box last chance or i'll probably quit eth :(
0.786 fib + weekly buy zone + insane buy walls on order book
Pectra Upgrade is in a month...
Good luck

BTCUSD: Last chance to prove the Bull Cycle is still intact.Bitcoin remains bearish on its 1W technical outlook (RSI = 40.819, MACD = 1234.500, ADX = 47.185) as it is on the 3rd red 1W candle in a row, which just hit the 1W MA50. First contact since Sep 2nd 2024. The weeky low is also almost at the HL bottom of the Bull Cycle's Channel Up. Needless to say, it has to hold in order for the bullish trend to continue. Practically this is the market's last chance to prove that the Bull Cycle is still intact. So far the -32% decline is no different that all prior inside the Channel Up but an Arc shaped bottom needs to start forming. If it does and that's the new bottom, expect $160,000 by September.
## If you like our free content follow our profile to get more daily ideas. ##
## Comments and likes are greatly appreciated. ##

Trader's Alert: Gold Potential Top, Signal (Bullish Bitcoin)Gold today is making a strong move after hitting a new All-Time High. The current session is red and has the highest volume since November 2024. This is an early signal that can be interpreted as the top being printed. Very early.
Gold peaking can have a strong significance for us Cryptocurrency traders. Gold has been in a strong uptrend since December 2024. Bitcoin peaked and went sideways with bearish tendencies in December 2024. They have been moving in contrary direction. This can mean that a Gold top would produce a Bitcoin bottom.
The Gold peak can mean a change in market dynamics, all markets. Bullish goes bearish and bearish goes bullish.
Gold is still bullish on the weekly timeframe but with a parabolic rise. A parabolic rise tends to end with a sudden crash. A true parabola.
This is a friendly alert to all Gold traders.
XAUUSD is likely to go down.
Confirmation is needed.
Thank you for reading.
Namaste.

1day chart fallingwedge/bullish pennant on bitcoinI just posted a weekly version of this same pennant in the previous idea which I will link below, i wanted to also post the version of it on the 1day timeframe as well because the top trendline of the wedge on the 1day time frame has a different trajectory which lengthens the wedge considerably. With this longer wedge we can see that if it is the more valid for the 2 versions, that we probably wouldn’t be expecting a breakout until June at the earliest. Not quite sure yet which version of this wedge is ore valid so I’m posting both versions for now to keep and eye on them. For the weekly charts pattern to be the more valid of the 2, we will likely need to see the weekly 50ma continue to maintain support. *not financial advice*

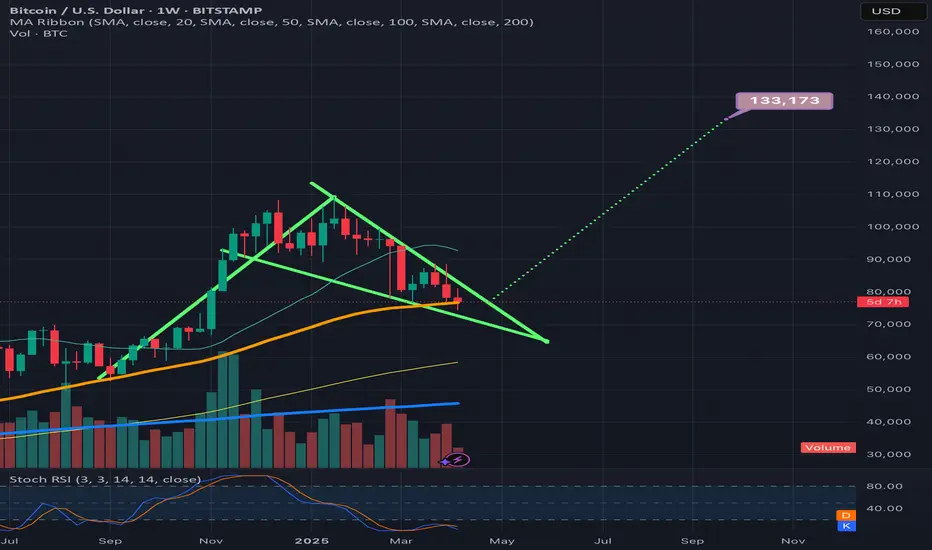
BTCUSD. Weekly bull pennantThe daily failing wedge’s top trendline is not as sharp of a trajectory as the the weekly timeframe’s and due to this, the daily time frames wege is noticeably longer, so I thinkI am going to post a follow p idea to this one that shows the longer version of the wedge, not sure which one is more valid yet at this current time. If the weekly 50ma(in orange) can hold support then we should break up from this wedge right around where I have placed the dotted measured move lne, in which case the breakout target would be around 133k, if the longer version of the wedge on the daily time frame is the more valid of the two then we will likely have to correct longer before we see a breakout. Will post the longer version n the very next idea post. *not financial advice*
Bitcoin Plan.I tried to explain simply the things to pay attention to.
* The purpose of my graphic drawings is purely educational.
* What i write here is not an investment advice. Please do your own research before investing in any asset.
* Never take my personal opinions as investment advice, you may lose your money.

TradeCityPro | Bitcoin Daily Analysis #55👋 Welcome to TradeCity Pro!
Let's delve into the analysis of Bitcoin and key crypto indices, focusing today on the New York futures session triggers as usual.
🔄 Yesterday, the market was in a corrective phase of a downward trend, coinciding with news about the date of a meeting between Iran and the USA, which caused a slight upward movement in the market.
📊 As I mentioned, due to the low market volume, any news from the USA can significantly impact the price. The news was that Iran and the USA have scheduled a meeting for Saturday to negotiate an agreement.
📰 However, a more significant news item that the whole world is waiting for is China's reaction to the 35% tariffs imposed by the USA. Trump has declared that if China does not accept these tariffs within the next few days, he will increase them to 50%.
🎲 If this happens, the next downward leg in price might begin. However, if news comes out that these two countries are nearing an agreement and are ready to negotiate tariffs, the market will undoubtedly move upwards, and this news could even be the start of a new bullish trend.
Let's move on to the chart to find the technical triggers.
⏳ 1-Hour Timeframe
As I said yesterday, with the breaking of the 50 area in the RSI, the price underwent a deeper correction and moved upwards.
⭐ It appears that an ascending structure is forming, and the price is steadily moving upwards. However, this movement doesn't have much upward momentum, and its volume isn't very high.
🔽 Today, for a short position, we can open a position in line with the trend at a high risk with the break of the 78913 area. The price has corrected to a reasonable extent and has pulled back near the SMA99. If the price moves towards this SMA and gets rejected, the importance of breaking 78913 will increase.
📉 The main trigger is currently the 74760 area, which is the market's primary floor. However, in general, I believe that the market structure isn't yet in a state where we should open major positions, and we should wait for more structure to form. This way, we can open more secure and precise positions, which would allow us to take higher risks and ultimately make more profit.
💫 If you want to open a short position with the break of 78913, the RSI moving below the 50 area could be a good confirmation, but be careful not to involve too much risk.
👑 BTC.D Analysis
Let's move to the analysis of Bitcoin dominance, which is still ascending and has created a temporary support floor at 63.30. If this area breaks, we might temporarily confirm a decline in dominance.
🚀 Keep in mind that the dominance trend is bullish in all market cycles, and breaking this area does not mean a bearish trend. However, if it breaks 63.30, dominance might pull back to 63.07 and could enter a correction phase for a few days, which would impact our position choices.
✔️ If dominance is supported from this area, the likelihood of its continued growth increases.
📅 Total2 Analysis
Moving on to the analysis of Total2, as you can see, with the slight correction of Bitcoin dominance, this index has performed slightly better than Bitcoin and has currently reached a similar peak at 920.
📉 The short trigger I gave on Bitcoin at 78913 is a better trigger compared to Total2, where the 896 area has not yet been tested and is riskier than Bitcoin.
🔼 For long positions, you can open one with the break of 920, but I do not recommend it because the market is in a downward trend, and there is a downward momentum in the market, and since I do not trade against the trend, I also do not recommend that you take a long position against the downward trend.
📅 USDT.D Analysis
Finally, the analysis of Tether dominance is performing similarly to Total2 and is currently fluctuating between 5.73 and 5.84.
✨ Both of these areas could be used as triggers, but as I mentioned, it's better to wait for the market to create more structure and reveal the main triggers.
❌ Disclaimer ❌
Trading futures is highly risky and dangerous. If you're not an expert, these triggers may not be suitable for you. You should first learn risk and capital management. You can also use the educational content from this channel.
Finally, these triggers reflect my personal opinions on price action, and the market may move completely against this analysis. So, do your own research before opening any position.

$ETH why is it cancelled? Things you porobably need to know.There are several reasons why CRYPTOCAP:ETH is being sidelined—some obvious, others you may not have considered. Here's my analysis.
Let’s be clear: something is wrong in this cycle, and the ETF providers are at the heart of the problem.
The famous line, *"there is no second best"*, rings true—because they ensure no one overshadows their main asset: $BTC.
They’ve already tried to destroy crypto outright—really hard—and failed. The elites are 100% devoted to the USD; it’s their lifeblood. Crypto, especially stablecoins like USDT or USDC, became a competitor, and they did everything possible to wreck the market. When direct attacks didn’t work, they turned to a new strategy: controlling it from the inside.
They embraced crypto, and now they’re making billions off crypto enthusiasts who mistakenly believe these players are here for their benefit. This won’t last forever, but that’s a topic for another day.
Now, let’s address why Ethereum is underperforming—and why it’s likely to continue.
### 1. **Corruption in the Proof-of-Stake System**
All PoS systems rely on staking: the more you stake, the more rewards you earn. Typical staking rewards in crypto average about 10% APR, significantly higher than traditional bank interest rates.
But here’s the catch: these rewards are minted, creating inflation because more coins are constantly being dumped into the market. This results in a class of "retired" investors who stake massive amounts, live off their staking rewards, and sell them without ever touching their capital. This creates constant sell pressure on PoS coins.
The Ethereum Foundation controls how much staking is rewarded. Because it’s run by the same people staking, their vested interest is to keep APRs high, even though this fuels inflation. Ironically, Ethereum’s inflation rivals the USD—a troubling reality for a crypto meant to outperform traditional finance.
### 2. **Ethereum’s Ripple Effect on the Market**
Most altcoins rely on Solidity smart contracts, meaning Ethereum’s performance directly impacts the broader altcoin market. When Ethereum underperforms, it drags down Layer 2 solutions, DeFi projects, and the entire altcoin ecosystem.
Knowing this, why did ETF providers rush to approve ETH ETFs? Simple: *“There is no second best.”*
By taming Ethereum, ETF providers manipulate the market to keep Bitcoin afloat, cancel bear markets, and kill any chance of an altseason. On-chain data shows their strategy: when they buy Bitcoin, they sell Ethereum. This frustrates altcoin holders, pushing them to dump their bags and pivot toward—guess what—Bitcoin.
### 3. **The ETF Trojan Horse**
Ethereum, with its corrupt foundation, is the perfect tool for entities like BlackRock to maintain Bitcoin dominance. By doing so, they effectively prevent bear markets and suppress altseasons.
But this strategy has an endpoint. ETFs will milk the crypto space for as much profit as possible. Once they’ve extracted enough, they’ll dump their holdings, funneling all that capital back into USD. This has been their plan all along.
When that happens, the crypto market—including Bitcoin—will crash. Ethereum’s role has essentially been to funnel cash into Bitcoin, making it easier for institutions to accumulate wealth before transferring it all back into USD.
---
In short, Ethereum is being used as a tool in the ETF providers' larger scheme. It’s not about creating a thriving ecosystem but about maintaining dominance, controlling markets, and ultimately cashing out into the USD.

TRUMP EFFECT BTC is being prepared for correctionBITCOIN IS READY FOR CORRECTION OR CONTINUES ITS DOWNWARD TREND
fool trump
trump decide to destroy world economy

BITCOIN Will Move Lower! Sell!
Take a look at our analysis for BITCOIN.
Time Frame: 30m
Current Trend: Bearish
Sentiment: Overbought (based on 7-period RSI)
Forecast: Bearish
The market is testing a major horizontal structure 79,880.44.
Taking into consideration the structure & trend analysis, I believe that the market will reach 78,453.18 level soon.
P.S
The term oversold refers to a condition where an asset has traded lower in price and has the potential for a price bounce.
Overbought refers to market scenarios where the instrument is traded considerably higher than its fair value. Overvaluation is caused by market sentiments when there is positive news.
Disclosure: I am part of Trade Nation's Influencer program and receive a monthly fee for using their TradingView charts in my analysis.
Like and subscribe and comment my ideas if you enjoy them!

#Bitcoin is in a bull run!#Bitcoin is in a bull run!
Even if you are exposed to maximum pain, you have to deal with it, not in CRYPTOCAP:BTC bear season!

Bitcoin Technical Breakdown – Bearish Channel in Motionhello guys.
🔻 1. Bearish Channel
Bitcoin is currently respecting a downward-sloping channel with lower highs and lower lows.
Every attempt to break the upper boundary has been met with rejection, confirming bearish pressure.
🔁 2. Retest of Former Trendline
The former ascending trendline (drawn from 2023’s bottom) was broken and recently retested as resistance, failing to flip it back to support.
This retest often signals confirmation of trend reversal.
🧱 3. Critical Support Zone: $62K– FWB:65K
This zone served as a strong accumulation range in the past and aligns with the current downside target.
____________________________
🔮 What’s Next?
Based on this pattern and price behavior:
Bitcoin may continue its bearish descent, following the projected zig-zag pattern in the channel.
The next significant bounce area lies around $64,000, aligning with both volume-based support and previous breakout zones.

Bitcoin Long Term Projection ModelAn evolving projection on BITCOIN. Using time and experience in the market as well as Elliot Wave methods this is my projection of the market.

The last bullish chance of Bitcoin in mid-term !!BTC is in a Falling Wedge Pattern. This means The Bulls Have Higher Chance To Claim The Trend Than Bears! No Break out Has Happened yet and we shall wait for a Break out But It should Happen Pretty Soon Because there is also a Regular Bullish Divergence On MACD as well! So The Bullish Chance for BTC Is Pretty High and we Shall see a Bullish Movement Up to $100K Pretty Quick!
-BTC is in a Falling wedge Pattern
-No Break out
-(+RD) on MACD
Give me some energy !!
✨We spend hours finding potential opportunities and writing useful ideas, we would be happy if you support us.
Best regards CobraVanguard.💚
_ _ _ _ __ _ _ _ _ _ _ _ _ _ _ _ _ _ _ _ _ _ _ _ _ _ _ _ _ _ _ _
✅Thank you, and for more ideas, hit ❤️Like❤️ and 🌟Follow🌟!
⚠️Things can change...
The markets are always changing and even with all these signals, the market changes tend to be strong and fast!!

Bitcoin will be super bullish soon (1D)The market maker has created a scenario that makes everyone believe the bear market started a while ago. However, there are signs on the chart showing that Bitcoin may register a new ATH.
The best zone for rebuying Bitcoin is the green area.
From the green zone, we expect Bitcoin to move toward the specified targets.
The closure of a daily candle below the invalidation level will invalidate this analysis.
Do not enter the position without capital management and stop setting
Comment if you have any questions
thank you

ETH ANALYSIS🔮 #ETH Analysis :: Support & Resistance Trading
💲💲 #ETH is trading between support and resistance area. If #ETH sustains above major support area then we will a bullish move and if not then we will see more bearish move in #ETH then could expect a pullback.
💸Current Price -- $1564
⁉️ What to do?
- We have marked crucial levels in the chart . We can trade according to the chart and make some profits. 🚀💸
#ETH #Cryptocurrency #DYOR
